2001 NEW YORK, CENTRAL PARK, NEW YORK (NYC)
New York City, in area exceeding 300 square miles, is located on the Atlantic coastal plain at the mouth of the Hudson River. The terrain is laced with numerous waterways, all but one of the five boroughs in the city are situated on islands. Elevations range from less than 50 feet over most of Manhattan, Brooklyn, and Queens to almost 300 feet in northern Manhattan and the Bronx, and over 400 feet in Staten Island. Extensive suburban areas on Long Island, and in Connecticut, New York State and New Jersey border the city on the east, north, and west. About 30 miles to the west and northwest, hills rise to about 1,500 feet and to the north in upper Westchester County to 800 feet. To the southwest and to the east are the low–lying land areas of the New Jersey coastal plain and of Long Island, bordering on the Atlantic.
The New York Metropolitan area is close to the path of most storm and frontal systems which move across the North American continent. Therefore, weather conditions affecting the city most often approach from a westerly direction. New York City can thus experience higher temperatures in summer and lower ones in winter than would otherwise be expected in a coastal area. However, the frequent passage of weather systems often helps reduce the length of both warm and cold spells, and is also a major factor in keeping periods of prolonged air stagnation to a minimum.
Although continental influence predominates, oceanic influence is by no means absent. During the summer local sea breezes, winds blowing onshore from the cool water surface, often moderate the afternoon heat. The effect of the sea breeze diminishes inland. On winter mornings, ocean temperatures which are warm relative to the land reinforce the effect of the city heat island and low temperatures are often 10–20 degrees lower in the inland suburbs than in the central city. The relatively warm water temperatures also delay the advent of winter snows. Conversely, the lag in warming of water temperatures keeps spring temperatures relatively cool. One year–round measure of the ocean influence is the small average daily variation in temperature.
Precipitation is moderate and distributed fairly evenly throughout the year. Most of the rainfall from May through October comes from thunderstorms, usually of brief duration and sometimes intense. Heavy rains of long duration associated with tropical storms occur infrequently in late summer or fall. For the other months of the year precipitation is more likely to be associated with widespread storm areas, so that day–long rain, snow or a mixture of both is more common. Coastal storms, occurring most often in the fall and winter months, produce on occasion considerable amounts of precipitation and have been responsible for record rains, snows, and high winds.
The average annual precipitation is reasonably uniform within the city but is higher in the northern and western suburbs and less on eastern Long Island. Annual snowfall totals also show a consistent increase to the north and west of the city with lesser amounts along the south shores and the eastern end of Long Island, reflecting the influence of the ocean waters.
Local Climatological Data is published for three locations in New York City, Central Park, La Guardia Airport, and John F. Kennedy International Airport. Other nearby locations for which it is published are Newark, New Jersey, and Bridgeport, Connecticut.
Based on the 1951–1980 period, the average first occurrence of 32 degrees Fahrenheit in the fall is November 11 and the average last occurrence in the spring is April 1.
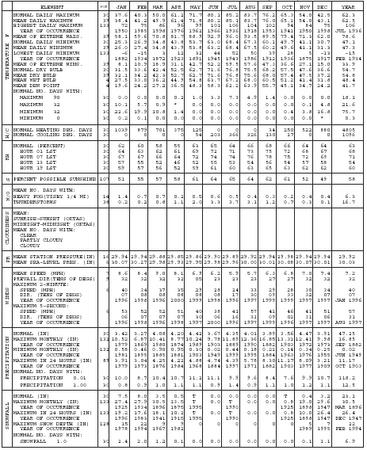
NORMALS, MEANS, AND EXTREMES
NEW YORK C. PARK, NY (NYC)
LATITUDE: LONGITUDE: ELEVATION (FT): TIME ZONE: WBAN: 94728
40 47′ 0 ″ N 73 58′ 0 ″ W GRND: 158 BARO: � A0;161 EASTERN (UTC + 5)
| ELEMENT | POR | JAN | FEB | MAR | APR | MAY | JUN | JUL | AUG | SEP | OCT | NOV | DEC | YEAR | |
| TEMPERATURE F | NORMAL DAILY MAXIMUM | 30 | 37.6 | 40.3 | 50.0 | 61.2 | 71.7 | 80.1 | 85.2 | 83.7 | 76.2 | 65.3 | 54.0 | 42.5 | 62.3 |
| MEAN DAILY MAXIMUM | 39 | 38.4 | 41.2 | 49.9 | 61.4 | 71.8 | 80.2 | 85.1 | 83.7 | 76.0 | 65.1 | 54.0 | 43.1 | 62.5 | |
| HIGHEST DAILY MAXIMUM | 133 | 72 | 75 | 86 | 96 | 99 | 101 | 106 | 104 | 102 | 94 | 84 | 75 | 106 | |
| YEAR OF OCCURRENCE | 1950 | 1985 | 1998 | 1976 | 1962 | 1966 | 1936 | 1918 | 1953 | 1941 | 1950 | 1998 | JUL 1936 | ||
| MEAN OF EXTREME MAXS. | 39 | 58.1 | 59.6 | 70.8 | 81.7 | 88.9 | 92.9 | 96.0 | 93.5 | 89.5 | 79.4 | 71.3 | 62.0 | 78.6 | |
| NORMAL DAILY MINIMUM | 30 | 25.3 | 26.9 | 34.8 | 43.8 | 53.7 | 63.0 | 68.4 | 67.3 | 60.1 | 49.7 | 41.1 | 30.7 | 47.1 | |
| MEAN DAILY MINIMUM | 39 | 26.0 | 27.4 | 34.8 | 43.9 | 53.8 | 63.2 | 68.4 | 67.5 | 60.2 | 49.6 | 41.1 | 31.3 | 47.3 | |
| LOWEST DAILY MINIMUM | 133 | -6 | -15 | 3 | 12 | 32 | 44 | 52 | 50 | 39 | 28 | 5 | -13 | -15 | |
| YEAR OF OCCURRENCE | 1882 | 1934 | 1872 | 1923 | 1891 | 1945 | 1943 | 1986 | 1912 | 1936 | 1875 | 1917 | FEB 1934 | ||
| MEAN OF EXTREME MINS. | 39 | 8.1 | 10.9 | 18.9 | 31.1 | 42.7 | 52.2 | 59.5 | 57.6 | 47.3 | 36.6 | 27.1 | 15.0 | 33.9 | |
| NORMAL DRY BULB | 30 | 31.5 | 33.6 | 42.4 | 52.5 | 62.7 | 71.6 | 76.8 | 75.5 | 68.2 | 57.5 | 47.6 | 36.6 | 54.7 | |
| MEAN DRY BULB | 39 | 32.1 | 34.2 | 42.3 | 52.7 | 62.7 | 71.6 | 76.8 | 75.6 | 68.0 | 57.4 | 47.5 | 37.2 | 54.8 | |
| MEAN WET BULB | 4 | 27.5 | 33.0 | 36.2 | 44.9 | 54.8 | 63.7 | 67.2 | 68.0 | 60.5 | 51.2 | 41.4 | 31.8 | 48.4 | |
| MEAN DEW POINT | 4 | 19.6 | 24.2 | 27.2 | 36.5 | 48.3 | 58.3 | 62.2 | 63.9 | 55.7 | 45.1 | 34.7 | 24.2 | 41.7 | |
| NORMAL NO. DAYS WITH: | |||||||||||||||
| MAXIMUM 90 | 30 | 0.0 | 0.0 | 0.0 | 0.2 | 1.0 | 3.3 | 7.3 | 4.9 | 1.4 | 0.0 | 0.0 | 0.0 | 18.1 | |
| MAXIMUM 32 | 30 | 10.1 | 5.7 | 0.9 | * | 0.0 | 0.0 | 0.0 | 0.0 | 0.0 | 0.0 | 0.1 | 4.8 | 21.6 | |
| MINIMUM 32 | 30 | 22.6 | 19.9 | 10.8 | 1.4 | 0.0 | 0.0 | 0.0 | 0.0 | 0.0 | 0.4 | 3.8 | 16.8 | 75.7 | |
| MINIMUM 0 | 30 | 0.2 | 0.1 | 0.0 | 0.0 | 0.0 | 0.0 | 0.0 | 0.0 | 0.0 | 0.0 | 0.0 | * | 0.3 | |
| H/C | NORMAL HEATING DEG. DAYS | 30 | 1039 | 879 | 701 | 375 | 125 | 0 | 0 | 0 | 34 | 250 | 522 | 880 | 4805 |
| NORMAL COOLING DEG. DAYS | 30 | 0 | 0 | 0 | 0 | 54 | 203 | 366 | 326 | 130 | 17 | 0 | 0 | 1096 | |
| RH | NORMAL (PERCENT) | 30 | 62 | 60 | 58 | 55 | 63 | 65 | 64 | 66 | 68 | 66 | 64 | 64 | 63 |
| HOUR 01 LST | 30 | 64 | 63 | 62 | 61 | 69 | 72 | 71 | 73 | 75 | 72 | 68 | 67 | 68 | |
| HOUR 07 LST | 30 | 67 | 67 | 66 | 64 | 72 | 74 | 74 | 76 | 78 | 75 | 72 | 69 | 71 | |
| HOUR 13 LST | 30 | 57 | 55 | 52 | 46 | 52 | 55 | 53 | 54 | 56 | 54 | 57 | 58 | 54 | |
| HOUR 19 LST | 30 | 59 | 57 | 56 | 52 | 59 | 61 | 60 | 63 | 65 | 63 | 62 | 62 | 60 | |
| S | PERCENT POSSIBLE SUNSHINE | 107 | 51 | 55 | 57 | 58 | 61 | 64 | 65 | 64 | 62 | 61 | 52 | 49 | 58 |
| W/O | MEAN NO. DAYS WITH: | ||||||||||||||
| HEAVY FOG(VISBY 1/4 MI) | 14 | 1.4 | 0.7 | 0.7 | 0.2 | 0.5 | 0.6 | 0.5 | 0.4 | 0.3 | 0.2 | 0.4 | 0.4 | 6.3 | |
| THUNDERSTORMS | 38 | 0.2 | 0.2 | 0.8 | 1.1 | 2.0 | 3.3 | 3.7 | 3.1 | 1.2 | 0.7 | 0.3 | 0.1 | 16.7 | |
| CLOUDINESS | MEAN: | ||||||||||||||
| SUNRISE-SUNSET (OKTAS) | |||||||||||||||
| MIDNIGHT-MIDNIGHT (OKTAS) | |||||||||||||||
| MEAN NO. DAYS WITH: | |||||||||||||||
| CLEAR | |||||||||||||||
| PARTLY CLOUDY | |||||||||||||||
| CLOUDY | |||||||||||||||
| PR | MEAN STATION PRESSURE(IN) | 16 | 29.94 | 29.94 | 29.88 | 29.85 | 29.86 | 29.90 | 29.89 | 29.92 | 29.94 | 29.98 | 29.94 | 29.94 | 29.92 |
| MEAN SEA-LEVEL PRES. (IN) | 6 | 30.07 | 30.27 | 29.98 | 29.93 | 29.95 | 29.98 | 29.96 | 30.00 | 30.01 | 30.08 | 30.07 | 30.01 | 30.03 | |
| WINDS | MEAN SPEED (MPH) | 7 | 8.6 | 8.4 | 9.0 | 8.1 | 6.9 | 6.2 | 5.9 | 5.7 | 6.3 | 6.8 | 7.0 | 7.4 | 7.2 |
| PREVAIL. DIR (TENS OF DEGS) | 9 | 32 | 32 | 32 | 32 | 05 | 23 | 23 | 23 | 27 | 27 | 32 | 32 | 32 | |
| MAXIMUM 2-MINUTE: | |||||||||||||||
| SPEED (MPH) | 6 | 40 | 34 | 37 | 35 | 29 | 28 | 24 | 33 | 29 | 28 | 30 | 34 | 40 | |
| DIR. (TENS OF DEGS) | 07 | 08 | 08 | 08 | 08 | 08 | 17 | 30 | 09 | 33 | 32 | 07 | 07 | ||
| YEAR OF OCCURRENCE | 1996 | 1998 | 1996 | 2000 | 1999 | 1998 | 1996 | 1997 | 1999 | 1999 | 1997 | 1997 | JAN 1996 | ||
| MAXIMUM 5-SECOND: | |||||||||||||||
| SPEED (MPH) | 6 | 53 | 52 | 52 | 51 | 40 | 38 | 41 | 57 | 41 | 46 | 41 | 51 | 57 | |
| DIR. (TENS OF DEGS) | 06 | 07 | 07 | 07 | 30 | 06 | 16 | 31 | 09 | 02 | 31 | 06 | 31 | ||
| YEAR OF OCCURRENCE | 1996 | 1998 | 1996 | 1998 | 1997 | 2000 | 1996 | 1997 | 1999 | 1996 | 1997 | 1997 | AUG 1997 | ||
| PRECIPITATION | NORMAL (IN) | 30 | 3.42 | 3.27 | 4.08 | 4.20 | 4.42 | 3.67 | 4.35 | 4.01 | 3.89 | 3.56 | 4.47 | 3.91 | 47.25 |
| MAXIMUM MONTHLY (IN) | 132 | 10.52 | 6.87 | 10.41 | 8.77 | 10.24 | 9.78 | 11.89 | 12.36 | 16.85 | 13.31 | 12.41 | 9.98 | 16.85 | |
| YEAR OF OCCURRENCE | 1979 | 1869 | 1980 | 1874 | 1989 | 1903 | 1889 | 1990 | 1882 | 1903 | 1972 | 1973 | SEP 1882 | ||
| MINIMUM MONTHLY (IN) | 132 | 0.58 | 0.46 | 0.90 | 0.95 | 0.30 | 0.02 | 0.44 | 0.18 | 0.21 | 0.14 | 0.34 | 0.25 | 0.02 | |
| YEAR OF OCCURRENCE | 1981 | 1895 | 1885 | 1881 | 1903 | 1949 | 1999 | 1995 | 1884 | 1963 | 1976 | 1955 | JUN 1949 | ||
| MAXIMUM IN 24 HOURS (IN) | 89 | 3.91 | 3.04 | 4.25 | 4.22 | 4.88 | 4.74 | 4.39 | 5.78 | 8.30 | 11.17 | 8.09 | 3.21 | 11.17 | |
| YEAR OF OCCURRENCE | 1979 | 1973 | 1876 | 1984 | 1968 | 1884 | 1997 | 1971 | 1882 | 1903 | 1977 | 1909 | OCT 1903 | ||
| NORMAL NO. DAYS WITH: | |||||||||||||||
| PRECIPITATION 0.01 | 30 | 10.0 | 8.7 | 10.4 | 10.7 | 11.2 | 11.1 | 9.9 | 9.6 | 8.4 | 7.6 | 9.9 | 10.7 | 118.2 | |
| PRECIPITATION 1.00 | 30 | 0.8 | 0.9 | 1.0 | 1.1 | 1.1 | 0.9 | 1.4 | 0.9 | 1.1 | 1.0 | 1.2 | 1.1 | 12.5 | |
| SNOWFALL | NORMAL (IN) | 30 | 7.5 | 8.0 | 3.5 | 0.5 | T | 0.0 | 0.0 | 0.0 | 0.0 | T | 0.4 | 3.2 | 23.1 |
| MAXIMUM MONTHLY (IN) | 133 | 27.4 | 27.9 | 30.5 | 13.5 | T | 0.0 | T | 0.0 | 0.0 | 0.8 | 19.0 | 29.6 | 30.5 | |
| YEAR OF OCCURRENCE | 1925 | 1934 | 1896 | 1875 | 1995 | 1990 | 1925 | 1898 | 1947 | MAR 1896 | |||||
| MAXIMUM IN 24 HOURS (IN) | 133 | 19.2 | 17.6 | 18.1 | 10.2 | T | 0.0 | T | 0.0 | 0.0 | 0.8 | 10.0 | 26.4 | 26.4 | |
| YEAR OF OCCURRENCE | 1996 | 1983 | 1941 | 1915 | 1995 | 1990 | 1925 | 1898 | 1947 DEC | 1947 | |||||
| MAXIMUM SNOW DEPTH (IN) | 128 | 15 | 22 | 9 | 9 | 0 | 0 | 0 | 0 | 0 | 0 | 5 | 7 | 22 | |
| YEAR OF OCCURRENCE | 1978 | 1994 | 1967 | 1982 | 1989 | 1995 | FEB 1994 | ||||||||
| NORMAL NO. DAYS WITH: | |||||||||||||||
| SNOWFALL 1.0 | 30 | 2.4 | 2.0 | 1.2 | 0.1 | 0.0 | 0.0 | 0.0 | 0.0 | 0.0 | 0.0 | 0.1 | 1.1 | 6.9 |
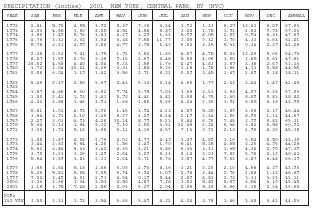
| PRECIPITATION (inches) 2001 NEW YORK, CENTRAL PARK, NY (NYC) | |||||||||||||
| YEAR | JAN | FEB | MAR | APR | MAY | JUN | JUL | AUG | SEP | OCT | NOV | DEC | ANNUAL |
| 1972 | 2.41 | 5.90 | 4.55 | 3.92 | 8.39 | 9.30 | 4.54 | 1.92 | 1.33 | 6.27 | 12.41 | 6.09 | 67.03 |
| 1973 | 4.53 | 4.55 | 3.60 | 8.05 | 4.51 | 4.55 | 5.89 | 3.08 | 2.75 | 3.92 | 1.82 | 9.98 | 57.23 |
| 1974 | 3.80 | 1.49 | 5.76 | 3.83 | 4.29 | 3.29 | 1.33 | 5.99 | 8.05 | 2.59 | 0.94 | 6.33 | 47.69 |
| 1975 | 4.76 | 3.33 | 3.32 | 3.04 | 3.38 | 7.58 | 11.77 | 3.05 | 9.32 | 3.70 | 4.33 | 3.63 | 61.21 |
| 1976 | 5.78 | 3.13 | 2.99 | 2.80 | 4.77 | 2.78 | 1.42 | 6.52 | 3.15 | 5.31 | 0.34 | 2.29 | 41.28 |
| 1977 | 2.25 | 2.51 | 7.41 | 3.75 | 1.71 | 3.83 | 1.60 | 4.57 | 4.75 | 5.03 | 12.26 | 5.06 | 54.73 |
| 1978 | 8.27 | 1.59 | 2.73 | 2.38 | 9.15 | 1.69 | 4.48 | 5.50 | 4.06 | 1.50 | 2.85 | 5.61 | 49.81 |
| 1979 | 10.52 | 4.58 | 4.40 | 4.04 | 6.23 | 1.56 | 1.76 | 4.27 | 4.83 | 3.87 | 3.38 | 2.69 | 52.13 |
| 1980 | 1.72 | 1.04 | 10.41 | 8.26 | 2.33 | 3.84 | 5.26 | 1.16 | 1.98 | 3.86 | 4.11 | 0.58 | 44.55 |
| 1981 | 0.58 | 6.04 | 1.19 | 3.42 | 3.56 | 2.71 | 6.21 | 0.59 | 3.45 | 3.49 | 1.69 | 5.18 | 38.11 |
| 1982 | 6.46 | 2.37 | 2.56 | 5.67 | 2.43 | 5.12 | 3.14 | 4.66 | 1.77 | 2.31 | 3.44 | 1.47 | 41.40 |
| 1983 | |||||||||||||
| 1984 | 1.87 | 4.86 | 6.30 | 6.62 | 9.74 | 5.76 | 7.03 | 1.38 | 2.51 | 3.63 | 4.07 | 3.26 | 57.03 |
| 1985 | 1.00 | 2.41 | 1.91 | 1.41 | 5.72 | 4.41 | 4.41 | 2.58 | 4.75 | 1.30 | 8.09 | 0.83 | 38.82 |
| 1986 | 4.23 | 2.86 | 1.46 | 3.93 | 1.68 | 1.86 | 5.56 | 4.24 | 2.20 | 1.92 | 6.85 | 6.16 | 42.95 |
| 1987 | 5.81 | 1.01 | 4.93 | 5.90 | 1.45 | 3.94 | 4.12 | 4.89 | 5.25 | 3.89 | 3.08 | 2.17 | 46.44 |
| 1988 | 3.64 | 3.91 | 2.10 | 2.20 | 5.27 | 1.29 | 8.14 | 2.19 | 2.34 | 3.56 | 8.90 | 1.13 | 44.67 |
| 1989 | 2.29 | 3.03 | 4.93 | 4.26 | 10.24 | 8.79 | 5.13 | 8.44 | 6.90 | 7.48 | 2.79 | 0.83 | 65.11 |
| 1990 | 5.34 | 2.33 | 3.64 | 5.12 | 9.10 | 2.50 | 3.51 | 12.36 | 2.24 | 6.38 | 2.82 | 5.58 | 60.92 |
| 1991 | 3.38 | 1.93 | 5.16 | 3.68 | 3.11 | 4.16 | 4.57 | 7.13 | 3.71 | 2.13 | 1.96 | 4.26 | 45.18 |
| 1992 | 1.68 | 1.87 | 4.08 | 1.76 | 4.02 | 4.77 | 4.49 | 3.49 | 4.89 | 1.16 | 5.64 | 5.50 | 43.35 |
| 1993 | 3.44 | 2.81 | 6.64 | 4.28 | 1.56 | 1.49 | 1.70 | 5.41 | 5.25 | 4.55 | 2.20 | 4.95 | 44.28 |
| 1994 | 5.62 | 3.44 | 6.33 | 2.42 | 4.26 | 3.21 | 3.86 | 6.33 | 3.33 | 1.35 | 4.34 | 2.90 | 47.39 |
| 1995 | 3.75 | 3.13 | 1.26 | 2.29 | 2.84 | 2.09 | 6.13 | 0.18 | 3.03 | 7.82 | 5.78 | 2.12 | 40.42 |
| 1996 | 5.64 | 2.59 | 3.81 | 6.33 | 2.64 | 5.71 | 5.76 | 1.87 | 4.97 | 7.52 | 2.87 | 6.48 | 56.19 |
| 1997 | 3.65 | 2.54 | 5.18 | 2.86 | 3.05 | 1.93 | 8.36 | 3.21 | 2.10 | 2.10 | 4.68 | 4.27 | 43.93 |
| 1998 | 5.20 | 5.81 | 5.08 | 7.05 | 6.94 | 5.94 | 1.09 | 2.78 | 3.44 | 2.76 | 1.48 | 1.12 | 48.69 |
| 1999 | 7.02 | 3.49 | 4.01 | 1.93 | 4.04 | 0.19 | 0.44 | 2.89 | 8.81 | 2.73 | 2.33 | 3.23 | 41.11 |
| 2000 | 3.23 | 1.66 | 3.34 | 3.53 | 4.50 | 4.87 | 7.28 | 3.82 | 5.82 | 0.67 | 3.54 | 3.19 | 45.45 |
| 2001 | 3.16 | 1.95 | 7.48 | 1.58 | 2.03 | 5.29 | 2.04 | 2.56 | 5.30 | 0.66 | 1.36 | 2.24 | 35.65 |
| POR=132 YRS | 3.50 | 3.33 | 3.93 | 3.54 | 3.66 | 3.49 | 4.21 | 4.24 | 3.78 | 3.46 | 3.48 | 3.41 | 44.03 |
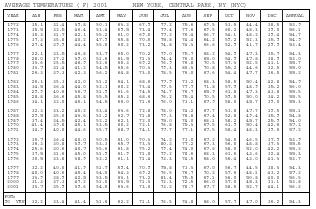
| AVERAGE TEMPERATURE (F) 2001 NEW YORK, CENTRAL PARK, NY (NYC) | |||||||||||||
| YEAR | JAN | FEB | MAR | APR | MAY | JUN | JUL | AUG | SEP | OCT | NOV | DEC | ANNUAL |
| 1972 | 35.1 | 31.4 | 39.8 | 50.1 | 63.3 | 67.9 | 77.2 | 75.6 | 69.5 | 53.5 | 44.4 | 38.5 | 53.9 |
| 1973 | 35.5 | 32.5 | 46.4 | 53.4 | 59.5 | 73.4 | 77.4 | 77.6 | 69.5 | 60.2 | 48.3 | 39.0 | 56.1 |
| 1974 | 35.3 | 31.7 | 42.1 | 55.2 | 61.0 | 69.0 | 77.2 | 76.4 | 66.7 | 54.1 | 48.2 | 39.4 | 54.7 |
| 1975 | 37.3 | 35.8 | 40.2 | 47.9 | 65.8 | 70.5 | 75.8 | 74.4 | 64.2 | 59.2 | 52.3 | 35.9 | 54.9 |
| 1976 | 27.4 | 39.9 | 44.4 | 55.0 | 60.2 | 73.2 | 74.8 | 74.3 | 66.6 | 52.9 | 41.7 | 29.9 | 53.4 |
| 1977 | 22.1 | 33.5 | 46.8 | 53.7 | 65.0 | 70.2 | 79.0 | 75.7 | 68.2 | 54.9 | 47.3 | 35.7 | 54.3 |
| 1978 | 28.0 | 27.2 | 39.0 | 51.6 | 61.5 | 71.3 | 74.4 | 76.0 | 65.0 | 54.9 | 47.8 | 38.9 | 53.0 |
| 1979 | 33.6 | 25.5 | 46.9 | 52.6 | 65.3 | 69.2 | 76.9 | 76.8 | 70.5 | 57.3 | 52.5 | 41.1 | 55.7 |
| 1980 | 33.7 | 31.4 | 41.2 | 54.5 | 65.6 | 70.3 | 79.3 | 80.3 | 70.8 | 55.2 | 44.6 | 32.5 | 55.0 |
| 1981 | 26.3 | 39.3 | 42.3 | 56.2 | 64.8 | 73.0 | 78.5 | 76.0 | 67.6 | 54.4 | 47.7 | 36.5 | 55.2 |
| 1982 | 26.1 | 35.3 | 42.0 | 51.2 | 64.1 | 68.6 | 77.9 | 73.2 | 68.3 | 58.5 | 50.4 | 42.8 | 54.9 |
| 1983 | 34.5 | 36.4 | 44.0 | 52.3 | 60.2 | 73.4 | 79.5 | 77.7 | 71.8 | 57.9 | 48.9 | 35.2 | 56.0 |
| 1984 | 29.9 | 40.6 | 36.7 | 51.9 | 61.6 | 74.5 | 74.7 | 76.7 | 65.9 | 61.8 | 47.3 | 43.8 | 55.5 |
| 1985 | 28.8 | 36.6 | 45.8 | 55.5 | 65.3 | 68.6 | 76.2 | 75.4 | 70.5 | 59.5 | 50.0 | 34.2 | 55.5 |
| 1986 | 34.1 | 32.0 | 45.1 | 54.5 | 66.0 | 71.6 | 76.0 | 73.1 | 67.9 | 58.0 | 45.7 | 39.0 | 55.3 |
| 1987 | 32.3 | 33.2 | 45.2 | 53.4 | 63.6 | 72.8 | 78.0 | 74.2 | 67.7 | 53.8 | 47.7 | 39.5 | 55.1 |
| 1988 | 29.5 | 35.0 | 43.6 | 51.2 | 62.7 | 71.8 | 79.3 | 78.8 | 67.4 | 52.8 | 49.4 | 35.9 | 54.8 |
| 1989 | 37.4 | 34.5 | 42.4 | 52.2 | 62.1 | 72.0 | 75.0 | 74.0 | 68.1 | 58.2 | 45.7 | 25.9 | 54.0 |
| 1990 | 41.4 | 39.8 | 45.1 | 53.5 | 60.2 | 72.1 | 76.8 | 75.3 | 67.5 | 61.9 | 50.4 | 42.6 | 57.2 |
| 1991 | 34.9 | 40.0 | 44.6 | 55.7 | 68.7 | 74.1 | 77.7 | 77.1 | 67.5 | 58.4 | 48.3 | 39.6 | 57.2 |
| 1992 | 35.7 | 36.4 | 40.0 | 50.5 | 61.0 | 70.3 | 74.2 | 73.0 | 67.2 | 54.5 | 46.5 | 37.9 | 53.9 |
| 1993 | 36.3 | 30.8 | 39.7 | 53.3 | 65.7 | 73.3 | 80.2 | 77.2 | 67.3 | 56.0 | 48.8 | 37.3 | 55.5 |
| 1994 | 25.6 | 30.6 | 40.7 | 55.6 | 61.8 | 75.2 | 79.4 | 74.0 | 67.6 | 58.0 | 52.0 | 42.2 | 55.2 |
| 1995 | 37.5 | 31.6 | 45.0 | 51.9 | 61.9 | 71.8 | 79.2 | 78.6 | 68.3 | 61.6 | 43.6 | 32.4 | 55.3 |
| 1996 | 30.5 | 33.8 | 38.9 | 52.2 | 61.1 | 71.4 | 73.3 | 74.5 | 68.0 | 56.4 | 43.0 | 41.3 | 53.7 |
| 1997 | 32.2 | 40.0 | 41.9 | 51.7 | 59.4 | 70.9 | 75.8 | 73.3 | 67.0 | 56.7 | 44.5 | 38.3 | 54.3 |
| 1998 | 40.0 | 40.6 | 45.4 | 54.0 | 64.3 | 69.2 | 76.5 | 76.7 | 70.2 | 57.6 | 48.1 | 43.2 | 57.2 |
| 1999 | 33.9 | 38.9 | 42.5 | 53.5 | 63.1 | 73.2 | 81.4 | 75.5 | 69.1 | 56.0 | 50.8 | 40.0 | 56.5 |
| 2000 | 31.3 | 37.3 | 47.2 | 51.0 | 63.5 | 71.3 | 72.3 | 72.5 | 66.0 | 57.0 | 45.3 | 31.1 | 53.8 |
| 2001 | 33.7 | 35.9 | 39.6 | 54.0 | 63.6 | 73.0 | 73.2 | 78.7 | 67.7 | 58.5 | 52.7 | 44.1 | 56.2 |
| POR=90 YRS | 32.2 | 33.4 | 41.4 | 51.6 | 62.2 | 71.1 | 76.5 | 74.8 | 68.0 | 57.7 | 47.0 | 36.2 | 54.3 |
REFERENCE NOTES:
PAGE 1:
THE TEMPERATURE GRAPH SHOWS NORMAL MAXIMUM AND NORMAL MINIMUM DAILY TEMPERATURES (SOLID CURVES) AND THE ACTUAL DAILY HIGH AND LOW TEMPERATURES (VERTICAL BARS).
PAGE 2 AND 3:
H/C INDICATES HEATING AND COOLING DEGREE DAYS.
RH INDICATES RELATIVE HUMIDITY
W/O INDICATES WEATHER AND OBSTRUCTIONS
S INDICATES SUNSHINE.
PR INDICATES PRESSURE.
CLOUDINESS ON PAGE 3 IS THE SUM OF THE CEILOMETER AND SATELLITE DATA NOT TO EXCEED EIGHT EIGHTHS (OKTAS).
GENERAL:
T INDICATES TRACE PRECIPITATION, AN AMOUNT GREATER THAN ZERO BUT LESS THAN THE LOWEST REPORTABLE VALUE.
+ INDICATES THE VALUE ALSO OCCURS ON EARLIER DATES.
BLANK ENTRIES DENOTE MISSING OR UNREPORTED DATA.
NORMALS ARE 30–YEAR AVERAGES (1961–1990).
ASOS INDICATES AUTOMATED SURFACE OBSERVING SYSTEM.
PM INDICATES THE LAST DAY OF THE PREVIOUS MONTH.
POR (PERIOD OF RECORD) BEGINS WITH THE JANUARY DATA MONTH AND IS THE NUMBER OF YEARS USED TO COMPUTE THE MEAN. INDIVIDUAL MONTHS WITHIN THE POR MAY BE MISSING.
WHEN THE POR FOR A NORMAL IS LESS THAN 30 YEARS, THE NORMAL IS PROVISIONAL AND IS BASED ON THE NUMBER OF YEARS INDICATED.
0.* OR * INDICATES THE VALUE OR MEAN–DAYS–WITH IS BETWEEN 0.00 AND 0.05.
CLOUDINESS FOR ASOS STATIONS DIFFERS FROM THE NON–ASOS OBSERVATION TAKEN BY A HUMAN OBSERVER. ASOS STATION CLOUDINESS IS BASED ON TIME–AVERAGED CEILOMETER DATA FOR CLOUDS AT OR BELOW 12,000 FEET AND ON SATELLITE DATA FOR CLOUDS ABOVE 12,000 FEET.
THE NUMBER OF DAYS WITH CLEAR, PARTLY CLOUDY, AND CLOUDY CONDITIONS FOR ASOS STATIONS IS THE SUM OF THE CEILOMETER AND SATELLITE DATA FOR THE SUNRISE TO SUNSET PERIOD.
GENERAL CONTINUED:
CLEAR INDICATES 0–2 OKTAS, PARTLY CLOUDY INDICATES 3–6 OKTAS, AND CLOUDY INDICATES 7 OR 8 OKTAS. WHEN AT LEAST ONE OF THE ELEMENTS (CEILOMETER OR SATELLITE) IS MISSING, THE DAILY CLOUDINESS IS NOT COMPUTED.
WIND DIRECTION IS RECORDED IN TENS OF DEGREES (2 DIGITS) CLOCKWISE FROM TRUE NORTH. "00" INDICATES CALM. "36" INDICATES TRUE NORTH.
RESULTANT WIND IS THE VECTOR AVERAGE OF THE SPEED AND DIRECTION.
AVERAGE TEMPERATURE IS THE SUM OF THE MEAN DAILY MAXIMUM AND MINIMUM TEMPERATURE DIVIDED BY 2.
SNOWFALL DATA COMPRISE ALL FORMS OF FROZEN PRECIPITATION, INCLUDING HAIL.
A HEATING (COOLING) DEGREE DAY IS THE DIFFERENCE BETWEEN THE AVERAGE DAILY TEMPERATURE AND 65 F.
DRY BULB IS THE TEMPERATURE OF THE AMBIENT AIR.
DEW POINT IS THE TEMPERATURE TO WHICH THE AIR MUST BE COOLED TO ACHIEVE 100 PERCENT RELATIVE HUMIDITY.
WET BULB IS THE TEMPERATURE THE AIR WOULD HAVE IF THE MOISTURE CONTENT WAS INCREASED TO 100 PERCENT RELATIVE HUMIDITY.
ON JULY 1, 1996, THE NATIONAL WEATHER SERVICE BEGAN USING THE "METAR" OBSERVATION CODE THAT WAS ALREADY EMPLOYED BY MOST OTHER NATIONS OF THE WORLD. THE MOST NOTICEABLE DIFFERENCE IN THIS ANNUAL PUBLICATION WILL BE THE CHANGE IN UNITS FROM TENTHS TO EIGHTS (OKTAS) FOR REPORTING THE AMOUNT OF SKY COVER.
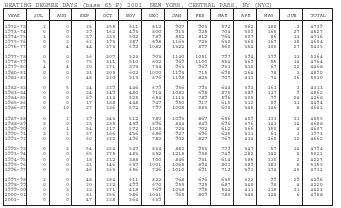
| HEATING DEGREE DAYS (base 65 F) 2001 NEW YORK, CENTRAL PARK, NY (NYC) | |||||||||||||
| YEAR | JUL | AUG | SEP | OCT | NOV | DEC | JAN | FEB | MAR | APR | MAY | JUN | TOTAL |
| 1972-73 | 2 | 0 | 25 | 355 | 611 | 812 | 907 | 903 | 572 | 362 | 188 | 2 | 4739 |
| 1973-74 | 0 | 0 | 29 | 162 | 493 | 800 | 913 | 925 | 704 | 309 | 165 | 27 | 4527 |
| 1974-75 | 1 | 0 | 59 | 333 | 502 | 789 | 852 | 812 | 764 | 507 | 86 | 11 | 4716 |
| 1975-76 | 0 | 3 | 62 | 193 | 387 | 898 | 1163 | 723 | 630 | 360 | 167 | 18 | 4604 |
| 1976-77 | 0 | 4 | 44 | 373 | 692 | 1082 | 1322 | 877 | 560 | 354 | 100 | 27 | 5435 |
| 1977-78 | 0 | 0 | 56 | 307 | 524 | 903 | 1140 | 1051 | 797 | 394 | 179 | 13 | 5364 |
| 1978-79 | 5 | 0 | 75 | 311 | 510 | 802 | 969 | 1100 | 554 | 369 | 55 | 14 | 4764 |
| 1979-80 | 4 | 4 | 20 | 271 | 373 | 734 | 963 | 969 | 731 | 310 | 67 | 22 | 4468 |
| 1980-81 | 0 | 0 | 31 | 305 | 602 | 1000 | 1194 | 715 | 698 | 264 | 78 | 3 | 4890 |
| 1981-82 | 0 | 0 | 48 | 320 | 513 | 876 | 1198 | 825 | 707 | 413 | 74 | 36 | 5010 |
| 1982-83 | 0 | 5 | 24 | 229 | 446 | 679 | 936 | 793 | 644 | 393 | 161 | 3 | 4313 |
| 1983-84 | 0 | 0 | 34 | 249 | 480 | 914 | 1082 | 698 | 870 | 389 | 137 | 9 | 4862 |
| 1984-85 | 0 | 0 | 69 | 114 | 525 | 654 | 1113 | 789 | 596 | 305 | 79 | 24 | 4268 |
| 1985-86 | 0 | 0 | 17 | 188 | 448 | 947 | 950 | 917 | 615 | 312 | 89 | 11 | 4494 |
| 1986-87 | 0 | 10 | 27 | 236 | 572 | 797 | 1008 | 883 | 608 | 348 | 146 | 8 | 4643 |
| 1987-88 | 0 | 2 | 29 | 343 | 512 | 780 | 1093 | 867 | 656 | 409 | 133 | 31 | 4855 |
| 1988-89 | 3 | 0 | 23 | 385 | 459 | 896 | 844 | 849 | 696 | 376 | 143 | 14 | 4688 |
| 1989-90 | 0 | 1 | 54 | 217 | 572 | 1205 | 724 | 702 | 612 | 366 | 150 | 4 | 4607 |
| 1990-91 | 3 | 2 | 57 | 166 | 436 | 686 | 927 | 696 | 625 | 311 | 61 | 3 | 3973 |
| 1991-92 | 0 | 0 | 60 | 222 | 496 | 782 | 902 | 827 | 767 | 434 | 160 | 12 | 4662 |
| 1992-93 | 0 | 3 | 54 | 324 | 547 | 834 | 882 | 953 | 779 | 347 | 57 | 14 | 4794 |
| 1993-94 | 0 | 0 | 65 | 275 | 483 | 852 | 1215 | 958 | 749 | 282 | 142 | 0 | 5021 |
| 1994-95 | 0 | 0 | 18 | 212 | 388 | 700 | 846 | 931 | 614 | 386 | 130 | 2 | 4227 |
| 1995-96 | 0 | 0 | 31 | 146 | 637 | 1001 | 1065 | 894 | 801 | 389 | 183 | 8 | 5155 |
| 1996-97 | 0 | 0 | 46 | 263 | 656 | 726 | 1010 | 691 | 712 | 393 | 174 | 40 | 4711 |
| 1997-98 | 2 | 0 | 48 | 284 | 611 | 822 | 768 | 676 | 635 | 322 | 99 | 29 | 4296 |
| 1998-99 | 0 | 0 | 20 | 222 | 499 | 670 | 955 | 725 | 687 | 340 | 98 | 4 | 4220 |
| 1999-00 | 0 | 3 | 23 | 271 | 418 | 769 | 1038 | 795 | 544 | 411 | 118 | 31 | 4421 |
| 2000-01 | 0 | 0 | 81 | 256 | 586 | 1041 | 965 | 809 | 780 | 340 | 124 | 6 | 4988 |
| 2001- | 0 | 0 | 47 | 228 | 364 | 639 | |||||||
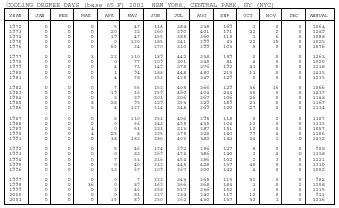
| COOLING DEGREE DAYS (base 65 F) 2001 NEW YORK, CENTRAL PARK, NY (NYC) | |||||||||||||
| YEAR | JAN | FEB | MAR | APR | MAY | JUN | JUL | AUG | SEP | OCT | NOV | DEC | ANNUAL |
| 1972 | 0 | 0 | 0 | 5 | 47 | 118 | 384 | 338 | 169 | 3 | 0 | 0 | 1064 |
| 1973 | 0 | 0 | 0 | 20 | 23 | 260 | 390 | 401 | 171 | 22 | 2 | 0 | 1289 |
| 1974 | 0 | 0 | 0 | 19 | 47 | 155 | 385 | 360 | 115 | 1 | 6 | 0 | 1088 |
| 1975 | 0 | 0 | 0 | 0 | 120 | 185 | 341 | 299 | 43 | 22 | 15 | 0 | 1025 |
| 1976 | 0 | 0 | 0 | 65 | 24 | 270 | 310 | 299 | 103 | 5 | 0 | 0 | 1076 |
| 1977 | 0 | 0 | 3 | 22 | 110 | 189 | 442 | 338 | 159 | 0 | 0 | 0 | 1263 |
| 1978 | 0 | 0 | 0 | 0 | 77 | 209 | 301 | 348 | 81 | 4 | 0 | 0 | 1020 |
| 1979 | 0 | 0 | 0 | 4 | 71 | 149 | 378 | 376 | 192 | 43 | 5 | 0 | 1218 |
| 1980 | 0 | 0 | 0 | 1 | 94 | 188 | 448 | 480 | 213 | 11 | 0 | 0 | 1435 |
| 1981 | 0 | 0 | 0 | 4 | 78 | 252 | 425 | 347 | 129 | 0 | 0 | 0 | 1235 |
| 1982 | 0 | 0 | 0 | 7 | 55 | 152 | 405 | 266 | 129 | 36 | 16 | 0 | 1066 |
| 1983 | 0 | 0 | 0 | 19 | 16 | 259 | 460 | 404 | 244 | 35 | 0 | 0 | 1437 |
| 1984 | 0 | 0 | 0 | 3 | 39 | 301 | 306 | 367 | 106 | 26 | 0 | 0 | 1148 |
| 1985 | 0 | 0 | 8 | 28 | 95 | 139 | 353 | 329 | 189 | 21 | 5 | 0 | 1167 |
| 1986 | 0 | 0 | 5 | 4 | 127 | 214 | 348 | 269 | 120 | 27 | 0 | 0 | 1114 |
| 1987 | 0 | 0 | 0 | 5 | 110 | 251 | 406 | 295 | 118 | 0 | 2 | 0 | 1187 |
| 1988 | 0 | 0 | 0 | 0 | 66 | 243 | 455 | 435 | 104 | 12 | 0 | 0 | 1315 |
| 1989 | 0 | 0 | 4 | 0 | 61 | 231 | 313 | 287 | 151 | 10 | 0 | 0 | 1057 |
| 1990 | 0 | 0 | 4 | 25 | 8 | 225 | 375 | 328 | 140 | 77 | 4 | 0 | 1186 |
| 1991 | 0 | 0 | 0 | 38 | 182 | 280 | 403 | 382 | 142 | 24 | 1 | 0 | 1452 |
| 1992 | 0 | 0 | 0 | 5 | 46 | 174 | 292 | 256 | 127 | 8 | 0 | 0 | 908 |
| 1993 | 0 | 0 | 0 | 0 | 82 | 269 | 474 | 386 | 140 | 3 | 4 | 0 | 1358 |
| 1994 | 0 | 0 | 0 | 7 | 51 | 316 | 454 | 286 | 102 | 2 | 3 | 0 | 1221 |
| 1995 | 0 | 0 | 0 | 0 | 40 | 212 | 445 | 428 | 137 | 48 | 0 | 0 | 1310 |
| 1996 | 0 | 0 | 0 | 13 | 67 | 209 | 267 | 300 | 142 | 4 | 0 | 0 | 1002 |
| 1997 | 0 | 0 | 0 | 0 | 7 | 222 | 343 | 265 | 113 | 32 | 0 | 0 | 982 |
| 1998 | 0 | 0 | 36 | 0 | 89 | 162 | 366 | 368 | 184 | 1 | 0 | 2 | 1208 |
| 1999 | 0 | 0 | 0 | 3 | 46 | 258 | 517 | 336 | 152 | 3 | 0 | 0 | 1315 |
| 2000 | 0 | 0 | 0 | 0 | 81 | 227 | 234 | 240 | 117 | 12 | 0 | 0 | 911 |
| 2001 | 0 | 0 | 0 | 15 | 89 | 250 | 262 | 430 | 137 | 32 | 1 | 0 | 1216 |
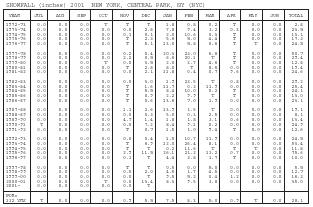
| SNOWFALL (inches) 2001 NEW YORK, CENTRAL PARK, NY (NYC) | |||||||||||||
| YEAR | JUL | AUG | SEP | OCT | NOV | DEC | JAN | FEB | MAR | APR | MAY | JUN | TOTAL |
| 1972-73 | 0.0 | 0.0 | 0.0 | T | T | T | 1.8 | 0.8 | 0.2 | T | 0.0 | 0.0 | 2.8 |
| 1973-74 | 0.0 | 0.0 | 0.0 | 0.0 | 0.0 | 2.8 | 7.8 | 9.4 | 3.2 | 0.3 | 0.0 | 0.0 | 23.5 |
| 1974-75 | 0.0 | 0.0 | 0.0 | 0.0 | 0.1 | 0.1 | 2.0 | 10.6 | 0.3 | T | 0.0 | 0.0 | 13.1 |
| 1975-76 | 0.0 | 0.0 | 0.0 | 0.0 | T | 2.3 | 5.6 | 5.0 | 4.4 | T | 0.0 | 0.0 | 17.3 |
| 1976-77 | 0.0 | 0.0 | 0.0 | 0.0 | T | 5.1 | 13.0 | 5.8 | 0.6 | T | T | 0.0 | 24.5 |
| 1977-78 | 0.0 | 0.0 | 0.0 | 0.0 | 0.2 | 0.4 | 20.3 | 23.0 | 6.8 | T | 0.0 | 0.0 | 50.7 |
| 1978-79 | 0.0 | 0.0 | 0.0 | 0.0 | 2.2 | 0.5 | 6.6 | 20.1 | T | T | 0.0 | 0.0 | 29.4 |
| 1979-80 | 0.0 | 0.0 | 0.0 | T | 0.0 | 3.5 | 2.0 | 2.7 | 4.6 | T | 0.0 | 0.0 | 12.8 |
| 1980-81 | 0.0 | 0.0 | 0.0 | 0.0 | T | 2.8 | 8.0 | T | 8.6 | 0.0 | 0.0 | 0.0 | 19.4 |
| 1981-82 | 0.0 | 0.0 | 0.0 | 0.0 | 0.0 | 2.1 | 11.8 | 0.4 | 0.7 | 9.6 | 0.0 | 0.0 | 24.6 |
| 1982-83 | 0.0 | 0.0 | 0.0 | 0.0 | 0.0 | 3.0 | 1.9 | 23.5 | T | 0.8 | 0.0 | 0.0 | 29.2 |
| 1983-84 | 0.0 | 0.0 | 0.0 | 0.0 | T | 1.6 | 11.7 | 0.2 | 11.9 | 0.0 | 0.0 | 0.0 | 25.4 |
| 1984-85 | 0.0 | 0.0 | 0.0 | 0.0 | T | 5.5 | 8.4 | 10.0 | 0.2 | T | 0.0 | 0.0 | 24.1 |
| 1985-86 | 0.0 | 0.0 | 0.0 | 0.0 | T | 0.9 | 2.2 | 9.9 | T | T | 0.0 | 0.0 | 13.0 |
| 1986-87 | 0.0 | 0.0 | 0.0 | 0.0 | T | 0.6 | 13.6 | 7.0 | 1.9 | 0.0 | 0.0 | 0.0 | 23.1 |
| 1987-88 | 0.0 | 0.0 | 0.0 | 0.0 | 1.1 | 2.6 | 13.9 | 1.5 | T | 0.0 | 0.0 | 0.0 | 19.1 |
| 1988-89 | 0.0 | 0.0 | 0.0 | 0.0 | 0.0 | 0.3 | 5.0 | 0.3 | 2.5 | 0.0 | 0.0 | 0.0 | 8.1 |
| 1989-90 | 0.0 | 0.0 | 0.0 | 0.0 | 4.7 | 1.4 | 1.8 | 1.8 | 3.1 | 0.6 | 0.0 | 0.0 | 13.4 |
| 1990-91 | T | 0.0 | 0.0 | 0.0 | 0.0 | 7.2 | 8.4 | 9.1 | 0.2 | 0.0 | 0.0 | 0.0 | 24.9 |
| 1991-92 | 0.0 | 0.0 | 0.0 | 0.0 | T | 0.7 | 1.5 | 1.0 | 9.4 | T | 0.0 | 0.0 | 12.6 |
| 1992-93 | 0.0 | 0.0 | 0.0 | 0.0 | 0.0 | 0.4 | 1.5 | 10.7 | 11.9 | 0.0 | 0.0 | 0.0 | 24.5 |
| 1993-94 | 0.0 | 0.0 | 0.0 | 0.0 | T | 6.9 | 12.0 | 26.4 | 8.1 | 0.0 | 0.0 | 0.0 | 53.4 |
| 1994-95 | 0.0 | 0.0 | 0.0 | 0.0 | T | T | 0.2 | 11.6 | T | T | T | 0.0 | 11.8 |
| 1995-96 | 0.0 | 0.0 | 0.0 | 0.0 | 2.9 | 11.5 | 26.1 | 21.2 | 13.2 | 0.7 | 0.0 | 0.0 | 75.6 |
| 1996-97 | 0.0 | 0.0 | 0.0 | 0.0 | 0.1 | T | 4.4 | 3.8 | 1.7 | T | 0.0 | 0.0 | 10.0 |
| 1997-98 | 0.0 | 0.0 | 0.0 | 0.0 | T | T | 0.5 | 0.0 | 5.0 | 0.0 | 0.0 | 0.0 | 5.5 |
| 1998-99 | 0.0 | 0.0 | 0.0 | 0.0 | 0.0 | 2.0 | 4.5 | 1.7 | 4.5 | 0.0 | 0.0 | 0.0 | 12.7 |
| 1999-00 | 0.0 | 0.0 | 0.0 | 0.0 | 0.0 | T | 9.5 | 5.2 | 0.4 | 1.2 | 0.0 | 0.0 | 16.3 |
| 2000-01 | 0.0 | 0.0 | 0.0 | T | 0.0 | 13.4 | 8.3 | 9.5 | 3.8 | 0.0 | 0.0 | 0.0 | 35.0 |
| 2001- | 0.0 | 0.0 | 0.0 | 0.0 | 0.0 | T | |||||||
| POR=132 YRS | T | 0.0 | 0.0 | 0.0 | 0.9 | 5.5 | 7.5 | 8.3 | 5.0 | 0.9 | T | 0.0 | 28.1 |