2001 ROCHESTER, NEW YORK (ROC)
Rochester and the Genesee Valley experience a fairly humid, continental type climate, which is strongly modified by the proximity of the Great Lakes. Precipitation is rather evenly distributed throughout the year in quanity, but frequency is much higher during the cloudy winter months than in the sunny ones. Snowfall is heavy, but is highly variable over short distances.
Winters in general are cloudy, cold and snowy..but are changeable and include frequent thaws and rain as well. Snow covers the ground more often than not from christmas into early March..but periods of bare ground are not uncommon. About half of the annual snowfall comes from "lake–effect" process and is very localized. This feature develops when cold air crosses the warmer lake waters and becomes saturated..creating clouds and precipitation downwind. The exact location of these snowbands are determined by the direction of the wind. Areas east of Rochester receive the most snow from this process..as northwest winds have a longer "fetch" off Lake Ontario..while areas south of the city get somewhat less. Lake Erie can even contribute some snow from this process if a west or southwest wind is storng enough. Since Lake Ontario does not freeze in most winters..this Lake effect machine can remain active throughout the winter. The Rochester area is also subject to occasional general or "synoptic" snowfalls..but the worst effects from these usually pass by to the east. Total season snowfall ranges from 70 inches south of the city to about 90 inches in Rochester to over 120 inches along the lakeshore east of the city. About 50 inches of this total results from general snows..the rest is due to the Lake effect machine. The lake does modify any extreme cold as the mercury falls below zero on only anout six nights in an average winter..with anything below –10 extremely rare.
Spring comes slowly to the region. The last frosts usually occur by April 30 near Lake Ontario..but as late as mid–May south of the Thruway. The spring months are actually the driest months statistically, due in part to the stabilizing effects of the Great Lakes, although soils are wet. Sunshine increases markedly in May.
Summers are warm and sunny across the region. The average temperature is in the 70 to 72 degree range. Rain can be expected on every third or fourth day..almost always in the form of showers and thunderstorms. This activity is more common inland than near the Lake. Completely overcast days in summer are rare. Severe weather is not common..but a few cases of damaging winds and small tornadoes occur each year. The greatest risk of this type of activity is south of the Thruway. There usually are several periods of uncomfortably warm and muggy weather in an average summer..but only about nine days reach 90–degree mark in an average year. Still, the area usually experiences some of the most delightful summer weather in the East.
Autumn is pleasant, but rather brief. Mild and dry conditions predominate through September and much of October, but colder airmasses cross the Great Lakes with increasing frequency starting in late October, and result in a drastic increase in cloud cover across the region in late October and early November. Although the first frosts may not occur until late October near Lake Ontario, the firstlake effect snows of the season follow soon after…usually by mid November. These early snows melt off quickly, with a general snow cover seldom established before mid December. The growing season is relatively long for the latitude…average about 180 days. The long growing season…combined with ample spring moisture and abundant summer sunshine…is beneficial for the many fruit orchards and wineries…especially near the Lake Ontario shore and Finger Lakes.
NORMALS, MEANS, AND EXTREMES
ROCHESTER, NY (ROC)
LATITUDE: LONGITUDE: ELEVATION (FT): TIME ZONE: WBAN: 14768
43 07′ 00″ N 77 40′ 36″ W GRND: 585 BARO: � A0;588 EASTERN (UTC + 5)
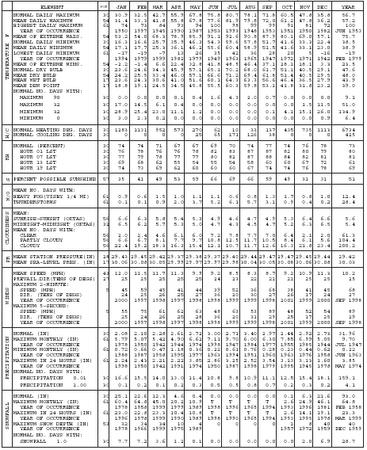
| ELEMENT | POR | JAN | FEB | MAR | APR | MAY | JUN | JUL | AUG | SEP | OCT | NOV | DEC | YEAR | |
| TEMPERATURE F | NORMAL DAILY MAXIMUM | 30 | 30.9 | 32.5 | 42.7 | 55.9 | 67.8 | 75.8 | 80.7 | 78.1 | 71.8 | 60.5 | 47.8 | 35.8 | 56.7 |
| MEAN DAILY MAXIMUM | 54 | 31.4 | 33.3 | 41.8 | 55.8 | 67.8 | 77.6 | 81.9 | 79.8 | 72.0 | 61.2 | 47.8 | 36.2 | 57.2 | |
| HIGHEST DAILY MAXIMUM | 61 | 74 | 73 | 84 | 93 | 94 | 100 | 98 | 99 | 99 | 91 | 81 | 72 | 100 | |
| YEAR OF OCCURRENCE | 1950 | 1997 | 1945 | 1990 | 1987 | 1953 | 1993 | 1948 | 1953 | 1951 | 1950 | 1982 | JUN 1953 | ||
| MEAN OF EXTREME MAXS. | 54 | 53.2 | 54.0 | 68.3 | 78.9 | 85.9 | 91.1 | 92.6 | 90.8 | 87.9 | 80.1 | 69.0 | 57.1 | 75.7 | |
| NORMAL DAILY MINIMUM | 30 | 16.3 | 16.6 | 25.7 | 35.9 | 46.3 | 54.3 | 59.6 | 57.8 | 51.7 | 41.6 | 33.3 | 22.4 | 38.5 | |
| MEAN DAILY MINIMUM | 54 | 17.1 | 17.7 | 25.3 | 36.1 | 46.2 | 55.6 | 60.4 | 58.9 | 51.5 | 41.6 | 33.1 | 23.0 | 38.9 | |
| LOWEST DAILY MINIMUM | 61 | -17 | -19 | -7 | 13 | 26 | 35 | 42 | 36 | 28 | 20 | 5 | -16 | -19 | |
| YEAR OF OCCURRENCE | 1994 | 1979 | 1999 | 1982 | 1979 | 1949 | 1963 | 1965 | 1947 | 1972 | 1971 | 1942 FEB | 1979 | ||
| MEAN OF EXTREME MINS. | 54 | -2.2 | -1.4 | 6.6 | 22.4 | 32.8 | 41.8 | 48.5 | 46.4 | 37.1 | 28.1 | 18.1 | 3.3 | 23.5 | |
| NORMAL DRY BULB | 30 | 23.6 | 24.6 | 34.3 | 45.9 | 57.1 | 65.1 | 70.2 | 68.0 | 61.7 | 51.1 | 40.5 | 29.1 | 47.6 | |
| MEAN DRY BULB | 54 | 24.2 | 25.5 | 33.4 | 46.0 | 57.1 | 66.6 | 71.2 | 69.4 | 61.8 | 51.4 | 40.5 | 29.5 | 48.0 | |
| MEAN WET BULB | 17 | 23.6 | 24.3 | 30.6 | 41.0 | 51.6 | 60.1 | 64.3 | 63.3 | 56.6 | 46.4 | 36.5 | 27.9 | 43.9 | |
| MEAN DEW POINT | 17 | 18.8 | 19.1 | 24.5 | 34.5 | 45.8 | 55.5 | 60.3 | 59.8 | 53.1 | 41.8 | 31.8 | 23.2 | 39.0 | |
| NORMAL NO. DAYS WITH: | |||||||||||||||
| MAXIMUM 90 | 30 | 0.0 | 0.0 | 0.0 | 0.1 | 0.4 | 1.6 | 4.3 | 2.0 | 0.7 | 0.0 | 0.0 | 0.0 | 9.1 | |
| MAXIMUM 32 | 30 | 17.0 | 14.5 | 6.1 | 0.4 | 0.0 | 0.0 | 0.0 | 0.0 | 0.0 | 0.0 | 1.5 | 11.5 | 51.0 | |
| MINIMUM 32 | 30 | 28.9 | 25.4 | 23.0 | 11.1 | 1.2 | 0.0 | 0.0 | 0.0 | 0.1 | 4.1 | 15.1 | 26.0 | 134.9 | |
| MINIMUM 0 | 30 | 3.0 | 2.3 | 0.2 | 0.0 | 0.0 | 0.0 | 0.0 | 0.0 | 0.0 | 0.0 | 0.0 | 0.9 | 6.4 | |
| H/C | NORMAL HEATING DEG. DAYS | 30 | 1283 | 1131 | 952 | 573 | 270 | 62 | 10 | 33 | 137 | 435 | 735 | 1113 | 6734 |
| NORMAL COOLING DEG. DAYS | 30 | 0 | 0 | 0 | 0 | 25 | 65 | 171 | 126 | 38 | 0 | 0 | 0 | 425 | |
| RH | NORMAL (PERCENT) | 30 | 74 | 74 | 71 | 67 | 67 | 69 | 70 | 74 | 77 | 74 | 76 | 78 | 73 |
| HOUR 01 LST | 30 | 76 | 78 | 76 | 76 | 78 | 82 | 83 | 87 | 87 | 82 | 80 | 79 | 80 | |
| HOUR 07 LST | 30 | 77 | 79 | 78 | 77 | 77 | 80 | 82 | 87 | 88 | 84 | 82 | 81 | 81 | |
| HOUR 13 LST | 30 | 69 | 68 | 62 | 55 | 54 | 55 | 54 | 58 | 60 | 60 | 67 | 72 | 61 | |
| HOUR 19 LST | 30 | 74 | 73 | 69 | 62 | 60 | 60 | 60 | 67 | 74 | 74 | 76 | 78 | 69 | |
| S | PERCENT POSSIBLE SUNSHINE | 57 | 35 | 41 | 49 | 53 | 59 | 66 | 69 | 66 | 59 | 49 | 31 | 31 | 51 |
| W/O | MEAN NO. DAYS WITH: | ||||||||||||||
| HEAVY FOG(VISBY 1/4 MI) | 61 | 0.9 | 0.6 | 1.5 | 1.0 | 1.1 | 1.1 | 0.6 | 0.8 | 1.3 | 1.7 | 0.8 | 1.0 | 12.4 | |
| THUNDERSTORMS | 61 | 0.1 | 0.1 | 0.9 | 2.0 | 3.7 | 5.2 | 6.1 | 5.7 | 3.1 | 0.9 | 0.4 | 0.2 | 28.4 | |
| CLOUDINESS | MEAN: | ||||||||||||||
| SUNRISE-SUNSET (OKTAS) | 56 | 6.6 | 6.3 | 5.8 | 5.4 | 5.3 | 4.9 | 4.6 | 4.7 | 4.9 | 5.3 | 6.4 | 6.6 | 5.6 | |
| MIDNIGHT-MIDNIGHT (OKTAS) | 32 | 6.5 | 6.2 | 5.7 | 5.3 | 5.0 | 4.7 | 4.3 | 4.5 | 4.7 | 5.2 | 6.3 | 6.5 | 5.4 | |
| MEAN NO. DAYS WITH: | |||||||||||||||
| CLEAR | 56 | 2.0 | 2.4 | 4.6 | 6.1 | 6.0 | 7.2 | 7.8 | 7.7 | 7.0 | 6.4 | 2.1 | 2.0 | 61.3 | |
| PARTLY CLOUDY | 56 | 6.6 | 6.7 | 8.1 | 7.7 | 9.7 | 10.8 | 12.5 | 11.7 | 10.5 | 8.4 | 6.1 | 5.6 | 104.4 | |
| CLOUDY | 56 | 22.4 | 19.2 | 18.3 | 16.3 | 15.4 | 12.1 | 10.7 | 11.7 | 12.6 | 16.3 | 21.8 | 23.4 | 200.2 | |
| PR | MEAN STATION PRESSURE(IN) | 28 | 29.43 | 29.45 | 29.42 | 29.37 | 29.38 | 29.37 | 29.40 | 29.44 | 29.47 | 29.47 | 29.45 | 29.44 | 29.42 |
| MEAN SEA-LEVEL PRES. (IN) | 17 | 30.06 | 30.08 | 30.05 | 29.99 | 29.97 | 29.97 | 29.98 | 30.04 | 30.05 | 30.08 | 30.06 | 30.08 | 30.03 | |
| WINDS | MEAN SPEED (MPH) | 43 | 12.0 | 11.5 | 11.7 | 11.3 | 9.9 | 9.2 | 8.5 | 8.3 | 8.7 | 9.2 | 10.9 | 11.3 | 10.2 |
| PREVAIL. DIR (TENS OF DEGS) | 27 | 25 | 25 | 25 | 25 | 25 | 24 | 23 | 22 | 21 | 21 | 25 | 25 | 25 | |
| MAXIMUM 2-MINUTE: | |||||||||||||||
| SPEED (MPH) | 5 | 45 | 59 | 45 | 41 | 44 | 39 | 52 | 36 | 68 | 38 | 41 | 45 | 68 | |
| DIR. (TENS OF DEGS) | 24 | 25 | 26 | 25 | 27 | 36 | 20 | 30 | 27 | 26 | 17 | 24 | 27 | ||
| YEAR OF OCCURRENCE | 2000 | 1997 | 1998 | 1997 | 1998 | 1998 | 1999 | 1999 | 1998 | 2001 | 1999 | 2000 | SEP 1998 | ||
| MAXIMUM 5-SECOND: | |||||||||||||||
| SPEED (MPH) | 5 | 55 | 75 | 61 | 62 | 63 | 48 | 63 | 53 | 89 | 48 | 52 | 54 | 89 | |
| DIR. (TENS OF DEGS) | 25 | 24 | 26 | 25 | 28 | 36 | 20 | 31 | 29 | 25 | 17 | 25 | 29 | ||
| YEAR OF OCCURRENCE | 2000 | 1997 | 1998 | 1997 | 1998 | 1998 | 1999 | 1999 | 1998 | 2001 | 1999 | 2000 | SEP 1998 | ||
| PRECIPITATION | NORMAL (IN) | 30 | 2.08 | 2.10 | 2.28 | 2.61 | 2.72 | 3.00 | 2.71 | 3.40 | 2.97 | 2.44 | 2.92 | 2.73 | 31.96 |
| MAXIMUM MONTHLY (IN) | 61 | 5.79 | 5.07 | 5.42 | 4.90 | 6.62 | 7.11 | 9.70 | 6.00 | 6.30 | 7.85 | 6.99 | 5.05 | 9.70 | |
| YEAR OF OCCURRENCE | 1978 | 1950 | 1942 | 1944 | 1974 | 1998 | 1947 | 1984 | 1977 | 1955 | 1985 | 1944 | JUL 1947 | ||
| MINIMUM MONTHLY (IN) | 61 | 0.72 | 0.66 | 0.47 | 1.18 | 0.36 | 0.22 | 0.61 | 0.76 | 0.28 | 0.23 | 0.44 | 0.62 | 0.22 | |
| YEAR OF OCCURRENCE | 1988 | 1987 | 1958 | 1995 | 1977 | 1963 | 1994 | 1951 | 1960 | 1963 | 1976 | 1958 | JUN 1963 | ||
| MAXIMUM IN 24 HOURS (IN) | 61 | 2.24 | 2.43 | 2.21 | 2.22 | 3.85 | 2.86 | 3.25 | 2.52 | 3.54 | 3.13 | 3.13 | 1.60 | 3.85 | |
| YEAR OF OCCURRENCE | 1998 | 1950 | 1942 | 1991 | 1974 | 1950 | 1987 | 1998 | 1979 | 1995 | 1945 | 1978 | MAY 1974 | ||
| NORMAL NO. DAYS WITH: | |||||||||||||||
| PRECIPITATION 0.01 | 30 | 16.6 | 15.5 | 14.0 | 13.0 | 11.4 | 10.8 | 9.8 | 10.9 | 11.1 | 12.5 | 15.4 | 18.1 | 159.1 | |
| PRECIPITATION 1.00 | 30 | 0.1 | 0.2 | 0.1 | 0.2 | 0.3 | 0.5 | 0.5 | 0.8 | 0.7 | 0.2 | 0.3 | 0.2 | 4.1 | |
| SNOWFALL | NORMAL (IN) | 30 | 25.1 | 22.6 | 12.3 | 4.6 | 0.4 | 0.0 | 0.0 | 0.0 | 0.0 | 0.1 | 6.3 | 21.6 | 93.0 |
| MAXIMUM MONTHLY (IN) | 61 | 60.4 | 64.8 | 45.0 | 20.2 | 10.9 | T | T | T | T | 2.6 | 24.9 | 46.1 | 64.8 | |
| YEAR OF OCCURRENCE | 1978 | 1958 | 1999 | 1979 | 1989 | 1998 | 1996 | 1965 | 1994 | 1993 | 1996 | 1981 | FEB 1958 | ||
| MAXIMUM IN 24 HOURS (IN) | 61 | 23.0 | 22.8 | 23.3 | 10.4 | 10.8 | T | T | T | T | 2.6 | 14.1 | 19.1 | 23.3 | |
| YEAR OF OCCURRENCE | 1996 | 1978 | 1999 | 1990 | 1989 | 1998 | 1990 | 1965 | 1994 | 1993 | 1995 | 1978 | MAR 1999 | ||
| MAXIMUM SNOW DEPTH (IN) | 53 | 32 | 34 | 34 | 10 | 4 | 0 | 0 | 0 | 0 | 1 | 8 | 40 | 40 | |
| YEAR OF OCCURRENCE | 1978 | 1966 | 1999 | 1975 | 1989 | 1957 | 1972 | 1959 | DEC 1959 | ||||||
| NORMAL NO. DAYS WITH: | |||||||||||||||
| SNOWFALL 1.0 | 30 | 7.7 | 7.2 | 3.6 | 1.2 | 0.1 | 0.0 | 0.0 | 0.0 | 0.0 | 0.0 | 2.0 | 6.9 | 28.7 |
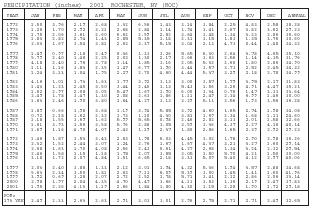
| PRECIPITATION (inches) 2001 ROCHESTER, NY (ROC) | |||||||||||||
| YEAR | JAN | FEB | MAR | APR | MAY | JUN | JUL | AUG | SEP | OCT | NOV | DEC | ANNUAL |
| 1972 | 1.50 | 3.96 | 2.19 | 2.68 | 3.32 | 6.56 | 1.43 | 3.14 | 3.84 | 2.25 | 4.83 | 2.58 | 38.28 |
| 1973 | 1.28 | 1.70 | 2.92 | 3.21 | 2.68 | 2.84 | 1.14 | 1.94 | 1.41 | 2.67 | 3.82 | 3.62 | 29.23 |
| 1974 | 1.75 | 2.06 | 3.61 | 2.60 | 6.62 | 2.59 | 2.82 | 3.64 | 3.48 | 1.34 | 3.23 | 2.86 | 36.60 |
| 1975 | 1.83 | 2.82 | 2.74 | 1.43 | 2.85 | 5.35 | 1.18 | 2.31 | 3.15 | 1.83 | 1.35 | 3.76 | 30.60 |
| 1976 | 2.33 | 1.67 | 3.54 | 3.81 | 2.63 | 3.37 | 5.15 | 3.04 | 2.13 | 4.73 | 0.44 | 1.48 | 34.32 |
| 1977 | 1.49 | 0.97 | 2.18 | 2.49 | 0.36 | 1.33 | 3.26 | 5.65 | 6.30 | 2.64 | 3.78 | 4.65 | 35.10 |
| 1978 | 5.79 | 2.40 | 1.48 | 2.25 | 2.03 | 1.30 | 2.17 | 2.66 | 3.63 | 2.56 | 1.14 | 4.35 | 31.76 |
| 1979 | 4.18 | 2.40 | 1.76 | 3.78 | 3.14 | 1.85 | 3.16 | 2.05 | 5.32 | 2.60 | 1.80 | 2.86 | 34.90 |
| 1980 | 1.11 | 1.16 | 3.83 | 2.35 | 1.49 | 6.77 | 1.90 | 3.44 | 3.57 | 3.73 | 2.52 | 2.45 | 34.32 |
| 1981 | 1.24 | 3.13 | 1.04 | 1.95 | 2.27 | 2.70 | 4.60 | 4.44 | 5.37 | 3.29 | 2.18 | 2.78 | 34.99 |
| 1982 | 4.16 | 1.01 | 1.73 | 1.63 | 1.77 | 3.92 | 3.13 | 3.00 | 3.57 | 1.79 | 3.95 | 2.17 | 31.83 |
| 1983 | 1.43 | 1.23 | 2.45 | 3.50 | 3.44 | 2.40 | 1.13 | 5.43 | 1.56 | 3.26 | 4.91 | 4.47 | 35.21 |
| 1984 | 1.62 | 2.97 | 2.08 | 3.05 | 5.47 | 1.67 | 1.90 | 6.00 | 3.34 | 0.76 | 1.47 | 3.31 | 33.64 |
| 1985 | 2.49 | 1.78 | 3.47 | 1.30 | 2.08 | 2.63 | 1.86 | 1.11 | 2.49 | 2.34 | 6.99 | 1.46 | 30.00 |
| 1986 | 1.63 | 2.46 | 1.90 | 3.80 | 1.64 | 4.27 | 3.13 | 3.29 | 5.11 | 3.56 | 1.93 | 3.56 | 36.28 |
| 1987 | 1.89 | 0.66 | 1.98 | 3.68 | 1.19 | 3.94 | 5.85 | 3.92 | 4.60 | 1.65 | 2.74 | 1.98 | 34.08 |
| 1988 | 0.72 | 2.18 | 1.62 | 2.32 | 1.73 | 1.10 | 4.30 | 3.81 | 1.69 | 2.34 | 1.68 | 1.11 | 24.60 |
| 1989 | 1.18 | 1.55 | 3.69 | 1.62 | 5.99 | 5.65 | 0.98 | 2.46 | 2.82 | 3.13 | 2.01 | 1.58 | 32.66 |
| 1990 | 1.61 | 3.93 | 1.56 | 3.58 | 5.76 | 2.88 | 3.05 | 3.59 | 3.36 | 4.37 | 2.27 | 4.18 | 40.14 |
| 1991 | 1.69 | 1.16 | 4.70 | 4.07 | 2.43 | 1.19 | 2.37 | 1.80 | 2.86 | 1.65 | 2.39 | 2.92 | 29.23 |
| 1992 | 1.46 | 1.87 | 3.53 | 3.43 | 2.83 | 1.98 | 6.03 | 4.45 | 3.02 | 1.78 | 2.90 | 2.98 | 36.26 |
| 1993 | 2.32 | 1.52 | 2.44 | 3.07 | 1.24 | 2.76 | 1.67 | 1.67 | 4.37 | 3.21 | 3.27 | 1.60 | 29.14 |
| 1994 | 2.68 | 1.63 | 1.70 | 4.08 | 2.56 | 2.43 | 0.61 | 4.27 | 2.68 | 1.34 | 3.24 | 2.32 | 29.54 |
| 1995 | 2.46 | 1.58 | 1.15 | 1.18 | 1.75 | 2.07 | 3.85 | 3.05 | 1.50 | 5.70 | 4.21 | 1.50 | 30.00 |
| 1996 | 3.18 | 1.72 | 2.07 | 4.84 | 3.51 | 6.65 | 2.18 | 3.33 | 5.09 | 5.40 | 4.12 | 2.97 | 45.06 |
| 1997 | 2.03 | 2.40 | 3.88 | 1.33 | 2.12 | 3.01 | 1.94 | 4.22 | 5.36 | 1.94 | 3.57 | 2.88 | 34.68 |
| 1998 | 5.63 | 2.34 | 3.50 | 1.81 | 2.63 | 7.11 | 6.09 | 5.39 | 3.00 | 1.45 | 1.41 | 1.60 | 41.96 |
| 1999 | 3.92 | 0.69 | 3.28 | 2.07 | 2.72 | 2.52 | 1.78 | 5.71 | 3.41 | 2.12 | 2.86 | 2.06 | 33.14 |
| 2000 | 2.98 | 1.97 | 2.04 | 4.35 | 4.70 | 4.47 | 3.66 | 4.11 | 3.53 | 1.36 | 2.19 | 2.47 | 37.83 |
| 2001 | 1.95 | 2.26 | 4.13 | 1.19 | 2.66 | 1.84 | 1.80 | 4.30 | 3.15 | 2.28 | 1.90 | 1.72 | 29.18 |
| POR=173 YRS | 2.49 | 2.33 | 2.63 | 2.63 | 2.91 | 3.03 | 3.01 | 2.96 | 2.75 | 2.71 | 2.71 | 2.49 | 32.65 |
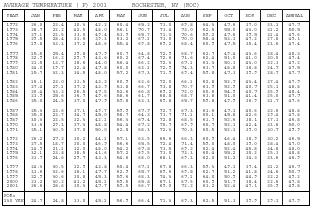
| AVERAGE TEMPERATURE (F) 2001 ROCHESTER, NY (ROC) | |||||||||||||
| YEAR | JAN | FEB | MAR | APR | MAY | JUN | JUL | AUG | SEP | OCT | NOV | DEC | ANNUAL |
| 1972 | 26.0 | 23.4 | 30.3 | 42.2 | 60.4 | 65.2 | 73.0 | 69.8 | 64.3 | 47.6 | 37.0 | 33.1 | 47.7 |
| 1973 | 28.7 | 22.2 | 42.5 | 48.0 | 56.1 | 70.7 | 73.4 | 73.0 | 62.5 | 55.0 | 43.0 | 31.2 | 50.5 |
| 1974 | 27.1 | 22.5 | 33.0 | 49.4 | 53.9 | 65.7 | 71.3 | 70.6 | 59.2 | 47.6 | 39.5 | 31.4 | 47.6 |
| 1975 | 29.5 | 28.4 | 31.6 | 39.3 | 63.2 | 67.1 | 73.0 | 70.0 | 58.4 | 53.1 | 47.2 | 27.8 | 49.1 |
| 1976 | 19.8 | 33.3 | 37.2 | 48.6 | 55.4 | 69.8 | 69.2 | 68.4 | 60.9 | 47.5 | 35.4 | 23.6 | 47.4 |
| 1977 | 15.5 | 25.4 | 39.8 | 47.9 | 60.7 | 64.8 | 72.9 | 68.7 | 62.7 | 49.4 | 43.6 | 28.4 | 48.3 |
| 1978 | 22.9 | 16.2 | 29.7 | 43.6 | 60.2 | 67.4 | 72.6 | 71.6 | 62.4 | 51.0 | 41.0 | 30.0 | 47.4 |
| 1979 | 21.5 | 13.7 | 38.6 | 44.0 | 56.4 | 66.2 | 72.3 | 67.1 | 61.3 | 50.3 | 43.0 | 32.3 | 47.2 |
| 1980 | 24.0 | 19.7 | 32.4 | 47.8 | 60.0 | 63.1 | 72.9 | 74.3 | 63.7 | 48.8 | 38.8 | 24.7 | 47.5 |
| 1981 | 15.7 | 32.3 | 34.5 | 48.0 | 57.2 | 67.3 | 71.9 | 69.4 | 59.8 | 47.3 | 39.9 | 28.7 | 47.7 |
| 1982 | 16.1 | 23.0 | 33.5 | 43.2 | 60.9 | 63.6 | 72.0 | 66.1 | 62.8 | 52.7 | 43.4 | 37.4 | 47.9 |
| 1983 | 27.4 | 29.1 | 37.2 | 43.9 | 53.8 | 66.7 | 73.8 | 70.7 | 63.9 | 52.9 | 40.7 | 25.1 | 48.8 |
| 1984 | 20.4 | 33.2 | 26.5 | 47.5 | 52.6 | 66.8 | 69.2 | 72.0 | 60.6 | 54.9 | 40.7 | 35.9 | 48.4 |
| 1985 | 21.9 | 25.6 | 36.7 | 49.6 | 58.6 | 61.7 | 68.8 | 68.7 | 63.8 | 51.0 | 41.4 | 25.0 | 47.7 |
| 1986 | 25.0 | 24.5 | 37.0 | 47.9 | 59.8 | 63.3 | 69.8 | 65.7 | 59.8 | 49.9 | 36.9 | 31.7 | 47.6 |
| 1987 | 25.3 | 23.6 | 37.1 | 49.7 | 59.9 | 67.9 | 72.7 | 67.3 | 61.6 | 47.1 | 40.6 | 32.6 | 48.8 |
| 1988 | 25.0 | 23.7 | 34.7 | 45.0 | 58.7 | 64.2 | 73.7 | 71.1 | 60.1 | 45.8 | 42.6 | 29.4 | 47.8 |
| 1989 | 30.3 | 22.5 | 32.3 | 42.1 | 56.3 | 67.4 | 72.8 | 68.5 | 61.7 | 52.6 | 38.1 | 17.1 | 46.8 |
| 1990 | 33.6 | 29.3 | 37.3 | 48.8 | 54.4 | 67.2 | 70.7 | 69.9 | 60.7 | 52.1 | 42.4 | 33.8 | 50.0 |
| 1991 | 25.1 | 30.5 | 37.0 | 50.0 | 62.8 | 68.3 | 72.3 | 70.3 | 60.5 | 52.1 | 39.0 | 30.7 | 49.9 |
| 1992 | 26.2 | 27.2 | 30.2 | 44.1 | 57.1 | 63.5 | 66.6 | 66.3 | 60.9 | 46.4 | 38.9 | 30.2 | 46.5 |
| 1993 | 27.5 | 18.7 | 30.0 | 46.9 | 56.6 | 65.5 | 72.4 | 71.4 | 59.0 | 48.0 | 39.0 | 28.4 | 47.0 |
| 1994 | 14.9 | 21.1 | 32.0 | 48.0 | 54.2 | 67.8 | 73.5 | 69.2 | 62.4 | 52.4 | 45.8 | 34.8 | 48.0 |
| 1995 | 32.1 | 23.8 | 38.5 | 41.6 | 57.2 | 69.5 | 73.0 | 73.3 | 60.4 | 55.2 | 35.2 | 25.3 | 48.8 |
| 1996 | 23.7 | 24.6 | 29.7 | 43.3 | 54.6 | 68.0 | 68.1 | 69.3 | 62.0 | 51.2 | 34.3 | 33.6 | 46.9 |
| 1997 | 24.3 | 30.5 | 32.9 | 43.8 | 50.4 | 67.1 | 67.8 | 66.3 | 59.3 | 49.1 | 37.4 | 31.2 | 46.7 |
| 1998 | 31.6 | 32.6 | 38.1 | 47.7 | 62.9 | 65.7 | 69.6 | 69.8 | 62.7 | 51.2 | 41.8 | 34.6 | 50.7 |
| 1999 | 22.9 | 30.6 | 30.8 | 45.3 | 59.6 | 68.3 | 74.3 | 67.1 | 64.0 | 50.9 | 44.9 | 32.2 | 49.2 |
| 2000 | 23.2 | 30.2 | 41.2 | 45.1 | 59.5 | 65.8 | 67.1 | 67.5 | 60.9 | 51.7 | 38.4 | 22.6 | 47.8 |
| 2001 | 26.6 | 28.6 | 30.3 | 47.7 | 59.5 | 66.7 | 69.0 | 72.2 | 61.2 | 52.4 | 47.1 | 35.9 | 49.8 |
| POR=130 YRS | 24.7 | 24.8 | 33.0 | 45.1 | 56.9 | 66.4 | 71.3 | 69.3 | 62.5 | 51.3 | 39.9 | 29.1 | 47.9 |
REFERENCE NOTES:
PAGE 1:
THE TEMPERATURE GRAPH SHOWS NORMAL MAXIMUM AND NORMAL MINIMUM DAILY TEMPERATURES (SOLID CURVES) AND THE ACTUAL DAILY HIGH AND LOW TEMPERATURES (VERTICAL BARS).
PAGE 2 AND 3:
H/C INDICATES HEATING AND COOLING DEGREE DAYS.
RH INDICATES RELATIVE HUMIDITY
W/O INDICATES WEATHER AND OBSTRUCTIONS
S INDICATES SUNSHINE.
PR INDICATES PRESSURE.
CLOUDINESS ON PAGE 3 IS THE SUM OF THE CEILOMETER AND SATELLITE DATA NOT TO EXCEED EIGHT EIGHTHS (OKTAS).
GENERAL:
T INDICATES TRACE PRECIPITATION, AN AMOUNT GREATER THAN ZERO BUT LESS THAN THE LOWEST REPORTABLE VALUE.
+ INDICATES THE VALUE ALSO OCCURS ON EARLIER DATES.
BLANK ENTRIES DENOTE MISSING OR UNREPORTED DATA.
NORMALS ARE 30–YEAR AVERAGES (1961–1990).
ASOS INDICATES AUTOMATED SURFACE OBSERVING SYSTEM.
PM INDICATES THE LAST DAY OF THE PREVIOUS MONTH.
POR (PERIOD OF RECORD) BEGINS WITH THE JANUARY DATA MONTH AND IS THE NUMBER OF YEARS USED TO COMPUTE THE MEAN. INDIVIDUAL MONTHS WITHIN THE POR MAY BE MISSING.
WHEN THE POR FOR A NORMAL IS LESS THAN 30 YEARS, THE NORMAL IS PROVISIONAL AND IS BASED ON THE NUMBER OF YEARS INDICATED.
0.* OR * INDICATES THE VALUE OR MEAN–DAYS–WITH IS BETWEEN 0.00 AND 0.05.
CLOUDINESS FOR ASOS STATIONS DIFFERS FROM THE NON–ASOS OBSERVATION TAKEN BY A HUMAN OBSERVER. ASOS STATION CLOUDINESS IS BASED ON TIME–AVERAGED CEILOMETER DATA FOR CLOUDS AT OR BELOW 12,000 FEET AND ON SATELLITE DATA FOR CLOUDS ABOVE 12,000 FEET.
THE NUMBER OF DAYS WITH CLEAR, PARTLY CLOUDY, AND CLOUDY CONDITIONS FOR ASOS STATIONS IS THE SUM OF THE CEILOMETER AND SATELLITE DATA FOR THE SUNRISE TO SUNSET PERIOD.
GENERAL CONTINUED:
CLEAR INDICATES 0–2 OKTAS, PARTLY CLOUDY INDICATES 3–6 OKTAS, AND CLOUDY INDICATES 7 OR 8 OKTAS. WHEN AT LEAST ONE OF THE ELEMENTS (CEILOMETER OR SATELLITE) IS MISSING, THE DAILY CLOUDINESS IS NOT COMPUTED.
WIND DIRECTION IS RECORDED IN TENS OF DEGREES (2 DIGITS) CLOCKWISE FROM TRUE NORTH. "00" INDICATES CALM. "36" INDICATES TRUE NORTH.
RESULTANT WIND IS THE VECTOR AVERAGE OF THE SPEED AND DIRECTION.
AVERAGE TEMPERATURE IS THE SUM OF THE MEAN DAILY MAXIMUM AND MINIMUM TEMPERATURE DIVIDED BY 2.
SNOWFALL DATA COMPRISE ALL FORMS OF FROZEN PRECIPITATION, INCLUDING HAIL.
A HEATING (COOLING) DEGREE DAY IS THE DIFFERENCE BETWEEN THE AVERAGE DAILY TEMPERATURE AND 65 F.
DRY BULB IS THE TEMPERATURE OF THE AMBIENT AIR.
DEW POINT IS THE TEMPERATURE TO WHICH THE AIR MUST BE COOLED TO ACHIEVE 100 PERCENT RELATIVE HUMIDITY.
WET BULB IS THE TEMPERATURE THE AIR WOULD HAVE IF THE MOISTURE CONTENT WAS INCREASED TO 100 PERCENT RELATIVE HUMIDITY.
ON JULY 1, 1996, THE NATIONAL WEATHER SERVICE BEGAN USING THE "METAR" OBSERVATION CODE THAT WAS ALREADY EMPLOYED BY MOST OTHER NATIONS OF THE WORLD. THE MOST NOTICEABLE DIFFERENCE IN THIS ANNUAL PUBLICATION WILL BE THE CHANGE IN UNITS FROM TENTHS TO EIGHTS (OKTAS) FOR REPORTING THE AMOUNT OF SKY COVER.
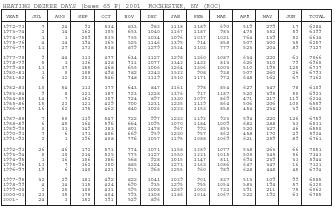
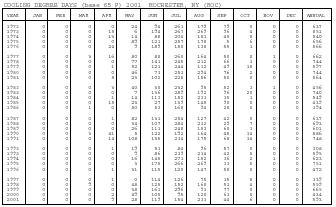
| HEATING DEGREE DAYS (base 65 F) 2001 ROCHESTER, NY (ROC) | |||||||||||||
| YEAR | JUL | AUG | SEP | OCT | NOV | DEC | JAN | FEB | MAR | APR | MAY | JUN | TOTAL |
| 1972-73 | 7 | 24 | 92 | 534 | 833 | 982 | 1118 | 1189 | 690 | 519 | 279 | 17 | 6284 |
| 1973-74 | 2 | 14 | 162 | 305 | 653 | 1040 | 1167 | 1187 | 983 | 475 | 352 | 59 | 6399 |
| 1974-75 | 1 | 1 | 209 | 535 | 755 | 1034 | 1096 | 1017 | 1031 | 764 | 139 | 52 | 6634 |
| 1975-76 | 4 | 14 | 194 | 365 | 525 | 1146 | 1395 | 914 | 858 | 507 | 300 | 35 | 6257 |
| 1976-77 | 11 | 27 | 173 | 538 | 879 | 1279 | 1524 | 1103 | 777 | 523 | 204 | 89 | 7127 |
| 1977-78 | 9 | 44 | 113 | 477 | 634 | 1127 | 1298 | 1360 | 1087 | 634 | 220 | 63 | 7066 |
| 1978-79 | 5 | 1 | 136 | 428 | 711 | 1077 | 1342 | 1432 | 813 | 626 | 310 | 79 | 6960 |
| 1979-80 | 13 | 37 | 155 | 468 | 655 | 1006 | 1264 | 1306 | 1003 | 510 | 195 | 125 | 6737 |
| 1980-81 | 1 | 0 | 108 | 498 | 782 | 1243 | 1522 | 908 | 938 | 507 | 260 | 26 | 6793 |
| 1981-82 | 6 | 12 | 201 | 546 | 748 | 1119 | 1510 | 1171 | 972 | 648 | 162 | 67 | 7162 |
| 1982-83 | 10 | 54 | 113 | 377 | 643 | 847 | 1161 | 998 | 854 | 627 | 347 | 78 | 6109 |
| 1983-84 | 9 | 8 | 121 | 387 | 723 | 1228 | 1376 | 917 | 1187 | 520 | 395 | 50 | 6921 |
| 1984-85 | 14 | 7 | 162 | 307 | 724 | 897 | 1330 | 1097 | 869 | 471 | 217 | 119 | 6214 |
| 1985-86 | 15 | 23 | 121 | 429 | 700 | 1231 | 1235 | 1129 | 864 | 506 | 206 | 100 | 6559 |
| 1986-87 | 16 | 62 | 175 | 462 | 840 | 1026 | 1223 | 1153 | 858 | 454 | 234 | 39 | 6542 |
| 1987-88 | 7 | 50 | 139 | 547 | 722 | 997 | 1232 | 1192 | 933 | 594 | 220 | 126 | 6759 |
| 1988-89 | 6 | 40 | 164 | 596 | 664 | 1095 | 1070 | 1184 | 1009 | 682 | 288 | 33 | 6831 |
| 1989-90 | 0 | 33 | 149 | 383 | 801 | 1478 | 967 | 993 | 853 | 520 | 327 | 46 | 6550 |
| 1990-91 | 7 | 6 | 171 | 406 | 669 | 959 | 1230 | 957 | 862 | 458 | 170 | 29 | 5924 |
| 1991-92 | 2 | 1 | 196 | 408 | 776 | 1057 | 1195 | 1088 | 1069 | 621 | 259 | 89 | 6761 |
| 1992-93 | 26 | 46 | 172 | 571 | 774 | 1071 | 1158 | 1289 | 1077 | 538 | 263 | 66 | 7051 |
| 1993-94 | 0 | 10 | 214 | 525 | 775 | 1127 | 1550 | 1221 | 1015 | 505 | 345 | 56 | 7343 |
| 1994-95 | 1 | 16 | 106 | 386 | 568 | 928 | 1015 | 1147 | 811 | 694 | 239 | 33 | 5944 |
| 1995-96 | 13 | 7 | 162 | 300 | 885 | 1224 | 1271 | 1163 | 1086 | 647 | 347 | 16 | 7121 |
| 1996-97 | 19 | 6 | 140 | 421 | 915 | 968 | 1255 | 960 | 989 | 628 | 448 | 45 | 6794 |
| 1997-98 | 32 | 29 | 181 | 492 | 822 | 1041 | 1029 | 901 | 837 | 513 | 109 | 99 | 6085 |
| 1998-99 | 4 | 14 | 115 | 424 | 690 | 935 | 1295 | 955 | 1054 | 583 | 194 | 57 | 6320 |
| 1999-00 | 2 | 25 | 100 | 431 | 595 | 1008 | 1289 | 1003 | 732 | 591 | 211 | 75 | 6062 |
| 2000-01 | 23 | 35 | 178 | 404 | 793 | 1308 | 1186 | 1014 | 1067 | 522 | 192 | 63 | 6785 |
| 2001- | 24 | 3 | 152 | 391 | 529 | 896 | |||||||
| COOLING DEGREE DAYS (base 65 F) 2001 ROCHESTER, NY (ROC) | |||||||||||||
| YEAR | JAN | FEB | MAR | APR | MAY | JUN | JUL | AUG | SEP | OCT | NOV | DEC | ANNUAL |
| 1972 | 0 | 0 | 0 | 0 | 24 | 94 | 261 | 179 | 79 | 0 | 0 | 0 | 637 |
| 1973 | 0 | 0 | 0 | 15 | 6 | 194 | 267 | 269 | 96 | 4 | 0 | 0 | 851 |
| 1974 | 0 | 0 | 0 | 13 | 14 | 88 | 204 | 181 | 40 | 0 | 0 | 0 | 540 |
| 1975 | 0 | 0 | 0 | 0 | 89 | 121 | 257 | 178 | 5 | 6 | 0 | 0 | 656 |
| 1976 | 0 | 0 | 0 | 24 | 9 | 189 | 150 | 138 | 55 | 1 | 0 | 0 | 566 |
| 1977 | 0 | 0 | 3 | 16 | 80 | 88 | 260 | 164 | 50 | 0 | 1 | 0 | 662 |
| 1978 | 0 | 0 | 0 | 0 | 77 | 141 | 245 | 212 | 66 | 3 | 0 | 0 | 744 |
| 1979 | 0 | 0 | 0 | 1 | 52 | 121 | 244 | 112 | 49 | 18 | 0 | 0 | 597 |
| 1980 | 0 | 0 | 0 | 0 | 46 | 73 | 253 | 294 | 76 | 2 | 0 | 0 | 744 |
| 1981 | 0 | 0 | 0 | 5 | 23 | 102 | 228 | 156 | 50 | 0 | 0 | 0 | 564 |
| 1982 | 0 | 0 | 0 | 3 | 40 | 30 | 232 | 95 | 52 | 3 | 1 | 0 | 456 |
| 1983 | 0 | 0 | 0 | 0 | 7 | 136 | 289 | 192 | 96 | 20 | 0 | 0 | 740 |
| 1984 | 0 | 0 | 0 | 1 | 14 | 113 | 152 | 233 | 35 | 1 | 0 | 0 | 549 |
| 1985 | 0 | 0 | 0 | 15 | 23 | 27 | 139 | 145 | 90 | 0 | 0 | 0 | 439 |
| 1986 | 0 | 0 | 1 | 0 | 50 | 53 | 168 | 94 | 28 | 0 | 0 | 0 | 394 |
| 1987 | 0 | 0 | 0 | 1 | 82 | 131 | 254 | 127 | 42 | 0 | 0 | 0 | 637 |
| 1988 | 0 | 0 | 0 | 0 | 34 | 107 | 284 | 232 | 29 | 7 | 0 | 0 | 693 |
| 1989 | 0 | 0 | 0 | 0 | 26 | 111 | 248 | 153 | 60 | 3 | 0 | 0 | 601 |
| 1990 | 0 | 0 | 3 | 41 | 5 | 122 | 192 | 164 | 45 | 14 | 0 | 0 | 586 |
| 1991 | 0 | 0 | 0 | 14 | 108 | 135 | 234 | 175 | 68 | 14 | 0 | 0 | 748 |
| 1992 | 0 | 0 | 0 | 1 | 19 | 51 | 84 | 96 | 57 | 0 | 0 | 0 | 308 |
| 1993 | 0 | 0 | 0 | 0 | 9 | 86 | 239 | 214 | 42 | 5 | 0 | 0 | 595 |
| 1994 | 0 | 0 | 0 | 0 | 16 | 145 | 271 | 152 | 36 | 2 | 1 | 0 | 623 |
| 1995 | 0 | 0 | 0 | 0 | 3 | 175 | 266 | 269 | 33 | 5 | 0 | 0 | 751 |
| 1996 | 0 | 0 | 0 | 1 | 31 | 115 | 120 | 147 | 58 | 0 | 0 | 0 | 472 |
| 1997 | 0 | 0 | 0 | 1 | 0 | 114 | 126 | 75 | 15 | 8 | 0 | 0 | 339 |
| 1998 | 0 | 0 | 9 | 0 | 48 | 125 | 152 | 168 | 53 | 4 | 0 | 0 | 559 |
| 1999 | 0 | 0 | 0 | 0 | 38 | 161 | 296 | 93 | 77 | 0 | 0 | 0 | 665 |
| 2000 | 0 | 0 | 0 | 2 | 49 | 105 | 95 | 120 | 63 | 0 | 0 | 0 | 434 |
| 2001 | 0 | 0 | 0 | 9 | 28 | 119 | 154 | 233 | 44 | 6 | 0 | 0 | 593 |
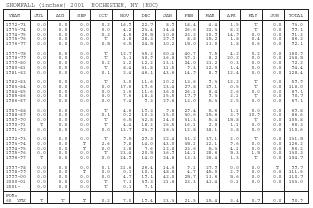
| SNOWFALL (inches) 2001 ROCHESTER, NY (ROC) | |||||||||||||
| YEAR | JUL | AUG | SEP | OCT | NOV | DEC | JAN | FEB | MAR | APR | MAY | JUN | TOTAL |
| 1972-73 | 0.0 | 0.0 | 0.0 | 0.2 | 16.9 | 22.7 | 8.9 | 18.4 | 4.4 | 1.5 | T | 0.0 | 73.0 |
| 1973-74 | 0.0 | 0.0 | 0.0 | 0.0 | 4.2 | 23.4 | 14.4 | 26.6 | 22.3 | 8.2 | T | 0.0 | 99.1 |
| 1974-75 | 0.0 | 0.0 | 0.0 | 0.3 | 4.6 | 26.5 | 10.8 | 23.2 | 10.9 | 14.9 | 0.0 | 0.0 | 91.2 |
| 1975-76 | 0.0 | 0.0 | 0.0 | T | 1.8 | 28.3 | 29.9 | 8.8 | 15.2 | 1.8 | 0.4 | 0.0 | 86.2 |
| 1976-77 | 0.0 | 0.0 | 0.0 | 0.5 | 6.5 | 24.5 | 30.2 | 15.0 | 13.0 | 1.8 | 0.6 | 0.0 | 92.1 |
| 1977-78 | 0.0 | 0.0 | 0.0 | T | 12.7 | 35.2 | 60.4 | 40.7 | 7.5 | 4.2 | 0.2 | 0.0 | 160.9 |
| 1978-79 | 0.0 | 0.0 | 0.0 | T | 3.3 | 30.9 | 36.8 | 39.1 | 8.2 | 20.2 | 0.0 | 0.0 | 138.5 |
| 1979-80 | 0.0 | 0.0 | 0.0 | 0.2 | 1.2 | 12.2 | 13.1 | 24.0 | 21.2 | 0.3 | 0.0 | 0.0 | 72.2 |
| 1980-81 | 0.0 | 0.0 | 0.0 | T | 8.4 | 31.8 | 31.5 | 9.3 | 12.0 | 1.4 | 0.0 | 0.0 | 94.4 |
| 1981-82 | 0.0 | 0.0 | 0.0 | 0.1 | 2.4 | 46.1 | 43.6 | 14.9 | 8.9 | 12.4 | 0.0 | 0.0 | 128.4 |
| 1982-83 | 0.0 | 0.0 | 0.0 | T | 3.0 | 11.6 | 10.2 | 13.6 | 9.3 | 12.2 | T | 0.0 | 59.9 |
| 1983-84 | 0.0 | 0.0 | 0.0 | 0.0 | 17.6 | 19.6 | 23.4 | 27.8 | 29.1 | 0.5 | T | 0.0 | 118.0 |
| 1984-85 | 0.0 | 0.0 | 0.0 | 0.0 | 1.6 | 11.6 | 36.8 | 26.1 | 8.4 | 2.6 | 0.0 | 0.0 | 87.1 |
| 1985-86 | 0.0 | 0.0 | 0.0 | 0.0 | 7.6 | 18.3 | 15.5 | 17.9 | 9.3 | 2.1 | T | 0.0 | 70.7 |
| 1986-87 | 0.0 | 0.0 | 0.0 | 0.0 | 7.4 | 9.3 | 29.6 | 13.0 | 5.3 | 2.5 | 0.0 | 0.0 | 67.1 |
| 1987-88 | 0.0 | 0.0 | 0.0 | T | 4.6 | 19.3 | 9.8 | 29.4 | 5.6 | 1.1 | 0.0 | 0.0 | 69.8 |
| 1988-89 | 0.0 | 0.0 | 0.0 | 0.1 | 0.2 | 10.3 | 15.0 | 30.6 | 15.6 | 3.9 | 10.9 | 0.0 | 86.6 |
| 1989-90 | 0.0 | 0.0 | 0.0 | T | 6.5 | 32.8 | 14.0 | 31.3 | 5.4 | 15.8 | T | 0.0 | 105.8 |
| 1990-91 | T | 0.0 | 0.0 | T | 4.4 | 18.2 | 26.5 | 16.1 | 2.0 | 1.1 | 0.0 | 0.0 | 68.3 |
| 1991-92 | 0.0 | 0.0 | 0.0 | 0.0 | 13.7 | 23.9 | 18.3 | 12.8 | 38.1 | 3.8 | 0.0 | 0.0 | 110.6 |
| 1992-93 | 0.0 | 0.0 | 0.0 | T | 9.5 | 29.3 | 22.4 | 31.2 | 37.1 | 2.0 | T | 0.0 | 131.5 |
| 1993-94 | 0.0 | 0.0 | T | 2.6 | 9.8 | 14.0 | 43.0 | 35.1 | 12.1 | 9.6 | 0.0 | 0.0 | 126.2 |
| 1994-95 | 0.0 | 0.0 | T | 0.0 | 2.8 | 7.6 | 12.8 | 23.6 | 5.3 | 4.1 | 0.0 | 0.0 | 56.2 |
| 1995-96 | 0.0 | 0.0 | 0.0 | T | 23.4 | 20.5 | 36.9 | 14.1 | 28.6 | 5.3 | 1.5 | 0.0 | 130.3 |
| 1996-97 | T | 0.0 | 0.0 | 0.0 | 24.9 | 14.0 | 24.8 | 13.3 | 26.4 | 1.3 | T | 0.0 | 104.7 |
| 1997-98 | 0.0 | 0.0 | 0.0 | 0.1 | 21.6 | 26.4 | 14.6 | 9.1 | 27.9 | 0.0 | 0.0 | T | 99.7 |
| 1998-99 | 0.0 | 0.0 | T | 0.0 | 0.1 | 10.1 | 48.8 | 4.7 | 45.0 | 2.9 | 0.0 | 0.0 | 111.6 |
| 1999-00 | 0.0 | 0.0 | 0.0 | 0.0 | 4.7 | 19.1 | 42.0 | 25.7 | 13.6 | 5.6 | 0.0 | 0.0 | 110.7 |
| 2000-01 | 0.0 | 0.0 | 0.0 | T | 7.3 | 39.3 | 21.6 | 23.3 | 41.4 | 0.1 | 0.0 | 0.0 | 133.0 |
| 2001- | 0.0 | 0.0 | 0.0 | T | 0.1 | 7.1 | |||||||
| POR=60 YRS | T | T | T | 0.2 | 7.0 | 19.4 | 23.3 | 21.5 | 15.4 | 3.4 | 0.7 | 0.0 | 90.9 |
Comment about this article, ask questions, or add new information about this topic: