2001 BUFFALO, NEW YORK (BUF)
The Niagara Frontier experiences a fairly hunid, continental type climate, but with a definite "maritime" flavor due to a strong modification from the Great Lakes (especially Lake Erie). Buffalo's weather repution is highly exaggerated, and due mainly to its propensity for localized heavy Lake–effect snowstorms in late fall and early winter. Summers, on the other hand, are among the most pleasant in the Northeast.
Winters in general are cloudy, cold and snowy…but are changeable and include frequent thaws and rain as well. Snow covers the ground more often than not from Christmas into early March…but periods of bare ground are not uncommon. Over half of the annual snowfall comes from "Lake–effect" process and is very localized. This feature develops when cold air crosses the warmer lake waters and becomes saturated..creating clouds and precipitation downwind. The exact location of these snowbands are determined by the direction of the wind. Areas south of Buffalo derive much more snow from this process than the more densely populated northern suburbs. This snow machine can start as early as mid–November, peaks in December, then virtually shuts down after Lake Erie freezes in mid to late January. The Buffalo area is not subject to heavy general or "synoptic" snowstorms. Most of them pass by to the east. Total season snowfall ranges from about 60 inches in the far northern suburbs to 80–90 inches in the city and eastern suburbs to as much as 120 inches south of the city. The lakes do modify any extreme cold as the mercury falls below zero on only about four nights in an average winter…with anything below –10 extremely rare.
Spring comes slowly to the Niagara Frontier. The ice pack in lake Erie does not usually disappear until mid–April and the Lake remains chilly through most of May. As the prevailing flow is southwesterly, areas near the lake are often as much as 20 degrees colder than inland locations. Conversely, the cool Lake acts as a strong stabilizing influence so areas near the city and lakeshore experience fewer thunderstorms and more sunshine then inland areas in spring. The slow start to the growing season also diminishes the threat of damaging late season frosts. The average date of the last frost is around April 30 in the metro area…but mid–May well inland.
Summer is beautiful in the Buffalo area. Sunshine is plentiful, temperature are warm but seldom hot, and humidity levels moderate. Rainfall is adequate, but does show an overnight maximum and seldom is a problem for outdoor activities. The stabilizing effect of Lake Erie continues to inhibit thunderstorms and ehance sunshine in the immediate Buffalo area..at least through most of July. It also moderates most extreme heat approaching from the Ohio Valley. There usually are several periods of uncomfortably warm and muggy weather in an average summer…but 90–degree readings are relatively rare (only 3 per year). August usually turns a bit more humid and showery as the Lake is warmer and loses its stabilizing influence. In fact, a good nighttime thunderstorm or two is often a feature of late summmer in Buffalo. Overall though…Buffalo has the sunniest and driest summers of any major city in the Northeast.
Autumn is pleasant, but rather brief. September is usually very tame, and much of October as well. The first frosts can be expected in late September over interior sections, but not until mid–October in the metro area. The warm lake can extend the growing season into early November during some years close to the Lakeshore. The growing season is relatively long for the latitude…about 180 days…and is conducive to the many Fruit orchards and wineries, especially near Lake Ontario and along the Lake Erie shore. Cold air surges from Canada become more common starting in late October…with their passage over the warmer Great Lakes resulting in a drastic increase in cloud cover in late October and early November as the Lake–effect season begins. The first measurable snows can be expected in mid to late November, but ground cover is only sporadic until mid December. Many of Buffalo's greatest snowstorms however, have occurred in late November and early December, all due to the Lake effect phenomenon.
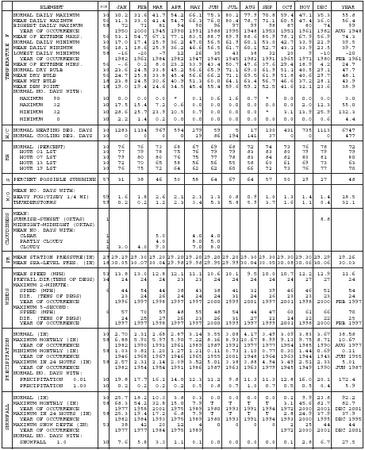
NORMALS, MEANS, AND EXTREMES
BUFFALO, NY (BUF)
LATITUDE: LONGITUDE: ELEVATION (FT): TIME ZONE: WBAN: 14733
42 56′ 27″ N 78 44′ 09″ W GRND: 714 BARO: � A0;717 EASTERN (UTC + 5)
| ELEMENT | POR | JAN | FEB | MAR | APR | MAY | JUN | JUL | AUG | SEP | OCT | NOV | DEC | YEAR | |
| TEMPERATURE F | NORMAL DAILY MAXIMUM | 30 | 30.2 | 31.6 | 41.7 | 54.2 | 66.1 | 75.3 | 80.2 | 77.9 | 70.8 | 59.4 | 47.1 | 35.3 | 55.8 |
| MEAN DAILY MAXIMUM | 56 | 31.3 | 33.0 | 41.4 | 54.7 | 66.3 | 76.0 | 80.4 | 78.7 | 71.1 | 60.5 | 47.4 | 36.0 | 56.4 | |
| HIGHEST DAILY MAXIMUM | 58 | 72 | 71 | 81 | 94 | 90 | 96 | 97 | 99 | 98 | 87 | 80 | 74 | 99 | |
| YEAR OF OCCURRENCE | 1950 | 2000 | 1945 | 1990 | 1991 | 1988 | 1995 | 1948 | 1953 | 1951 | 1961 | 1982 | AUG 1948 | ||
| MEAN OF EXTREME MAXS. | 56 | 53.1 | 54.7 | 67.1 | 77.1 | 83.5 | 88.7 | 89.9 | 88.6 | 85.9 | 78.1 | 67.9 | 56.9 | 74.3 | |
| NORMAL DAILY MINIMUM | 30 | 17.0 | 17.4 | 25.9 | 36.2 | 47.0 | 56.5 | 61.9 | 60.1 | 53.0 | 42.7 | 33.9 | 22.9 | 39.5 | |
| MEAN DAILY MINIMUM | 56 | 18.1 | 18.6 | 25.9 | 36.2 | 46.6 | 56.5 | 61.7 | 60.1 | 52.7 | 43.1 | 33.9 | 23.5 | 39.7 | |
| LOWEST DAILY MINIMUM | 58 | -16 | -20 | -7 | 12 | 26 | 35 | 43 | 38 | 32 | 20 | 9 | -10 | -20 | |
| YEAR OF OCCURRENCE | 1982 | 1961 | 1984 | 1982 | 1947 | 1945 | 1945 | 1982 | 1991 | 1965 | 1971 | 1980 | FEB 1961 | ||
| MEAN OF EXTREME MINS. | 56 | -.6 | 0.2 | 8.0 | 23.2 | 33.9 | 43.4 | 50.7 | 47.6 | 37.6 | 29.4 | 18.9 | 4.2 | 24.7 | |
| NORMAL DRY BULB | 30 | 23.6 | 24.5 | 33.8 | 45.2 | 56.6 | 65.9 | 71.1 | 69.0 | 61.9 | 51.1 | 40.5 | 29.1 | 47.7 | |
| MEAN DRY BULB | 56 | 24.7 | 25.8 | 33.8 | 45.4 | 56.6 | 66.2 | 71.1 | 69.5 | 61.9 | 51.8 | 40.6 | 29.7 | 48.1 | |
| MEAN WET BULB | 18 | 23.8 | 24.5 | 30.6 | 40.9 | 51.3 | 60.0 | 64.1 | 63.4 | 56.7 | 46.6 | 37.2 | 28.1 | 43.9 | |
| MEAN DEW POINT | 18 | 19.0 | 19.4 | 24.6 | 34.5 | 45.4 | 55.4 | 59.6 | 59.2 | 52.5 | 41.6 | 32.1 | 23.6 | 38.9 | |
| NORMAL NO. DAYS WITH: | |||||||||||||||
| MAXIMUM 90 | 30 | 0.0 | 0.0 | 0.0 | * | 0.1 | 0.6 | 1.6 | 0.7 | * | 0.0 | 0.0 | 0.0 | 3.0 | |
| MAXIMUM 32 | 30 | 17.5 | 15.4 | 7.2 | 0.6 | 0.0 | 0.0 | 0.0 | 0.0 | 0.0 | 0.0 | 2.0 | 12.3 | 55.0 | |
| MINIMUM 32 | 30 | 28.6 | 25.7 | 23.9 | 10.5 | 0.7 | 0.0 | 0.0 | 0.0 | * | 3.1 | 13.9 | 25.9 | 132.3 | |
| MINIMUM 0 | 30 | 2.2 | 1.4 | 0.2 | 0.0 | 0.0 | 0.0 | 0.0 | 0.0 | 0.0 | 0.0 | 0.0 | 0.6 | 4.4 | |
| H/C | NORMAL HEATING DEG. DAYS | 30 | 1283 | 1134 | 967 | 594 | 279 | 59 | 5 | 17 | 130 | 431 | 735 | 1113 | 6747 |
| NORMAL COOLING DEG. DAYS | 30 | 0 | 0 | 0 | 0 | 19 | 86 | 194 | 141 | 37 | 0 | 0 | 0 | 477 | |
| RH | NORMAL (PERCENT) | 30 | 76 | 76 | 73 | 68 | 67 | 69 | 68 | 72 | 74 | 73 | 76 | 78 | 72 |
| HOUR 01 LST | 30 | 77 | 79 | 78 | 75 | 76 | 79 | 79 | 83 | 83 | 80 | 79 | 79 | 79 | |
| HOUR 07 LST | 30 | 79 | 80 | 80 | 76 | 75 | 77 | 78 | 83 | 84 | 82 | 80 | 81 | 80 | |
| HOUR 13 LST | 30 | 72 | 70 | 65 | 58 | 56 | 56 | 55 | 58 | 60 | 61 | 69 | 73 | 63 | |
| HOUR 19 LST | 30 | 76 | 75 | 72 | 64 | 62 | 62 | 60 | 66 | 72 | 73 | 76 | 77 | 70 | |
| S | PERCENT POSSIBLE SUNSHINE | 57 | 31 | 38 | 46 | 50 | 58 | 64 | 67 | 64 | 57 | 50 | 29 | 27 | 48 |
| W/O | MEAN NO. DAYS WITH: | ||||||||||||||
| HEAVY FOG(VISBY 1/4 MI) | 59 | 1.6 | 1.8 | 2.6 | 2.1 | 2.3 | 1.3 | 0.8 | 0.9 | 1.0 | 1.3 | 1.4 | 1.4 | 18.5 | |
| THUNDERSTORMS | 59 | 0.2 | 0.2 | 1.2 | 2.3 | 3.4 | 5.3 | 5.8 | 5.9 | 3.7 | 1.6 | 1.1 | 0.4 | 31.1 | |
| CLOUDINESS | MEAN: | ||||||||||||||
| SUNRISE-SUNSET (OKTAS) | 1 | 8.8 | |||||||||||||
| MIDNIGHT-MIDNIGHT (OKTAS) | |||||||||||||||
| MEAN NO. DAYS WITH: | |||||||||||||||
| CLEAR | 1 | 5.0 | 4.0 | 4.0 | |||||||||||
| PARTLY CLOUDY | 1 | 4.0 | 8.0 | 5.0 | |||||||||||
| CLOUDY | 1 | 3.0 | 4.0 | 9.0 | 7.0 | 8.0 | |||||||||
| PR | MEAN STATION PRESSURE(IN) | 29 | 29.29 | 29.30 | 29.20 | 29.20 | 29.20 | 29.20 | 29.20 | 29.30 | 29.30 | 29.30 | 29.30 | 29.29 | 29.26 |
| MEAN SEA-LEVEL PRES. (IN) | 18 | 30.05 | 30.07 | 30.04 | 29.98 | 29.98 | 29.95 | 29.99 | 30.04 | 30.05 | 30.08 | 30.06 | 30.06 | 30.03 | |
| WINDS | MEAN SPEED (MPH) | 53 | 13.8 | 13.0 | 12.8 | 12.1 | 11.1 | 10.6 | 10.1 | 9.5 | 10.0 | 10.7 | 12.2 | 12.9 | 11.6 |
| PREVAIL. DIR (TENS OF DEGS) | 34 | 24 | 24 | 24 | 23 | 23 | 24 | 24 | 24 | 24 | 24 | 27 | 27 | 24 | |
| MAXIMUM 2-MINUTE: | |||||||||||||||
| SPEED (MPH) | 6 | 44 | 54 | 44 | 38 | 43 | 38 | 41 | 32 | 39 | 46 | 46 | 51 | 54 | |
| DIR. (TENS OF DEGS) | 23 | 24 | 26 | 24 | 24 | 24 | 31 | 24 | 26 | 23 | 23 | 23 | 24 | ||
| YEAR OF OCCURRENCE | 1996 | 1997 | 1998 | 1997 | 1997 | 2000 | 1999 | 2001 | 1997 | 2001 | 1998 | 2000 | FEB 1997 | ||
| MAXIMUM 5-SECOND: | |||||||||||||||
| SPEED (MPH) | 6 | 57 | 70 | 57 | 48 | 55 | 48 | 54 | 44 | 47 | 60 | 61 | 66 | 70 | |
| DIR. (TENS OF DEGS) | 24 | 25 | 27 | 26 | 23 | 26 | 31 | 27 | 22 | 24 | 22 | 22 | 25 | ||
| YEAR OF OCCURRENCE | 1997 | 1997 | 1998 | 1997 | 1997 | 2000 | 1999 | 1997 | 1999 | 2001 | 1998 | 2000 | FEB 1997 | ||
| PRECIPITATION | NORMAL (IN) | 30 | 2.70 | 2.31 | 2.68 | 2.87 | 3.14 | 3.55 | 3.08 | 4.17 | 3.49 | 3.09 | 3.83 | 3.67 | 38.58 |
| MAXIMUM MONTHLY (IN) | 58 | 6.88 | 5.90 | 5.97 | 5.90 | 7.22 | 8.36 | 8.93 | 10.67 | 8.99 | 9.13 | 9.75 | 8.71 | 10.67 | |
| YEAR OF OCCURRENCE | 1982 | 1990 | 1991 | 1961 | 1989 | 1987 | 1992 | 1977 | 1977 | 1954 | 1985 | 1990 | AUG 1977 | ||
| MINIMUM MONTHLY (IN) | 58 | 1.03 | 0.81 | 1.20 | 1.27 | 1.21 | 0.11 | 0.73 | 1.10 | 0.77 | 0.30 | 1.44 | 0.69 | 0.11 | |
| YEAR OF OCCURRENCE | 1946 | 1968 | 1967 | 1946 | 1965 | 1955 | 2001 | 1948 | 1964 | 1963 | 1944 | 1943 | JUN 1955 | ||
| MAXIMUM IN 24 HOURS (IN) | 58 | 2.57 | 2.31 | 2.14 | 2.09 | 3.52 | 5.01 | 3.38 | 3.88 | 4.94 | 3.49 | 2.51 | 2.33 | 5.01 | |
| YEAR OF OCCURRENCE | 1982 | 1954 | 1954 | 1991 | 1986 | 1987 | 1963 | 1963 | 1979 | 1945 | 1949 | 1990 | JUN 1987 | ||
| NORMAL NO. DAYS WITH: | |||||||||||||||
| PRECIPITATION 0.01 | 30 | 19.8 | 17.7 | 16.1 | 14.0 | 12.3 | 11.2 | 9.8 | 11.3 | 11.3 | 12.8 | 16.0 | 20.1 | 172.4 | |
| PRECIPITATION 1.00 | 30 | 0.2 | 0.2 | 0.2 | 0.2 | 0.5 | 0.8 | 0.7 | 1.0 | 0.7 | 0.5 | 0.5 | 0.4 | 5.9 | |
| SNOWFALL | NORMAL (IN) | 30 | 25.7 | 18.2 | 10.3 | 3.8 | 0.3 | 0.0 | 0.0 | 0.0 | 0.0 | 0.2 | 9.9 | 23.8 | 92.2 |
| MAXIMUM MONTHLY (IN) | 58 | 68.3 | 54.2 | 32.8 | 15.0 | 7.9 | T | T | T | T | 3.1 | 45.6 | 82.7 | 82.7 | |
| YEAR OF OCCURRENCE | 1977 | 1958 | 2001 | 1975 | 1989 | 1980 | 1993 | 1991 | 1994 | 1972 | 2000 | 2001 | DEC 2001 | ||
| MAXIMUM IN 24 HOURS (IN) | 58 | 25.3 | 19.4 | 17.2 | 6.8 | 7.9 | T | T | T | T | 2.8 | 24.9 | 37.9 | 37.9 | |
| YEAR OF OCCURRENCE | 1982 | 1984 | 1993 | 1975 | 1989 | 1980 | 1993 | 1991 | 1994 | 1993 | 2000 | 1995 | DEC 1995 | ||
| MAXIMUM SNOW DEPTH (IN) | 53 | 38 | 42 | 20 | 12 | 4 | 0 | 0 | 0 | 0 | 2 | 25 | 44 | 44 | |
| YEAR OF OCCURRENCE | 1977 | 1977 | 1984 | 1975 | 1989 | 1972 | 2000 | 2001 | DEC 2001 | ||||||
| NORMAL NO. DAYS WITH: | |||||||||||||||
| SNOWFALL 1.0 | 30 | 7.6 | 5.8 | 3.3 | 1.1 | 0.1 | 0.0 | 0.0 | 0.0 | 0.0 | 0.1 | 2.8 | 6.7 | 27.5 |
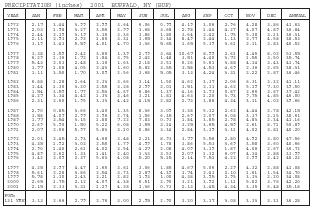
| PRECIPITATION (inches) 2001 BUFFALO, NY (BUF) | |||||||||||||
| YEAR | JAN | FEB | MAR | APR | MAY | JUN | JUL | AUG | SEP | OCT | NOV | DEC | ANNUAL |
| 1972 | 2.17 | 3.44 | 3.99 | 2.99 | 3.64 | 6.06 | 0.99 | 4.19 | 3.06 | 2.96 | 4.28 | 3.86 | 41.63 |
| 1973 | 2.03 | 1.98 | 3.27 | 3.56 | 2.99 | 1.68 | 3.68 | 2.98 | 1.44 | 4.27 | 4.07 | 4.89 | 36.84 |
| 1974 | 2.44 | 2.19 | 3.19 | 3.15 | 3.36 | 3.86 | 1.80 | 3.64 | 2.42 | 1.75 | 5.38 | 3.13 | 36.31 |
| 1975 | 2.11 | 2.93 | 2.92 | 1.86 | 3.31 | 3.65 | 2.34 | 8.49 | 2.44 | 1.13 | 2.77 | 4.58 | 38.53 |
| 1976 | 3.19 | 3.43 | 5.59 | 4.01 | 4.70 | 3.36 | 5.65 | 1.65 | 5.39 | 3.61 | 2.11 | 3.83 | 46.52 |
| 1977 | 3.38 | 1.59 | 2.42 | 3.60 | 1.39 | 2.79 | 3.64 | 10.67 | 8.99 | 2.61 | 4.45 | 8.02 | 53.55 |
| 1978 | 6.29 | 1.36 | 1.72 | 1.84 | 3.95 | 2.42 | 1.48 | 3.51 | 4.40 | 3.72 | 1.55 | 3.50 | 35.74 |
| 1979 | 5.43 | 2.03 | 2.48 | 3.16 | 1.63 | 2.18 | 3.51 | 6.26 | 5.61 | 3.88 | 4.14 | 3.43 | 43.74 |
| 1980 | 1.97 | 1.08 | 4.05 | 2.43 | 1.60 | 5.82 | 3.55 | 3.58 | 4.53 | 4.69 | 2.36 | 2.65 | 38.31 |
| 1981 | 1.11 | 3.50 | 1.70 | 3.09 | 2.56 | 3.68 | 5.05 | 3.13 | 4.24 | 3.31 | 2.22 | 2.87 | 36.46 |
| 1982 | 6.88 | 1.28 | 2.64 | 2.33 | 3.66 | 3.14 | 1.50 | 4.62 | 3.37 | 2.06 | 6.31 | 3.32 | 41.11 |
| 1983 | 1.44 | 1.30 | 3.20 | 2.55 | 3.28 | 2.99 | 2.01 | 3.51 | 2.11 | 4.62 | 5.19 | 7.30 | 39.50 |
| 1984 | 1.54 | 3.59 | 1.77 | 2.53 | 4.67 | 6.86 | 1.37 | 4.16 | 3.73 | 0.87 | 2.66 | 3.67 | 37.42 |
| 1985 | 4.27 | 3.34 | 4.42 | 1.33 | 3.46 | 3.21 | 1.81 | 4.63 | 1.20 | 3.73 | 9.75 | 4.85 | 46.00 |
| 1986 | 2.31 | 2.60 | 1.95 | 3.33 | 4.42 | 4.15 | 2.82 | 2.73 | 3.88 | 4.34 | 3.11 | 4.02 | 39.66 |
| 1987 | 2.90 | 0.85 | 3.66 | 3.40 | 1.35 | 8.36 | 3.09 | 3.38 | 5.32 | 2.62 | 4.44 | 2.78 | 42.15 |
| 1988 | 1.58 | 4.07 | 2.99 | 2.96 | 2.74 | 1.56 | 6.35 | 2.69 | 2.07 | 6.08 | 3.37 | 2.15 | 38.61 |
| 1989 | 1.77 | 2.54 | 3.15 | 1.88 | 7.22 | 7.83 | 0.93 | 1.84 | 3.85 | 2.98 | 4.83 | 2.34 | 41.16 |
| 1990 | 2.69 | 5.90 | 1.50 | 5.22 | 6.08 | 3.55 | 3.14 | 3.25 | 3.65 | 4.59 | 2.61 | 8.71 | 50.89 |
| 1991 | 2.07 | 2.06 | 5.97 | 5.83 | 3.10 | 0.86 | 3.34 | 2.84 | 3.19 | 3.11 | 4.02 | 3.81 | 40.20 |
| 1992 | 2.01 | 2.45 | 2.93 | 4.68 | 3.48 | 2.21 | 8.93 | 3.79 | 5.56 | 2.80 | 4.92 | 3.80 | 47.56 |
| 1993 | 4.35 | 1.92 | 3.02 | 2.55 | 1.79 | 4.99 | 1.78 | 3.86 | 5.53 | 3.69 | 3.58 | 3.60 | 40.66 |
| 1994 | 2.90 | 1.40 | 2.61 | 4.02 | 3.54 | 4.27 | 2.08 | 4.09 | 3.19 | 1.87 | 4.08 | 2.67 | 36.72 |
| 1995 | 4.89 | 2.62 | 1.33 | 1.41 | 2.40 | 1.33 | 3.53 | 2.07 | 1.32 | 6.07 | 4.14 | 2.88 | 33.99 |
| 1996 | 3.42 | 2.09 | 2.37 | 5.63 | 4.08 | 5.20 | 5.15 | 2.14 | 7.51 | 4.22 | 2.99 | 3.42 | 48.22 |
| 1997 | 4.25 | 2.97 | 4.47 | 1.65 | 3.61 | 3.06 | 1.85 | 4.67 | 5.06 | 2.29 | 4.32 | 2.88 | 41.08 |
| 1998 | 5.61 | 2.28 | 3.86 | 2.54 | 3.73 | 2.87 | 4.39 | 1.74 | 2.43 | 2.10 | 1.61 | 1.54 | 34.70 |
| 1999 | 5.78 | 1.10 | 2.43 | 2.21 | 2.82 | 1.93 | 1.00 | 4.38 | 3.95 | 2.95 | 3.33 | 2.20 | 34.08 |
| 2000 | 2.65 | 1.75 | 2.12 | 4.07 | 4.38 | 6.51 | 2.90 | 3.21 | 3.92 | 1.11 | 5.82 | 3.76 | 42.20 |
| 2001 | 2.15 | 2.33 | 3.31 | 1.27 | 4.28 | 1.36 | 0.73 | 2.13 | 3.45 | 4.34 | 3.35 | 6.48 | 35.18 |
| POR=131 YRS | 3.13 | 2.66 | 2.79 | 2.76 | 3.00 | 2.95 | 2.90 | 3.20 | 3.17 | 3.08 | 3.33 | 3.31 | 36.28 |
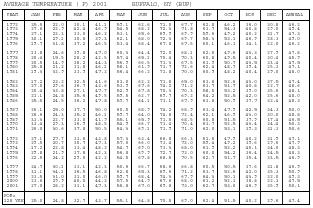
| AVERAGE TEMPERATURE (F) 2001 BUFFALO, NY (BUF) | |||||||||||||
| YEAR | JAN | FEB | MAR | APR | MAY | JUN | JUL | AUG | SEP | OCT | NOV | DEC | ANNUAL |
| 1972 | 25.5 | 22.0 | 30.1 | 41.1 | 59.1 | 62.6 | 71.0 | 67.7 | 62.8 | 46.2 | 36.0 | 30.8 | 46.2 |
| 1973 | 27.6 | 22.9 | 42.4 | 46.9 | 54.5 | 68.2 | 72.3 | 71.8 | 61.7 | 54.3 | 40.8 | 29.0 | 49.4 |
| 1974 | 27.1 | 22.3 | 33.0 | 46.2 | 53.1 | 65.6 | 69.9 | 69.9 | 59.6 | 49.2 | 40.2 | 31.7 | 47.3 |
| 1975 | 30.1 | 29.1 | 30.8 | 39.3 | 62.1 | 68.0 | 72.3 | 69.7 | 58.3 | 53.1 | 46.9 | 28.3 | 49.0 |
| 1976 | 19.7 | 31.8 | 37.2 | 46.5 | 53.4 | 68.4 | 67.8 | 67.5 | 60.1 | 46.3 | 34.1 | 22.0 | 46.2 |
| 1977 | 13.8 | 24.6 | 39.8 | 47.0 | 60.3 | 64.4 | 72.0 | 68.1 | 62.6 | 49.6 | 43.3 | 27.9 | 47.8 |
| 1978 | 20.4 | 15.5 | 28.2 | 42.5 | 57.4 | 65.1 | 70.4 | 70.3 | 60.8 | 49.5 | 40.4 | 30.4 | 45.9 |
| 1979 | 20.5 | 14.9 | 38.2 | 44.3 | 56.9 | 66.5 | 71.3 | 67.5 | 61.9 | 50.7 | 43.5 | 33.4 | 47.5 |
| 1980 | 25.8 | 21.2 | 31.8 | 46.1 | 58.1 | 61.9 | 71.7 | 72.6 | 62.4 | 48.7 | 39.4 | 25.3 | 47.1 |
| 1981 | 19.3 | 32.9 | 33.9 | 47.2 | 56.4 | 66.2 | 71.8 | 70.0 | 60.9 | 48.2 | 40.4 | 29.0 | 48.0 |
| 1982 | 17.2 | 23.2 | 32.5 | 41.6 | 61.0 | 62.2 | 71.8 | 65.0 | 61.6 | 52.6 | 43.0 | 37.5 | 47.4 |
| 1983 | 27.0 | 29.6 | 36.7 | 43.6 | 53.9 | 67.6 | 74.2 | 71.2 | 63.7 | 51.7 | 40.8 | 22.7 | 48.6 |
| 1984 | 20.4 | 33.8 | 27.1 | 47.7 | 52.9 | 67.8 | 70.3 | 70.3 | 58.5 | 53.2 | 39.0 | 35.6 | 48.1 |
| 1985 | 21.1 | 24.8 | 35.6 | 49.5 | 59.5 | 62.7 | 69.7 | 69.2 | 64.2 | 52.5 | 42.0 | 25.6 | 48.0 |
| 1986 | 25.5 | 24.5 | 36.2 | 47.8 | 59.7 | 64.1 | 71.1 | 67.9 | 61.8 | 50.9 | 37.7 | 32.4 | 48.3 |
| 1987 | 26.1 | 25.0 | 37.7 | 50.0 | 60.5 | 68.9 | 74.2 | 68.9 | 63.4 | 47.9 | 42.5 | 34.3 | 50.0 |
| 1988 | 26.6 | 24.3 | 35.2 | 46.1 | 59.7 | 64.0 | 74.8 | 72.4 | 62.1 | 46.9 | 43.0 | 30.0 | 48.8 |
| 1989 | 31.3 | 22.7 | 33.0 | 41.9 | 55.1 | 65.9 | 71.5 | 68.5 | 60.8 | 51.5 | 37.9 | 17.4 | 46.5 |
| 1990 | 33.4 | 29.3 | 36.9 | 48.5 | 54.9 | 66.7 | 71.4 | 70.4 | 61.7 | 52.5 | 43.4 | 34.4 | 50.3 |
| 1991 | 26.0 | 30.6 | 37.8 | 50.5 | 64.3 | 69.1 | 71.9 | 71.0 | 62.0 | 53.1 | 39.3 | 31.3 | 50.6 |
| 1992 | 27.1 | 27.7 | 31.6 | 43.8 | 57.3 | 63.4 | 66.8 | 66.3 | 61.6 | 47.9 | 40.2 | 31.9 | 47.1 |
| 1993 | 29.5 | 20.7 | 30.7 | 47.3 | 57.0 | 66.0 | 73.4 | 72.0 | 59.4 | 49.2 | 39.6 | 29.6 | 47.9 |
| 1994 | 17.2 | 22.8 | 33.4 | 48.2 | 54.7 | 69.0 | 73.3 | 68.0 | 61.9 | 52.2 | 45.1 | 34.0 | 48.3 |
| 1995 | 29.8 | 21.9 | 37.8 | 42.3 | 56.8 | 69.9 | 72.7 | 73.0 | 60.0 | 54.2 | 36.4 | 24.5 | 48.3 |
| 1996 | 22.5 | 24.2 | 29.0 | 42.2 | 54.5 | 67.8 | 68.5 | 70.5 | 62.7 | 51.7 | 35.4 | 33.5 | 46.9 |
| 1997 | 24.7 | 30.1 | 33.1 | 42.3 | 50.6 | 66.7 | 68.6 | 66.8 | 60.5 | 50.5 | 37.6 | 31.8 | 46.9 |
| 1998 | 31.1 | 34.1 | 36.5 | 46.8 | 62.8 | 65.3 | 69.6 | 71.2 | 63.7 | 52.6 | 42.0 | 35.3 | 50.9 |
| 1999 | 23.5 | 31.0 | 31.0 | 46.0 | 59.7 | 68.4 | 74.3 | 67.9 | 64.3 | 50.1 | 43.9 | 32.0 | 49.3 |
| 2000 | 23.6 | 29.9 | 40.0 | 44.2 | 57.5 | 64.9 | 67.6 | 68.0 | 61.2 | 52.3 | 38.8 | 22.1 | 47.5 |
| 2001 | 27.0 | 28.2 | 31.1 | 47.3 | 58.8 | 67.0 | 69.8 | 73.0 | 62.7 | 53.0 | 46.9 | 35.9 | 50.1 |
| POR=128 YRS | 25.0 | 24.8 | 32.7 | 43.7 | 55.1 | 64.8 | 70.5 | 69.0 | 62.4 | 51.5 | 40.2 | 29.6 | 47.4 |
REFERENCE NOTES:
PAGE 1:
THE TEMPERATURE GRAPH SHOWS NORMAL MAXIMUM AND NORMAL MINIMUM DAILY TEMPERATURES (SOLID CURVES) AND THE ACTUAL DAILY HIGH AND LOW TEMPERATURES (VERTICAL BARS).
PAGE 2 AND 3:
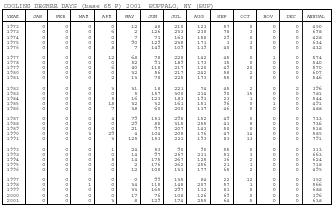
H/C INDICATES HEATING AND COOLING DEGREE DAYS.
RH INDICATES RELATIVE HUMIDITY
W/O INDICATES WEATHER AND OBSTRUCTIONS
S INDICATES SUNSHINE.
PR INDICATES PRESSURE.
CLOUDINESS ON PAGE 3 IS THE SUM OF THE CEILOMETER AND SATELLITE DATA NOT TO EXCEED EIGHT EIGHTHS (OKTAS).
GENERAL:
T INDICATES TRACE PRECIPITATION, AN AMOUNT GREATER THAN ZERO BUT LESS THAN THE LOWEST REPORTABLE VALUE.
+ INDICATES THE VALUE ALSO OCCURS ON EARLIER DATES.
BLANK ENTRIES DENOTE MISSING OR UNREPORTED DATA.
NORMALS ARE 30–YEAR AVERAGES (1961–1990).
ASOS INDICATES AUTOMATED SURFACE OBSERVING SYSTEM.
PM INDICATES THE LAST DAY OF THE PREVIOUS MONTH.
POR (PERIOD OF RECORD) BEGINS WITH THE JANUARY DATA MONTH AND IS THE NUMBER OF YEARS USED TO COMPUTE THE MEAN. INDIVIDUAL MONTHS WITHIN THE POR MAY BE MISSING.
WHEN THE POR FOR A NORMAL IS LESS THAN 30 YEARS, THE NORMAL IS PROVISIONAL AND IS BASED ON THE NUMBER OF YEARS INDICATED.
0.* OR * INDICATES THE VALUE OR MEAN–DAYS–WITH IS BETWEEN 0.00 AND 0.05.
CLOUDINESS FOR ASOS STATIONS DIFFERS FROM THE NON–ASOS OBSERVATION TAKEN BY A HUMAN OBSERVER. ASOS STATION CLOUDINESS IS BASED ON TIME–AVERAGED CEILOMETER DATA FOR CLOUDS AT OR BELOW 12,000 FEET AND ON SATELLITE DATA FOR CLOUDS ABOVE 12,000 FEET.
THE NUMBER OF DAYS WITH CLEAR, PARTLY CLOUDY, AND CLOUDY CONDITIONS FOR ASOS STATIONS IS THE SUM OF THE CEILOMETER AND SATELLITE DATA FOR THE SUNRISE TO SUNSET PERIOD.
GENERAL CONTINUED:
CLEAR INDICATES 0–2 OKTAS, PARTLY CLOUDY INDICATES 3–6 OKTAS, AND CLOUDY INDICATES 7 OR 8 OKTAS. WHEN AT LEAST ONE OF THE ELEMENTS (CEILOMETER OR SATELLITE) IS MISSING, THE DAILY CLOUDINESS IS NOT COMPUTED.
WIND DIRECTION IS RECORDED IN TENS OF DEGREES (2 DIGITS) CLOCKWISE FROM TRUE NORTH. "00" INDICATES CALM. "36" INDICATES TRUE NORTH.
RESULTANT WIND IS THE VECTOR AVERAGE OF THE SPEED AND DIRECTION.
AVERAGE TEMPERATURE IS THE SUM OF THE MEAN DAILY MAXIMUM AND MINIMUM TEMPERATURE DIVIDED BY 2.
SNOWFALL DATA COMPRISE ALL FORMS OF FROZEN PRECIPITATION, INCLUDING HAIL.
A HEATING (COOLING) DEGREE DAY IS THE DIFFERENCE BETWEEN THE AVERAGE DAILY TEMPERATURE AND 65 F.
DRY BULB IS THE TEMPERATURE OF THE AMBIENT AIR.
DEW POINT IS THE TEMPERATURE TO WHICH THE AIR MUST BE COOLED TO ACHIEVE 100 PERCENT RELATIVE HUMIDITY.
WET BULB IS THE TEMPERATURE THE AIR WOULD HAVE IF THE MOISTURE CONTENT WAS INCREASED TO 100 PERCENT RELATIVE HUMIDITY.
ON JULY 1, 1996, THE NATIONAL WEATHER SERVICE BEGAN USING THE "METAR" OBSERVATION CODE THAT WAS ALREADY EMPLOYED BY MOST OTHER NATIONS OF THE WORLD. THE MOST NOTICEABLE DIFFERENCE IN THIS ANNUAL PUBLICATION WILL BE THE CHANGE IN UNITS FROM TENTHS TO EIGHTS (OKTAS) FOR REPORTING THE AMOUNT OF SKY COVER.
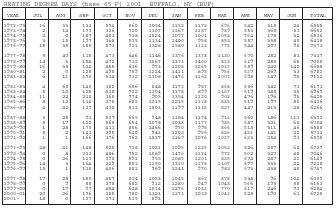
| HEATING DEGREE DAYS (base 65 F) 2001 BUFFALO, NY (BUF) | |||||||||||||
| YEAR | JUL | AUG | SEP | OCT | NOV | DEC | JAN | FEB | MAR | APR | MAY | JUN | TOTAL |
| 1972-73 | 16 | 33 | 113 | 574 | 860 | 1054 | 1152 | 1173 | 696 | 542 | 318 | 24 | 6555 |
| 1973-74 | 2 | 14 | 171 | 326 | 720 | 1107 | 1167 | 1187 | 989 | 553 | 365 | 51 | 6652 |
| 1974-75 | 2 | 0 | 187 | 483 | 738 | 1024 | 1077 | 1001 | 1053 | 764 | 175 | 32 | 6536 |
| 1975-76 | 3 | 15 | 197 | 368 | 535 | 1134 | 1400 | 958 | 853 | 557 | 358 | 40 | 6418 |
| 1976-77 | 15 | 35 | 180 | 573 | 921 | 1328 | 1580 | 1123 | 775 | 544 | 207 | 90 | 7371 |
| 1977-78 | 5 | 40 | 110 | 473 | 646 | 1146 | 1376 | 1378 | 1130 | 670 | 282 | 81 | 7337 |
| 1978-79 | 14 | 3 | 154 | 472 | 732 | 1067 | 1371 | 1400 | 823 | 619 | 285 | 65 | 7005 |
| 1979-80 | 16 | 35 | 134 | 455 | 636 | 973 | 1208 | 1265 | 1022 | 559 | 240 | 142 | 6685 |
| 1980-81 | 2 | 0 | 128 | 498 | 759 | 1224 | 1411 | 895 | 956 | 527 | 269 | 33 | 6702 |
| 1981-82 | 6 | 11 | 170 | 514 | 732 | 1108 | 1476 | 1163 | 1002 | 698 | 147 | 95 | 7122 |
| 1982-83 | 4 | 65 | 140 | 382 | 656 | 848 | 1172 | 987 | 868 | 636 | 342 | 71 | 6171 |
| 1983-84 | 5 | 10 | 125 | 418 | 722 | 1304 | 1378 | 899 | 1167 | 519 | 385 | 35 | 6967 |
| 1984-85 | 11 | 22 | 210 | 360 | 774 | 905 | 1354 | 1120 | 902 | 476 | 196 | 95 | 6425 |
| 1985-86 | 8 | 12 | 114 | 378 | 685 | 1215 | 1215 | 1128 | 885 | 519 | 197 | 80 | 6436 |
| 1986-87 | 4 | 42 | 137 | 430 | 811 | 1003 | 1199 | 1115 | 837 | 447 | 213 | 28 | 6266 |
| 1987-88 | 3 | 25 | 91 | 527 | 665 | 948 | 1184 | 1174 | 916 | 560 | 186 | 113 | 6392 |
| 1988-89 | 5 | 17 | 122 | 560 | 654 | 1078 | 1038 | 1177 | 985 | 687 | 321 | 60 | 6704 |
| 1989-90 | 1 | 28 | 170 | 411 | 806 | 1466 | 970 | 995 | 866 | 518 | 311 | 46 | 6588 |
| 1990-91 | 5 | 2 | 141 | 395 | 640 | 941 | 1203 | 956 | 836 | 431 | 141 | 22 | 5713 |
| 1991-92 | 1 | 1 | 166 | 376 | 762 | 1037 | 1169 | 1076 | 1027 | 633 | 254 | 93 | 6595 |
| 1992-93 | 28 | 41 | 148 | 525 | 738 | 1021 | 1095 | 1235 | 1053 | 526 | 257 | 60 | 6727 |
| 1993-94 | 0 | 8 | 212 | 486 | 752 | 1089 | 1476 | 1174 | 972 | 502 | 327 | 48 | 7046 |
| 1994-95 | 0 | 26 | 123 | 390 | 591 | 955 | 1085 | 1201 | 835 | 674 | 247 | 22 | 6149 |
| 1995-96 | 14 | 3 | 164 | 329 | 851 | 1250 | 1310 | 1178 | 1107 | 677 | 333 | 22 | 7238 |
| 1996-97 | 15 | 1 | 130 | 406 | 881 | 969 | 1241 | 970 | 983 | 673 | 438 | 40 | 6747 |
| 1997-98 | 17 | 25 | 150 | 457 | 814 | 1023 | 1045 | 862 | 878 | 538 | 96 | 104 | 6009 |
| 1998-99 | 0 | 9 | 88 | 378 | 682 | 912 | 1280 | 949 | 1048 | 566 | 193 | 58 | 6163 |
| 1999-00 | 0 | 17 | 97 | 454 | 628 | 1014 | 1276 | 1012 | 770 | 617 | 246 | 73 | 6204 |
| 2000-01 | 20 | 26 | 176 | 385 | 780 | 1323 | 1171 | 1023 | 1042 | 528 | 190 | 61 | 6725 |
| 2001- | 18 | 0 | 127 | 371 | 535 | 893 | |||||||
| COOLING DEGREE DAYS (base 65 F) 2001 BUFFALO, NY (BUF) | |||||||||||||
| YEAR | JAN | FEB | MAR | APR | MAY | JUN | JUL | AUG | SEP | OCT | NOV | DEC | ANNUAL |
| 1972 | 0 | 0 | 0 | 0 | 12 | 48 | 210 | 123 | 57 | 0 | 0 | 0 | 450 |
| 1973 | 0 | 0 | 0 | 6 | 2 | 126 | 233 | 230 | 78 | 3 | 0 | 0 | 678 |
| 1974 | 0 | 0 | 0 | 0 | 7 | 71 | 163 | 158 | 29 | 0 | 0 | 0 | 428 |
| 1975 | 0 | 0 | 0 | 0 | 90 | 129 | 238 | 171 | 3 | 3 | 0 | 0 | 634 |
| 1976 | 0 | 0 | 0 | 8 | 7 | 149 | 109 | 119 | 40 | 0 | 0 | 0 | 432 |
| 1977 | 0 | 0 | 0 | 12 | 68 | 78 | 228 | 142 | 45 | 0 | 1 | 0 | 574 |
| 1978 | 0 | 0 | 0 | 0 | 52 | 91 | 189 | 173 | 35 | 0 | 0 | 0 | 540 |
| 1979 | 0 | 0 | 0 | 6 | 40 | 118 | 217 | 120 | 49 | 20 | 0 | 0 | 570 |
| 1980 | 0 | 0 | 0 | 0 | 32 | 56 | 217 | 242 | 58 | 2 | 0 | 0 | 607 |
| 1981 | 0 | 0 | 0 | 2 | 13 | 78 | 225 | 173 | 55 | 0 | 0 | 0 | 546 |
| 1982 | 0 | 0 | 0 | 3 | 31 | 18 | 221 | 74 | 45 | 2 | 0 | 2 | 396 |
| 1983 | 0 | 0 | 0 | 0 | 5 | 157 | 300 | 214 | 90 | 15 | 0 | 0 | 781 |
| 1984 | 0 | 0 | 0 | 5 | 16 | 123 | 183 | 193 | 23 | 1 | 0 | 0 | 544 |
| 1985 | 0 | 0 | 0 | 18 | 32 | 32 | 161 | 151 | 96 | 0 | 1 | 0 | 491 |
| 1986 | 0 | 0 | 0 | 7 | 38 | 60 | 200 | 137 | 46 | 0 | 0 | 0 | 488 |
| 1987 | 0 | 0 | 0 | 4 | 79 | 151 | 298 | 152 | 49 | 0 | 0 | 0 | 733 |
| 1988 | 0 | 0 | 0 | 0 | 29 | 88 | 315 | 255 | 41 | 8 | 0 | 0 | 736 |
| 1989 | 0 | 0 | 0 | 0 | 21 | 97 | 207 | 143 | 50 | 0 | 0 | 0 | 518 |
| 1990 | 0 | 0 | 3 | 29 | 4 | 104 | 208 | 176 | 47 | 14 | 0 | 0 | 585 |
| 1991 | 0 | 0 | 0 | 3 | 125 | 153 | 221 | 193 | 83 | 13 | 0 | 0 | 791 |
| 1992 | 0 | 0 | 0 | 1 | 24 | 53 | 90 | 90 | 55 | 0 | 0 | 0 | 313 |
| 1993 | 0 | 0 | 0 | 0 | 14 | 97 | 267 | 231 | 51 | 3 | 0 | 0 | 663 |
| 1994 | 0 | 0 | 0 | 5 | 14 | 175 | 267 | 125 | 36 | 2 | 0 | 0 | 624 |
| 1995 | 0 | 0 | 0 | 0 | 2 | 176 | 262 | 256 | 21 | 1 | 0 | 0 | 718 |
| 1996 | 0 | 0 | 0 | 0 | 12 | 108 | 131 | 177 | 65 | 2 | 0 | 0 | 495 |
| 1997 | 0 | 0 | 0 | 0 | 0 | 99 | 135 | 84 | 22 | 12 | 0 | 0 | 352 |
| 1998 | 0 | 0 | 1 | 0 | 34 | 118 | 148 | 207 | 57 | 1 | 0 | 0 | 566 |
| 1999 | 0 | 0 | 0 | 0 | 33 | 165 | 297 | 112 | 81 | 0 | 0 | 0 | 688 |
| 2000 | 0 | 0 | 0 | 0 | 17 | 76 | 108 | 126 | 69 | 0 | 0 | 0 | 396 |
| 2001 | 0 | 0 | 0 | 3 | 8 | 129 | 174 | 255 | 64 | 5 | 0 | 0 | 638 |
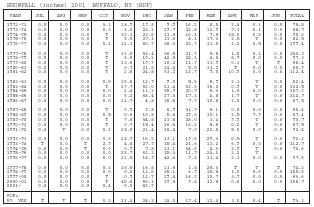
| SNOWFALL (inches) 2001 BUFFALO, NY (BUF) | |||||||||||||
| YEAR | JUL | AUG | SEP | OCT | NOV | DEC | JAN | FEB | MAR | APR | MAY | JUN | TOTAL |
| 1972-73 | 0.0 | 0.0 | 0.0 | 3.1 | 18.9 | 19.8 | 9.9 | 16.1 | 8.5 | 2.4 | 0.1 | 0.0 | 78.8 |
| 1973-74 | 0.0 | 0.0 | 0.0 | 0.0 | 3.0 | 23.1 | 19.7 | 22.8 | 12.9 | 7.1 | 0.1 | 0.0 | 88.7 |
| 1974-75 | 0.0 | 0.0 | 0.0 | T | 22.1 | 23.6 | 11.0 | 16.3 | 7.6 | 15.0 | 0.0 | 0.0 | 95.6 |
| 1975-76 | 0.0 | 0.0 | 0.0 | T | 5.5 | 27.3 | 21.6 | 8.3 | 17.3 | 2.5 | T | 0.0 | 82.5 |
| 1976-77 | 0.0 | 0.0 | 0.0 | 0.2 | 31.3 | 60.7 | 68.3 | 22.7 | 13.5 | 2.2 | 0.5 | 0.0 | 199.4 |
| 1977-78 | 0.0 | 0.0 | 0.0 | T | 15.0 | 53.4 | 56.5 | 21.7 | 5.8 | 1.8 | 0.1 | 0.0 | 154.3 |
| 1978-79 | 0.0 | 0.0 | 0.0 | T | 3.0 | 10.1 | 42.6 | 28.3 | 4.6 | 8.7 | 0.0 | 0.0 | 97.3 |
| 1979-80 | 0.0 | 0.0 | 0.0 | T | 12.6 | 19.7 | 10.2 | 11.7 | 13.9 | 0.3 | T | T | 68.4 |
| 1980-81 | 0.0 | 0.0 | 0.0 | T | 6.7 | 21.6 | 14.4 | 5.0 | 13.2 | T | 0.0 | 0.0 | 60.9 |
| 1981-82 | 0.0 | 0.0 | 0.0 | T | 1.8 | 24.8 | 53.2 | 12.7 | 9.0 | 10.9 | 0.0 | 0.0 | 112.4 |
| 1982-83 | 0.0 | 0.0 | 0.0 | 0.0 | 15.8 | 12.9 | 9.0 | 5.5 | 6.9 | 2.3 | T | 0.0 | 52.4 |
| 1983-84 | 0.0 | 0.0 | 0.0 | T | 17.7 | 52.0 | 13.4 | 32.5 | 16.0 | 0.9 | T | 0.0 | 132.5 |
| 1984-85 | 0.0 | 0.0 | 0.0 | 0.0 | 1.4 | 11.2 | 65.9 | 20.9 | 6.3 | 1.5 | 0.0 | 0.0 | 107.2 |
| 1985-86 | 0.0 | 0.0 | 0.0 | 0.0 | 5.2 | 68.4 | 17.3 | 17.3 | 4.8 | 1.7 | T | 0.0 | 114.7 |
| 1986-87 | 0.0 | 0.0 | 0.0 | 0.0 | 13.7 | 4.8 | 28.5 | 7.7 | 10.8 | 2.0 | 0.0 | 0.0 | 67.5 |
| 1987-88 | 0.0 | 0.0 | 0.0 | T | 0.9 | 9.8 | 6.9 | 31.9 | 6.1 | 0.8 | 0.0 | 0.0 | 56.4 |
| 1988-89 | 0.0 | 0.0 | 0.0 | 0.5 | 0.6 | 10.8 | 5.4 | 29.6 | 10.1 | 2.5 | 7.9 | 0.0 | 67.4 |
| 1989-90 | 0.0 | 0.0 | 0.0 | T | 7.8 | 34.8 | 11.8 | 28.0 | 1.4 | 9.9 | T | 0.0 | 93.7 |
| 1990-91 | 0.0 | 0.0 | 0.0 | T | 0.7 | 15.4 | 16.6 | 16.1 | 8.5 | 0.2 | T | 0.0 | 57.5 |
| 1991-92 | 0.0 | T | 0.0 | 0.2 | 18.0 | 21.4 | 18.4 | 7.0 | 22.8 | 5.0 | 0.0 | 0.0 | 92.8 |
| 1992-93 | 0.0 | 0.0 | 0.0 | 0.6 | 13.7 | 16.5 | 13.1 | 19.5 | 29.3 | 0.5 | T | 0.0 | 93.2 |
| 1993-94 | T | 0.0 | T | 2.9 | 4.8 | 27.9 | 35.4 | 21.6 | 13.2 | 6.9 | 0.0 | 0.0 | 112.7 |
| 1994-95 | 0.0 | 0.0 | T | 0.0 | 0.9 | 7.8 | 23.1 | 34.6 | 4.3 | 3.9 | T | 0.0 | 74.6 |
| 1995-96 | 0.0 | 0.0 | 0.0 | 0.0 | 15.7 | 61.2 | 25.3 | 11.9 | 24.1 | 3.2 | T | ||
| 1996-97 | 0.0 | 0.0 | 0.0 | 0.0 | 11.5 | 18.9 | 42.4 | 9.3 | 13.4 | 2.1 | 0.0 | 0.0 | 97.6 |
| 1997-98 | 0.0 | 0.0 | 0.0 | 0.2 | 16.5 | 16.8 | 13.6 | 1.8 | 25.3 | T | T | T | 74.2 |
| 1998-99 | 0.0 | 0.0 | 0.0 | 0.0 | 0.2 | 11.6 | 65.1 | 6.9 | 15.8 | 1.0 | 0.0 | 0.0 | 100.6 |
| 1999-00 | 0.0 | 0.0 | 0.0 | T | 0.9 | 12.7 | 19.4 | 16.2 | 10.7 | 3.7 | 0.0 | 0.0 | 63.6 |
| 2000-01 | 0.0 | 0.0 | 0.0 | T | 45.6 | 50.3 | 19.6 | 9.8 | 32.8 | 0.6 | 0.0 | 0.0 | 158.7 |
| 2001- | 0.0 | 0.0 | 0.0 | 0.4 | 0.0 | 82.7 | |||||||
| POR=57 YRS | T | T | T | 0.3 | 11.4 | 24.2 | 24.0 | 17.4 | 12.4 | 3.0 | 0.4 | T | 93.1 |
Comment about this article, ask questions, or add new information about this topic: