2001 SPOKANE WASHINGTON (GEG)
Spokane lies on the eastern edge of the broad Columbia Basin area of Washington which is bounded by the Cascade Range on the west and the Rocky Mountains on the east. The elevations in eastern Washington vary from less than 400 feet above sea level near Pasco where the Columbia River flows out of Washington to over 5,000 feet in the mountain areas of the extreme eastern edge of the State. Spokane is located on the upper plateau area where the long gradual slope from the Columbia River meets the sharp rise of the Rocky Mountain Ranges.
Much of the urban area of Spokane lies along both sides of the Spokane River at an elevation of approximately 2,000 feet, but the residential areas have spread to the crests of the plateaus on either side of the river with elevations up to 2,500 feet above sea level. Spokane International Airport is situated on the plateau area 6 miles west–southwest and some 400 feet higher than the downtown business district.
The climate of Spokane combines some of the characteristics of damp coastal type weather and arid interior conditions. Most of the air masses which reach Spokane are brought in by the prevailing westerly and southwesterly circulations. Frequently, much of the moisture in the storms that move eastward and southeastward from the Gulf of Alaska and the eastern Pacific Ocean is precipitated out as the storms are lifted across the Coast and Cascade Ranges. Annual precipitation totals in the Spokane area are generally less than 20 inches and less than 50 percent of the amounts received west of the Cascades. However, the precipitation and total cloudiness in the Spokane vicinity is greater than that of the desert areas of south–central Washington. The lifting action of the air masses as they move up the east slope of the Columbia Basin frequently produces the cooling and condensation necessary for formation of clouds and precipitation.
Infrequently, the Spokane area comes under the influence of dry continental air masses from the north or east. On occasions when these air masses penetrate into eastern Washington the result is high temperatures and very low humidity in the summer and sub–zero temperatures in the winter. In the winter most of the severe arctic outbursts of cold air move southward on the east side of the Continental Divide and do not affect Spokane.
In general, Spokane weather has the characteristics of a mild, arid climate during the summer months and a cold, coastal type in the winter. Approximately 70 percent of the total annual precipitation falls between the first of October and the end of March and about half of that falls as snow. The growing season usually extends over nearly six months from mid–April to mid–October. Irrigation is required for all crops except dry–land type grains. The summer weather is ideal for full enjoyment of the many mountain and lake recreational areas in the immediate vicinity. Winter weather includes many cloudy or foggy days and below freezing temperatures with occasional snowfall of several inches in depth. Sub–zero temperatures and traffic–stopping snowfalls are infrequent.
Based on the 1951–1980 period, the average first occurrence of 32 degrees Fahrenheit in the fall is October 6 and the average last occurrence in the spring is May 4.
NORMALS, MEANS, AND EXTREMES
SPOKANE, WA (GEG)
LATITUDE: LONGITUDE: ELEVATION (FT): TIME ZONE: WBAN: 24157
47 37′ 17″ N 117 31′ 40″ W GRND: 2381 BARO: 2384 PACIFIC (UTC + 8)
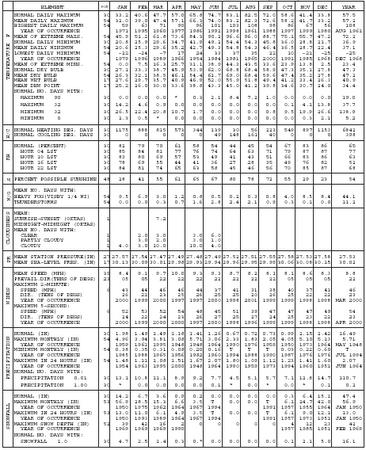
| ELEMENT | PRO | JAN | FEB | MAR | APR | MAY | JUN | JUL | AUG | SEP | OCT | NOV | DEC | YEAR | |
| TEMPERATURE F | NORMAL DAILY MAXIMUM | 30 | 33.2 | 40.6 | 47.7 | 57.0 | 65.8 | 74.7 | 83.1 | 82.5 | 72.0 | 58.6 | 41.4 | 33.8 | 57.5 |
| MEAN DAILY MAXIMUM | 54 | 32.0 | 39.0 | 47.4 | 57.1 | 66.3 | 74.0 | 83.2 | 82.3 | 72.6 | 58.2 | 41.7 | 33.2 | 57.2 | |
| HIGHEST DAILY MAXIMUM | 54 | 59 | 63 | 71 | 90 | 96 | 101 | 103 | 108 | 98 | 86 | 67 | 56 | 108 | |
| YEAR OF OCCURRENCE | 1971 | 1995 | 1960 | 1977 | 1986 | 1992 | 1998 | 1961 | 1988 | 1997 | 1999 | 1980 | AUG 1961 | ||
| MEAN OF EXTREME MAXS. | 54 | 45.9 | 51.2 | 61.8 | 73.6 | 84.3 | 90.2 | 96.6 | 96.0 | 88.7 | 75.1 | 55.7 | 47.2 | 72.2 | |
| NORMAL DAILY MINIMUM | 30 | 20.8 | 25.9 | 29.6 | 34.7 | 41.9 | 49.2 | 54.4 | 54.3 | 45.8 | 36.0 | 28.8 | 21.7 | 36.9 | |
| MEAN DAILY MINIMUM | 54 | 20.6 | 25.3 | 29.6 | 35.2 | 42.7 | 49.3 | 54.8 | 54.3 | 46.4 | 36.5 | 28.7 | 22.4 | 37.1 | |
| LOWEST DAILY MINIMUM | 54 | -22 | -24 | -7 | 17 | 24 | 33 | 37 | 35 | 22 | 10 | -21 | -25 | -25 | |
| YEAR OF OCCURRENCE | 1979 | 1996 | 1989 | 1966 | 1954 | 1984 | 1981 | 1965 | 2000 | 1991 | 1985 | 1968 | DEC 1968 | ||
| MEAN OF EXTREME MINS. | 54 | 0.0 | 7.5 | 16.3 | 25.7 | 31.1 | 38.9 | 44.3 | 43.5 | 33.6 | 23.9 | 13.8 | 2.5 | 23.4 | |
| NORMAL DRY BULB | 30 | 27.1 | 33.3 | 38.7 | 45.9 | 53.9 | 62.0 | 68.8 | 68.4 | 58.9 | 47.3 | 35.1 | 27.8 | 47.3 | |
| MEAN DRY BULB | 54 | 26.3 | 32.1 | 38.5 | 46.1 | 54.4 | 61.7 | 69.0 | 68.4 | 59.6 | 47.4 | 35.2 | 27.8 | 47.2 | |
| MEAN WET BULB | 17 | 27.6 | 29.7 | 35.7 | 40.9 | 46.9 | 52.0 | 55.9 | 51.8 | 49.4 | 41.2 | 33.4 | 26.3 | 40.9 | |
| MEAN DEW POINT | 17 | 25.2 | 26.0 | 30.0 | 33.6 | 38.8 | 43.3 | 45.0 | 41.2 | 39.8 | 34.6 | 30.7 | 24.0 | 34.4 | |
| NORMAL NO. DAYS WITH: | |||||||||||||||
| MAXIMUM 90 | 30 | 0.0 | 0.0 | 0.0 | * | 0.3 | 2.1 | 8.4 | 7.2 | 1.0 | 0.0 | 0.0 | 0.0 | 19.0 | |
| MAXIMUM 32 | 30 | 14.2 | 4.6 | 0.9 | 0.0 | 0.0 | 0.0 | 0.0 | 0.0 | 0.0 | 0.1 | 4.1 | 13.8 | 37.7 | |
| MINIMUM 32 | 30 | 26.5 | 22.4 | 20.8 | 10.7 | 1.7 | 0.0 | 0.0 | 0.0 | 0.8 | 9.5 | 19.9 | 26.6 | 138.9 | |
| MINIMUM 0 | 30 | 2.3 | 0.5 | * | 0.0 | 0.0 | 0.0 | 0.0 | 0.0 | 0.0 | 0.0 | 0.3 | 2.1 | 5.2 | |
| H/C | NORMAL HEATING DEG. DAYS | 30 | 1175 | 888 | 815 | 573 | 344 | 139 | 30 | 56 | 223 | 549 | 897 | 1153 | 6842 |
| NORMAL COOLING DEG. DAYS | 30 | 0 | 0 | 0 | 0 | 0 | 49 | 148 | 161 | 40 | 0 | 0 | 0 | 398 | |
| RH | NORMAL (PERCENT) | 30 | 82 | 79 | 70 | 61 | 58 | 54 | 44 | 45 | 54 | 67 | 83 | 86 | 65 |
| HOUR 04 LST | 30 | 85 | 84 | 81 | 77 | 76 | 74 | 64 | 63 | 71 | 79 | 87 | 87 | 77 | |
| HOUR 10 LST | 30 | 83 | 80 | 69 | 57 | 53 | 49 | 41 | 43 | 51 | 66 | 83 | 86 | 63 | |
| HOUR 16 LST | 30 | 78 | 69 | 55 | 44 | 41 | 36 | 27 | 28 | 35 | 49 | 76 | 82 | 52 | |
| HOUR 22 LST | 30 | 84 | 81 | 74 | 65 | 63 | 58 | 45 | 46 | 56 | 70 | 85 | 87 | 68 | |
| S | PERCENT POSSIBLE SUNSHINE | 48 | 28 | 41 | 55 | 61 | 65 | 67 | 80 | 78 | 72 | 55 | 29 | 23 | 54 |
| W/O | MEAN NO. DAYS WITH: | ||||||||||||||
| HEAVY FOG(VISBY 1/4 MI) | 54 | 9.5 | 6.9 | 3.0 | 1.2 | 0.8 | 0.5 | 0.2 | 0.3 | 0.8 | 4.0 | 8.5 | 8.4 | 44.1 | |
| THUNDERSTORMS | 54 | 0.0 | 0.0 | 0.3 | 0.7 | 1.6 | 2.8 | 2.4 | 2.1 | 0.9 | 0.3 | 0.1 | 0.0 | 11.2 | |
| CLOUDINESS | MEAN: | ||||||||||||||
| SUNRISE-SUNSET (OKTAS) | 1 | 7.2 | |||||||||||||
| MIDNIGHT-MIDNIGHT (OKTAS) | |||||||||||||||
| MEAN NO. DAYS WITH: | |||||||||||||||
| CLEAR | 1 | 2.0 | 3.0 | 3.0 | 6.0 | ||||||||||
| PARTLY CLOUDY | 1 | 3.0 | 2.0 | 3.0 | 1.0 | ||||||||||
| CLOUDY | 1 | 4.0 | 3.0 | 10.0 | 10.0 | 4.0 | |||||||||
| PR | MEAN STATION PRESSURE(IN) | 27 | 27.57 | 27.54 | 27.47 | 27.49 | 27.48 | 27.49 | 27.52 | 27.51 | 27.55 | 27.58 | 27.53 | 27.58 | 27.53 |
| MEAN SEA-LEVEL PRES. (IN) | 17 | 30.13 | 30.09 | 30.01 | 29.98 | 29.93 | 29.94 | 29.96 | 29.95 | 29.99 | 30.06 | 30.08 | 30.15 | 30.02 | |
| WINDS | MEAN SPEED (MPH) | 39 | 8.4 | 9.1 | 9.7 | 10.0 | 9.3 | 9.3 | 8.7 | 8.2 | 8.1 | 8.1 | 8.6 | 8.3 | 8.8 |
| PREVAIL. DIR (TENS OF DEGS) | 23 | 05 | 05 | 22 | 22 | 22 | 22 | 22 | 22 | 22 | 05 | 05 | 05 | 22 | |
| MAXIMUM 2-MINUTE: | |||||||||||||||
| SPEED (MPH) | 6 | 43 | 44 | 46 | 46 | 44 | 37 | 41 | 31 | 38 | 40 | 37 | 41 | 46 | |
| DIR. (TENS OF DEGS) | 26 | 21 | 23 | 25 | 26 | 25 | 25 | 20 | 26 | 25 | 22 | 22 | 23 | ||
| YEAR OF OCCURRENCE | 2000 | 1999 | 2000 | 1997 | 1997 | 2000 | 1998 | 2001 | 1999 | 1999 | 1998 | 1998 | MAR 2000 | ||
| MAXIMUM 5-SECOND: | |||||||||||||||
| SPEED (MPH) | 6 | 52 | 53 | 52 | 54 | 48 | 45 | 51 | 39 | 47 | 47 | 47 | 49 | 54 | |
| DIR. (TENS OF DEGS) | 24 | 22 | 24 | 23 | 26 | 27 | 25 | 27 | 24 | 25 | 23 | 22 | 23 | ||
| YEAR OF OCCURRENCE | 2000 | 1999 | 2000 | 2000 | 1997 | 2000 | 1998 | 1996 | 1999 | 1999 | 1998 | 1998 | APR 2000 | ||
| PRECIPITATION | NORMAL (IN) | 30 | 1.98 | 1.49 | 1.49 | 1.18 | 1.41 | 1.26 | 0.67 | 0.72 | 0.73 | 0.99 | 2.15 | 2.42 | 16.49 |
| MAXIMUM MONTHLY (IN) | 54 | 4.96 | 3.94 | 3.81 | 3.08 | 5.71 | 3.06 | 2.33 | 1.83 | 2.05 | 4.05 | 5.10 | 5.13 | 5.71 | |
| YEAR OF OCCURRENCE | 1959 | 1961 | 1995 | 1948 | 1948 | 1964 | 1990 | 1976 | 1959 | 1950 | 1973 | 1964 | MAY 1948 | ||
| MINIMUM MONTHLY (IN) | 54 | 0.38 | 0.35 | 0.31 | 0.08 | 0.20 | 0.16 | T | T | T | 0.03 | 0.22 | 0.60 | T | |
| YEAR OF OCCURRENCE | 1985 | 1988 | 1965 | 1956 | 1982 | 1960 | 1994 | 1988 | 1990 | 1987 | 1976 | 1976 | JUL 1994 | ||
| MAXIMUM IN 24 HOURS (IN) | 54 | 1.48 | 1.11 | 1.08 | 1.51 | 1.67 | 2.07 | 1.80 | 1.09 | 1.12 | 1.23 | 1.41 | 1.60 | 2.07 | |
| YEAR OF OCCURRENCE | 1954 | 1963 | 1995 | 2000 | 1948 | 1964 | 1990 | 1959 | 1973 | 1994 | 1960 | 1951 | JUN 1964 | ||
| NORMAL NO. DAYS WITH: | |||||||||||||||
| PRECIPITATION 0.01 | 30 | 13.1 | 10.8 | 11.1 | 8.9 | 9.2 | 7.7 | 4.5 | 5.1 | 5.7 | 7.1 | 12.8 | 14.7 | 110.7 | |
| PRECIPITATION 1.00 | 30 | * | 0.0 | 0.0 | 0.0 | 0.0 | 0.1 | * | 0.0 | * | 0.0 | * | 0.1 | 0.2 | |
| SNOWFALL | NORMAL (IN) | 30 | 14.2 | 6.7 | 3.6 | 0.9 | 0.2 | 0.0 | 0.0 | 0.0 | 0.0 | 0.3 | 6.4 | 15.1 | 47.4 |
| MAXIMUM MONTHLY (IN) | 53 | 56.9 | 28.5 | 15.3 | 6.6 | 3.5 | T | 0.0 | 0.0 | T | 6.1 | 24.7 | 42.0 | 56.9 | |
| YEAR OF OCCURRENCE | 1950 | 1975 | 1962 | 1964 | 1967 | 1994 | 1991 | 1957 | 1955 | 1964 | JAN 1950 | ||||
| MAXIMUM IN 24 HOURS (IN) | 53 | 13.0 | 11.0 | 6.1 | 4.9 | 3.5 | T | 0.0 | 0.0 | T | 6.1 | 9.0 | 12.1 | 13.0 | |
| YEAR OF OCCURRENCE | 1950 | 1993 | 1989 | 1964 | 1967 | 1994 | 1991 | 1957 | 1973 | 1951 | JAN 1950 | ||||
| MAXIMUM SNOW DEPTH (IN) | 52 | 39 | 42 | 16 | 2 | 0 | 0 | 0 | 0 | 0 | 4 | 12 | 23 | 42 | |
| YEAR OF OCCURRENCE | 1969 | 1969 | 1969 | 1990 | 1957 | 1985 | 1951 | FEB 1969 | |||||||
| NORMAL NO. DAYS WITH: | |||||||||||||||
| SNOWFALL 1.0 | 30 | 4.7 | 2.5 | 1.4 | 0.3 | 0.* | 0.0 | 0.0 | 0.0 | 0.0 | 0.1 | 2.1 | 5.0 | 16.1 |
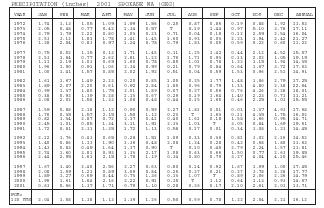
| PRECIPITATION (inches) 2001 SPOKANE WA (GEG) | |||||||||||||
| YEAR | JAN | FEB | MAR | APR | MAY | JUN | JUL | AUG | SEP | OCT | NOV | DEC | ANNUAL |
| 1972 | 1.74 | 1.13 | 1.05 | 1.09 | 1.99 | 1.56 | 0.25 | 0.87 | 0.86 | 0.19 | 0.88 | 1.92 | 13.53 |
| 1973 | 2.05 | 0.48 | 0.77 | 0.42 | 1.34 | 0.57 | T | 0.19 | 1.44 | 0.97 | 5.10 | 3.78 | 17.11 |
| 1974 | 3.79 | 1.79 | 2.22 | 0.80 | 1.03 | 0.23 | 0.71 | 0.04 | 0.18 | 0.12 | 2.59 | 2.54 | 16.04 |
| 1975 | 2.53 | 3.12 | 1.83 | 1.78 | 1.41 | 1.45 | 1.60 | 0.93 | 0.03 | 2.23 | 1.94 | 2.42 | 21.27 |
| 1976 | 1.28 | 2.04 | 0.83 | 0.97 | 1.24 | 0.78 | 0.79 | 1.83 | 0.05 | 0.59 | 0.22 | 0.60 | 11.22 |
| 1977 | 0.75 | 0.52 | 1.15 | 0.13 | 1.71 | 1.45 | 0.11 | 1.25 | 1.42 | 0.44 | 2.12 | 4.52 | 15.57 |
| 1978 | 2.53 | 1.64 | 0.77 | 2.62 | 2.81 | 1.22 | 1.76 | 1.71 | 0.93 | 0.13 | 2.02 | 1.05 | 19.19 |
| 1979 | 1.11 | 2.19 | 1.03 | 0.69 | 1.60 | 0.78 | 0.85 | 1.01 | 0.78 | 1.22 | 1.15 | 1.94 | 14.35 |
| 1980 | 1.96 | 1.90 | 0.91 | 1.06 | 2.34 | 0.99 | 0.21 | 0.79 | 0.84 | 0.64 | 1.67 | 3.72 | 17.03 |
| 1981 | 1.00 | 1.41 | 1.57 | 0.85 | 2.02 | 1.92 | 0.51 | 0.04 | 0.59 | 1.53 | 0.96 | 2.51 | 14.91 |
| 1982 | 1.61 | 1.67 | 1.49 | 2.23 | 0.20 | 0.85 | 1.05 | 0.25 | 1.77 | 1.48 | 1.86 | 2.79 | 17.25 |
| 1983 | 1.89 | 2.07 | 2.20 | 0.61 | 0.92 | 2.84 | 1.85 | 0.96 | 0.79 | 1.33 | 4.80 | 2.38 | 22.64 |
| 1984 | 0.99 | 1.37 | 1.80 | 1.75 | 2.01 | 1.89 | 0.07 | 0.27 | 0.56 | 0.76 | 4.26 | 2.28 | 18.01 |
| 1985 | 0.38 | 0.93 | 1.39 | 0.28 | 1.13 | 0.67 | 0.26 | 0.19 | 1.64 | 1.40 | 2.23 | 0.71 | 11.21 |
| 1986 | 3.08 | 2.02 | 1.58 | 1.33 | 1.08 | 0.48 | 0.44 | 0.15 | 1.65 | 0.46 | 2.25 | 1.03 | 15.55 |
| 1987 | 1.59 | 0.88 | 2.18 | 1.12 | 0.90 | 0.59 | 2.27 | 1.81 | 0.01 | 0.03 | 1.37 | 4.93 | 17.68 |
| 1988 | 1.76 | 0.35 | 1.57 | 2.15 | 1.50 | 1.12 | 0.23 | T | 1.63 | 0.11 | 4.35 | 1.75 | 16.52 |
| 1989 | 0.82 | 1.34 | 2.87 | 0.72 | 2.17 | 0.41 | 0.40 | 1.61 | 0.18 | 1.58 | 1.66 | 0.95 | 14.71 |
| 1990 | 2.45 | 1.01 | 0.85 | 1.34 | 3.11 | 1.91 | 2.33 | 1.03 | T | 3.05 | 0.84 | 1.69 | 19.61 |
| 1991 | 1.72 | 0.81 | 2.31 | 1.35 | 1.72 | 1.13 | 0.58 | 0.17 | 0.01 | 0.34 | 3.08 | 1.23 | 14.45 |
| 1992 | 2.12 | 1.76 | 0.43 | 0.65 | 0.28 | 1.51 | 1.09 | 0.33 | 0.36 | 0.81 | 3.02 | 2.16 | 14.52 |
| 1993 | 1.40 | 0.86 | 1.13 | 1.90 | 1.36 | 0.48 | 2.08 | 1.24 | 0.28 | 0.42 | 0.68 | 1.80 | 13.63 |
| 1994 | 1.43 | 0.83 | 0.49 | 1.64 | 1.37 | 0.90 | T | 0.10 | 0.45 | 2.79 | 2.24 | 1.57 | 13.81 |
| 1995 | 2.74 | 1.60 | 3.81 | 0.93 | 1.33 | 2.17 | 1.08 | 0.63 | 0.66 | 1.50 | 0.77 | 2.63 | 19.85 |
| 1996 | 2.44 | 2.95 | 1.61 | 2.15 | 1.78 | 1.19 | 0.34 | 0.80 | 0.79 | 3.27 | 4.04 | 4.10 | 25.46 |
| 1997 | 1.67 | 1.40 | 2.40 | 2.56 | 2.27 | 0.63 | 0.80 | 0.14 | 0.92 | 1.67 | 1.99 | 1.00 | 17.45 |
| 1998 | 2.08 | 1.59 | 1.21 | 0.89 | 3.09 | 0.84 | 0.26 | 0.27 | 0.21 | 0.27 | 3.78 | 3.28 | 17.77 |
| 1999 | 1.89 | 3.27 | 0.69 | 0.44 | 0.73 | 1.36 | 0.13 | 1.07 | T | 0.89 | 2.06 | 2.26 | 14.79 |
| 2000 | 1.96 | 1.61 | 1.64 | 2.16 | 2.22 | 0.91 | 0.35 | T | 1.12 | 0.64 | 1.13 | 0.93 | 14.67 |
| 2001 | 0.63 | 0.66 | 1.37 | 1.71 | 0.79 | 1.10 | 0.28 | 0.26 | 0.17 | 2.10 | 2.61 | 2.03 | 13.71 |
| POR=120 YRS | 2.04 | 1.58 | 1.38 | 1.13 | 1.39 | 1.26 | 0.50 | 0.59 | 0.78 | 1.22 | 2.04 | 2.21 | 16.12 |
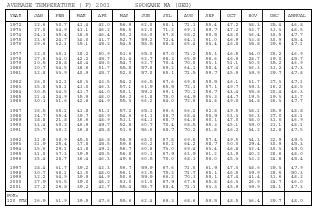
| AVERAGE TEMPERATURE (F) 2001 SPOKANE WA (GEG) | |||||||||||||
| YEAR | JAN | FEB | MAR | APR | MAY | JUN | JUL | AUG | SEP | OCT | NOV | DEC | ANNUAL |
| 1972 | 22.6 | 30.7 | 41.4 | 42.0 | 56.9 | 62.0 | 68.1 | 71.1 | 55.4 | 47.2 | 38.3 | 25.4 | 46.8 |
| 1973 | 27.0 | 34.9 | 41.1 | 46.2 | 56.5 | 62.0 | 71.2 | 69.1 | 59.7 | 47.2 | 33.7 | 33.3 | 48.5 |
| 1974 | 24.1 | 35.4 | 38.5 | 46.4 | 50.2 | 66.0 | 67.8 | 68.2 | 60.5 | 48.0 | 36.4 | 30.5 | 47.7 |
| 1975 | 23.6 | 24.7 | 34.0 | 41.7 | 52.7 | 59.2 | 72.4 | 64.1 | 61.0 | 46.9 | 33.8 | 30.9 | 45.4 |
| 1976 | 29.6 | 32.1 | 35.1 | 45.2 | 54.5 | 58.5 | 68.8 | 65.4 | 63.4 | 46.8 | 35.8 | 29.6 | 47.1 |
| 1977 | 22.0 | 35.1 | 38.2 | 50.9 | 51.6 | 65.0 | 67.0 | 71.2 | 55.1 | 46.5 | 34.0 | 26.2 | 46.9 |
| 1978 | 27.6 | 34.0 | 42.2 | 45.7 | 51.4 | 62.7 | 68.3 | 65.9 | 56.6 | 46.6 | 28.7 | 19.0 | 45.7 |
| 1979 | 10.5 | 28.8 | 40.4 | 45.5 | 54.7 | 62.7 | 70.4 | 70.0 | 63.1 | 51.1 | 30.5 | 35.2 | 46.9 |
| 1980 | 20.7 | 34.5 | 38.6 | 51.7 | 55.8 | 57.8 | 69.2 | 64.1 | 58.4 | 47.4 | 36.3 | 33.2 | 47.3 |
| 1981 | 32.8 | 33.9 | 40.9 | 45.7 | 52.0 | 57.0 | 65.1 | 71.5 | 59.7 | 45.9 | 39.9 | 29.7 | 47.8 |
| 1982 | 26.0 | 32.1 | 40.3 | 43.5 | 54.2 | 66.5 | 67.6 | 69.8 | 59.5 | 46.1 | 31.7 | 27.3 | 47.1 |
| 1983 | 35.8 | 38.1 | 43.0 | 46.3 | 57.1 | 61.9 | 65.5 | 72.3 | 57.1 | 49.7 | 39.3 | 16.2 | 48.5 |
| 1984 | 30.5 | 34.5 | 41.7 | 44.0 | 50.1 | 59.2 | 69.1 | 70.1 | 56.7 | 43.4 | 35.8 | 20.4 | 46.3 |
| 1985 | 21.4 | 24.9 | 35.9 | 48.0 | 56.2 | 61.8 | 75.0 | 64.9 | 53.3 | 44.7 | 19.5 | 19.3 | 43.7 |
| 1986 | 30.1 | 31.6 | 42.8 | 44.9 | 55.3 | 66.2 | 64.0 | 72.6 | 54.8 | 49.0 | 34.8 | 26.3 | 47.7 |
| 1987 | 26.5 | 35.1 | 41.8 | 51.1 | 57.2 | 65.1 | 66.6 | 66.2 | 62.8 | 49.5 | 38.1 | 25.9 | 48.8 |
| 1988 | 24.7 | 35.4 | 39.7 | 48.9 | 54.6 | 61.1 | 68.7 | 68.4 | 58.9 | 53.3 | 36.3 | 27.0 | 48.1 |
| 1989 | 28.8 | 21.8 | 36.6 | 48.9 | 53.1 | 64.3 | 68.7 | 64.8 | 60.1 | 47.0 | 38.0 | 31.0 | 46.9 |
| 1990 | 33.4 | 30.2 | 40.9 | 49.7 | 52.8 | 60.7 | 70.4 | 68.5 | 65.3 | 45.1 | 39.0 | 21.1 | 48.1 |
| 1991 | 25.7 | 39.2 | 36.8 | 45.8 | 51.6 | 56.6 | 68.7 | 70.2 | 61.8 | 46.2 | 34.2 | 32.8 | 47.5 |
| 1992 | 31.8 | 38.9 | 45.5 | 48.8 | 58.9 | 68.0 | 67.8 | 69.6 | 57.4 | 49.5 | 34.3 | 22.9 | 49.5 |
| 1993 | 21.9 | 25.4 | 37.8 | 45.5 | 59.8 | 60.2 | 60.2 | 64.2 | 58.7 | 50.0 | 29.4 | 30.9 | 45.3 |
| 1994 | 35.6 | 29.1 | 41.8 | 49.1 | 56.7 | 60.8 | 73.0 | 69.4 | 63.4 | 46.8 | 32.4 | 30.3 | 49.0 |
| 1995 | 31.0 | 37.3 | 39.9 | 45.5 | 56.8 | 60.1 | 67.9 | 63.9 | 61.2 | 43.9 | 40.2 | 28.6 | 48.0 |
| 1996 | 25.4 | 28.7 | 36.4 | 46.3 | 49.6 | 60.5 | 70.0 | 68.1 | 56.0 | 45.3 | 33.2 | 24.8 | 45.4 |
| 1997 | 28.4 | 31.7 | 39.2 | 43.3 | 56.7 | 59.9 | 67.6 | 71.0 | 61.9 | 47.3 | 38.6 | 29.3 | 47.9 |
| 1998 | 30.7 | 38.1 | 41.5 | 48.0 | 56.1 | 62.5 | 75.3 | 71.7 | 65.1 | 46.5 | 39.9 | 28.6 | 50.3 |
| 1999 | 32.2 | 34.9 | 39.9 | 44.9 | 50.6 | 59.9 | 66.2 | 70.3 | 59.1 | 47.4 | 41.4 | 31.6 | 48.2 |
| 2000 | 27.9 | 33.5 | 39.0 | 48.2 | 53.0 | 61.0 | 67.9 | 67.6 | 55.8 | 46.3 | 26.9 | 24.7 | 46.0 |
| 2001 | 27.2 | 26.8 | 39.2 | 43.7 | 55.4 | 58.7 | 68.4 | 71.1 | 63.3 | 45.9 | 39.9 | 28.1 | 47.3 |
| POR=120 YRS | 26.9 | 31.9 | 39.5 | 47.6 | 55.6 | 62.4 | 69.3 | 68.6 | 59.5 | 48.5 | 36.4 | 29.7 | 48.0 |
REFERENCE NOTES:
PAGE 1:
THE TEMPERATURE GRAPH SHOWS NORMAL MAXIMUM AND NORMAL MINIMUM DAILY TEMPERATURES (SOLID CURVES) AND THE ACTUAL DAILY HIGH AND LOW TEMPERATURES (VERTICAL BARS).
PAGE 2 AND 3:
H/C INDICATES HEATING AND COOLING DEGREE DAYS.
RH INDICATES RELATIVE HUMIDITY
W/O INDICATES WEATHER AND OBSTRUCTIONS
S INDICATES SUNSHINE.
PR INDICATES PRESSURE.
CLOUDINESS ON PAGE 3 IS THE SUM OF THE CEILOMETER AND SATELLITE DATA NOT TO EXCEED EIGHT EIGHTHS (OKTAS).
GENERAL:
T INDICATES TRACE PRECIPITATION, AN AMOUNT GREATER THAN ZERO BUT LESS THAN THE LOWEST REPORTABLE VALUE.
+ INDICATES THE VALUE ALSO OCCURS ON EARLIER DATES.
BLANK ENTRIES DENOTE MISSING OR UNREPORTED DATA.
NORMALS ARE 30–YEAR AVERAGES (1961–1990).
ASOS INDICATES AUTOMATED SURFACE OBSERVING SYSTEM.
PM INDICATES THE LAST DAY OF THE PREVIOUS MONTH.
POR (PERIOD OF RECORD) BEGINS WITH THE JANUARY DATA MONTH AND IS THE NUMBER OF YEARS USED TO COMPUTE THE MEAN. INDIVIDUAL MONTHS WITHIN THE POR MAY BE MISSING.
WHEN THE POR FOR A NORMAL IS LESS THAN 30 YEARS, THE NORMAL IS PROVISIONAL AND IS BASED ON THE NUMBER OF YEARS INDICATED.
0.* OR * INDICATES THE VALUE OR MEAN–DAYS–WITH IS BETWEEN 0.00 AND 0.05.
CLOUDINESS FOR ASOS STATIONS DIFFERS FROM THE NON–ASOS OBSERVATION TAKEN BY A HUMAN OBSERVER. ASOS STATION CLOUDINESS IS BASED ON TIME–AVERAGED CEILOMETER DATA FOR CLOUDS AT OR BELOW 12,000 FEET AND ON SATELLITE DATA FOR CLOUDS ABOVE 12,000 FEET.
THE NUMBER OF DAYS WITH CLEAR, PARTLY CLOUDY, AND CLOUDY CONDITIONS FOR ASOS STATIONS IS THE SUM OF THE CEILOMETER AND SATELLITE DATA FOR THE SUNRISE TO SUNSET PERIOD.
GENERAL CONTINUED:
CLEAR INDICATES 0–2 OKTAS, PARTLY CLOUDY INDICATES 3–6 OKTAS, AND CLOUDY INDICATES 7 OR 8 OKTAS. WHEN AT LEAST ONE OF THE ELEMENTS (CEILOMETER OR SATELLITE) IS MISSING, THE DAILY CLOUDINESS IS NOT COMPUTED.
WIND DIRECTION IS RECORDED IN TENS OF DEGREES (2 DIGITS) CLOCKWISE FROM TRUE NORTH. "00" INDICATES CALM. "36" INDICATES TRUE NORTH.
RESULTANT WIND IS THE VECTOR AVERAGE OF THE SPEED AND DIRECTION.
AVERAGE TEMPERATURE IS THE SUM OF THE MEAN DAILY MAXIMUM AND MINIMUM TEMPERATURE DIVIDED BY 2.
SNOWFALL DATA COMPRISE ALL FORMS OF FROZEN PRECIPITATION, INCLUDING HAIL.
A HEATING (COOLING) DEGREE DAY IS THE DIFFERENCE BETWEEN THE AVERAGE DAILY TEMPERATURE AND 65 F.
DRY BULB IS THE TEMPERATURE OF THE AMBIENT AIR.
DEW POINT IS THE TEMPERATURE TO WHICH THE AIR MUST BE COOLED TO ACHIEVE 100 PERCENT RELATIVE HUMIDITY.
WET BULB IS THE TEMPERATURE THE AIR WOULD HAVE IF THE MOISTURE CONTENT WAS INCREASED TO 100 PERCENT RELATIVE HUMIDITY.
ON JULY 1, 1996, THE NATIONAL WEATHER SERVICE BEGAN USING THE "METAR" OBSERVATION CODE THAT WAS ALREADY EMPLOYED BY MOST OTHER NATIONS OF THE WORLD. THE MOST NOTICEABLE DIFFERENCE IN THIS ANNUAL PUBLICATION WILL BE THE CHANGE IN UNITS FROM TENTHS TO EIGHTS (OKTAS) FOR REPORTING THE AMOUNT OF SKY COVER.
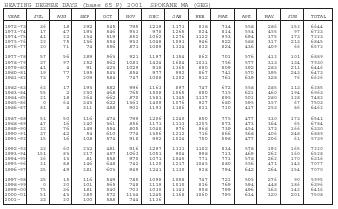
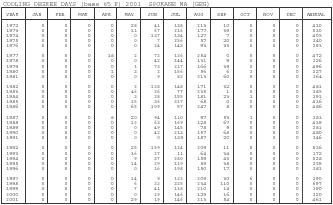
| HEATING DEGREE DAYS (base 65 F) 2001 SPOKANE WA (GEG) | |||||||||||||
| YEAR | JUL | AUG | SEP | OCT | NOV | DEC | JAN | FEB | MAR | APR | MAY | JUN | TOTAL |
| 1972-73 | 36 | 18 | 292 | 545 | 795 | 1219 | 1171 | 838 | 734 | 558 | 286 | 152 | 6644 |
| 1973-74 | 17 | 47 | 193 | 546 | 933 | 978 | 1265 | 824 | 814 | 554 | 455 | 97 | 6723 |
| 1974-75 | 41 | 22 | 134 | 519 | 852 | 1062 | 1276 | 1122 | 953 | 694 | 375 | 173 | 7223 |
| 1975-76 | 22 | 75 | 136 | 554 | 933 | 1048 | 1091 | 946 | 922 | 588 | 317 | 213 | 6845 |
| 1976-77 | 20 | 71 | 74 | 556 | 871 | 1089 | 1324 | 832 | 824 | 436 | 409 | 66 | 6572 |
| 1977-78 | 57 | 56 | 289 | 563 | 921 | 1197 | 1154 | 862 | 701 | 576 | 412 | 101 | 6889 |
| 1978-79 | 37 | 97 | 252 | 562 | 1083 | 1424 | 1684 | 1011 | 756 | 577 | 313 | 134 | 7930 |
| 1979-80 | 41 | 4 | 91 | 423 | 1029 | 918 | 1365 | 880 | 809 | 392 | 283 | 211 | 6446 |
| 1980-81 | 19 | 77 | 195 | 543 | 854 | 977 | 992 | 867 | 741 | 570 | 395 | 243 | 6473 |
| 1981-82 | 73 | 7 | 209 | 584 | 747 | 1088 | 1202 | 912 | 761 | 639 | 328 | 76 | 6626 |
| 1982-83 | 62 | 17 | 193 | 582 | 996 | 1163 | 897 | 747 | 672 | 558 | 285 | 113 | 6285 |
| 1983-84 | 55 | 2 | 230 | 468 | 765 | 1508 | 1065 | 880 | 715 | 621 | 460 | 194 | 6963 |
| 1984-85 | 21 | 18 | 264 | 662 | 870 | 1381 | 1345 | 1117 | 895 | 501 | 280 | 128 | 7482 |
| 1985-86 | 0 | 64 | 343 | 622 | 1363 | 1409 | 1076 | 927 | 680 | 595 | 357 | 67 | 7503 |
| 1986-87 | 81 | 4 | 311 | 488 | 902 | 1193 | 1186 | 831 | 710 | 417 | 253 | 86 | 6462 |
| 1987-88 | 51 | 50 | 116 | 474 | 799 | 1206 | 1240 | 850 | 775 | 477 | 330 | 173 | 6541 |
| 1988-89 | 47 | 16 | 240 | 361 | 856 | 1171 | 1113 | 1205 | 873 | 473 | 364 | 65 | 6784 |
| 1989-90 | 22 | 76 | 149 | 554 | 805 | 1048 | 976 | 968 | 739 | 454 | 373 | 166 | 6330 |
| 1990-91 | 37 | 42 | 54 | 610 | 774 | 1356 | 1212 | 716 | 866 | 568 | 406 | 248 | 6889 |
| 1991-92 | 15 | 16 | 108 | 574 | 918 | 992 | 1024 | 750 | 598 | 477 | 206 | 61 | 5739 |
| 1992-93 | 32 | 60 | 232 | 481 | 916 | 1297 | 1331 | 1102 | 834 | 578 | 192 | 165 | 7220 |
| 1993-94 | 151 | 83 | 217 | 457 | 1063 | 1051 | 904 | 998 | 713 | 469 | 262 | 160 | 6528 |
| 1994-95 | 26 | 13 | 81 | 558 | 970 | 1071 | 1045 | 771 | 771 | 578 | 262 | 170 | 6316 |
| 1995-96 | 21 | 88 | 146 | 648 | 742 | 1120 | 1217 | 1045 | 880 | 556 | 471 | 143 | 7077 |
| 1996-97 | 35 | 49 | 281 | 603 | 949 | 1241 | 1130 | 928 | 794 | 642 | 264 | 154 | 7070 |
| 1997-98 | 35 | 15 | 116 | 549 | 785 | 1098 | 1058 | 747 | 721 | 505 | 276 | 90 | 5995 |
| 1998-99 | 0 | 20 | 101 | 565 | 748 | 1119 | 1010 | 836 | 769 | 594 | 448 | 186 | 6396 |
| 1999-00 | 75 | 36 | 181 | 540 | 703 | 1030 | 1143 | 908 | 799 | 496 | 363 | 142 | 6416 |
| 2000-01 | 51 | 43 | 285 | 572 | 1134 | 1245 | 1168 | 1060 | 795 | 634 | 320 | 201 | 7508 |
| 2001- | 33 | 20 | 100 | 588 | 744 | 1136 | |||||||
| COOLING DEGREE DAYS (base 65 F) 2001 SPOKANE WA (GEG) | |||||||||||||
| YEAR | JAN | FEB | MAR | APR | MAY | JUN | JUL | AUG | SEP | OCT | NOV | DEC | ANNUAL |
| 1972 | 0 | 0 | 0 | 0 | 28 | 41 | 138 | 213 | 10 | 0 | 0 | 0 | 430 |
| 1973 | 0 | 0 | 0 | 0 | 31 | 67 | 216 | 177 | 39 | 0 | 0 | 0 | 530 |
| 1974 | 0 | 0 | 0 | 0 | 0 | 137 | 134 | 127 | 7 | 0 | 0 | 0 | 405 |
| 1975 | 0 | 0 | 0 | 0 | 0 | 7 | 256 | 57 | 20 | 0 | 0 | 0 | 340 |
| 1976 | 0 | 0 | 0 | 0 | 0 | 24 | 143 | 93 | 33 | 0 | 0 | 0 | 293 |
| 1977 | 0 | 0 | 0 | 18 | 2 | 72 | 126 | 254 | 0 | 0 | 0 | 0 | 472 |
| 1978 | 0 | 0 | 0 | 0 | 0 | 42 | 144 | 131 | 9 | 0 | 0 | 0 | 326 |
| 1979 | 0 | 0 | 0 | 0 | 1 | 73 | 217 | 166 | 39 | 0 | 0 | 0 | 496 |
| 1980 | 0 | 0 | 0 | 1 | 3 | 2 | 156 | 56 | 6 | 3 | 0 | 0 | 227 |
| 1981 | 0 | 0 | 0 | 0 | 0 | 9 | 82 | 213 | 60 | 0 | 0 | 0 | 364 |
| 1982 | 0 | 0 | 0 | 0 | 2 | 128 | 148 | 171 | 32 | 0 | 0 | 0 | 481 |
| 1983 | 0 | 0 | 0 | 0 | 46 | 26 | 77 | 235 | 1 | 0 | 0 | 0 | 385 |
| 1984 | 0 | 0 | 0 | 0 | 3 | 28 | 155 | 181 | 23 | 1 | 0 | 0 | 391 |
| 1985 | 0 | 0 | 0 | 0 | 15 | 36 | 317 | 68 | 0 | 0 | 0 | 0 | 436 |
| 1986 | 0 | 0 | 0 | 0 | 65 | 109 | 57 | 247 | 8 | 0 | 0 | 0 | 486 |
| 1987 | 0 | 0 | 0 | 8 | 20 | 94 | 110 | 97 | 53 | 1 | 0 | 0 | 383 |
| 1988 | 0 | 0 | 0 | 0 | 12 | 63 | 169 | 128 | 67 | 0 | 0 | 0 | 439 |
| 1989 | 0 | 0 | 0 | 0 | 0 | 49 | 145 | 78 | 9 | 0 | 0 | 0 | 281 |
| 1990 | 0 | 0 | 0 | 0 | 0 | 42 | 213 | 157 | 68 | 0 | 0 | 0 | 480 |
| 1991 | 0 | 0 | 0 | 0 | 0 | 0 | 139 | 187 | 20 | 0 | 0 | 0 | 346 |
| 1992 | 0 | 0 | 0 | 0 | 25 | 159 | 124 | 209 | 11 | 8 | 0 | 0 | 536 |
| 1993 | 0 | 0 | 0 | 0 | 36 | 27 | 11 | 64 | 34 | 0 | 0 | 0 | 172 |
| 1994 | 0 | 0 | 0 | 0 | 9 | 37 | 280 | 159 | 43 | 0 | 0 | 0 | 528 |
| 1995 | 0 | 0 | 0 | 0 | 14 | 29 | 119 | 59 | 38 | 0 | 0 | 0 | 259 |
| 1996 | 0 | 0 | 0 | 0 | 0 | 16 | 198 | 150 | 17 | 0 | 0 | 0 | 381 |
| 1997 | 0 | 0 | 0 | 0 | 14 | 9 | 122 | 209 | 30 | 6 | 0 | 0 | 390 |
| 1998 | 0 | 0 | 0 | 0 | 6 | 22 | 325 | 234 | 110 | 0 | 0 | 0 | 697 |
| 1999 | 0 | 0 | 0 | 0 | 7 | 41 | 118 | 210 | 14 | 0 | 0 | 0 | 390 |
| 2000 | 0 | 0 | 0 | 0 | 0 | 29 | 146 | 129 | 16 | 0 | 0 | 0 | 320 |
| 2001 | 0 | 0 | 0 | 0 | 29 | 19 | 146 | 213 | 54 | 0 | 0 | 0 | 461 |
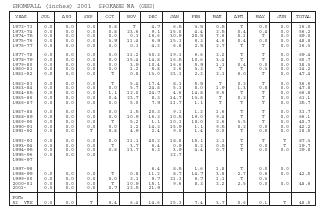
| SNOWFALL (inches) 2001 SPOKANE WA (GEG) | |||||||||||||
| YEAR | JUL | AUG | SEP | OCT | NOV | DEC | JAN | FEB | MAR | APR | MAY | JUN | TOTAL |
| 1972-73 | 0.0 | 0.0 | 0.0 | 0.8 | T | 4.7 | 6.5 | 3.5 | 0.5 | T | 0.0 | 0.0 | 16.0 |
| 1973-74 | 0.0 | 0.0 | 0.0 | 0.8 | 23.6 | 9.1 | 15.0 | 4.4 | 2.5 | 0.4 | 0.4 | 0.0 | 56.2 |
| 1974-75 | 0.0 | 0.0 | 0.0 | 0.0 | 0.3 | 16.6 | 30.9 | 28.5 | 7.6 | 5.1 | T | 0.0 | 89.0 |
| 1975-76 | 0.0 | 0.0 | 0.0 | 3.9 | 11.4 | 6.9 | 15.3 | 6.3 | 4.6 | 0.4 | 0.0 | 0.0 | 48.8 |
| 1976-77 | 0.0 | 0.0 | 0.0 | 0.0 | 0.1 | 4.2 | 6.8 | 2.5 | 2.7 | T | T | 0.0 | 16.3 |
| 1977-78 | 0.0 | 0.0 | 0.0 | 0.0 | 11.2 | 30.3 | 19.1 | 6.6 | 2.2 | T | T | 0.0 | 69.4 |
| 1978-79 | 0.0 | 0.0 | 0.0 | 0.0 | 15.4 | 14.8 | 16.5 | 10.6 | 3.4 | T | T | 0.0 | 60.7 |
| 1979-80 | 0.0 | 0.0 | 0.0 | 0.0 | 3.9 | 10.4 | 16.6 | 5.9 | 1.1 | 0.4 | 0.0 | 0.0 | 38.3 |
| 1980-81 | 0.0 | 0.0 | 0.0 | 0.0 | 1.2 | 6.8 | 2.6 | 3.3 | T | T | 0.3 | 0.0 | 14.2 |
| 1981-82 | 0.0 | 0.0 | 0.0 | T | 0.8 | 13.0 | 23.3 | 2.2 | 2.1 | 6.0 | T | 0.0 | 47.4 |
| 1982-83 | 0.0 | 0.0 | 0.0 | T | 5.4 | 17.4 | 8.1 | 5.5 | T | 0.2 | T | 0.0 | 36.6 |
| 1983-84 | 0.0 | 0.0 | 0.0 | 0.0 | 5.7 | 24.8 | 5.3 | 8.0 | 1.9 | 1.3 | 0.8 | 0.0 | 47.8 |
| 1984-85 | 0.0 | 0.0 | 0.0 | 1.1 | 12.0 | 24.7 | 4.6 | 14.8 | 9.6 | T | T | 0.0 | 66.8 |
| 1985-86 | 0.0 | 0.0 | 0.0 | 0.4 | 23.7 | 8.3 | 14.7 | 13.8 | T | 0.2 | T | 0.0 | 61.1 |
| 1986-87 | 0.0 | 0.0 | 0.0 | 0.0 | 5.0 | 7.9 | 11.7 | 1.1 | T | T | T | 0.0 | 25.7 |
| 1987-88 | 0.0 | 0.0 | 0.0 | 0.0 | 1.5 | 20.3 | 9.1 | 1.2 | 1.6 | T | T | 0.0 | 33.7 |
| 1988-89 | 0.0 | 0.0 | 0.0 | 0.0 | 10.9 | 16.3 | 10.5 | 19.0 | 9.4 | T | T | 0.0 | 66.1 |
| 1989-90 | 0.0 | 0.0 | 0.0 | T | 5.2 | 1.1 | 10.3 | 18.0 | 2.6 | 3.5 | T | 0.0 | 40.7 |
| 1990-91 | 0.0 | 0.0 | 0.0 | 0.0 | 1.2 | 14.3 | 15.9 | 1.1 | 9.5 | 0.2 | 0.0 | 0.0 | 42.2 |
| 1991-92 | 0.0 | 0.0 | T | 0.8 | 4.9 | 2.4 | 9.0 | 1.4 | 0.0 | T | 0.0 | 0.0 | 18.5 |
| 1992-93 | 0.0 | 0.0 | 0.0 | 0.0 | 11.1 | 40.2 | 18.8 | 15.1 | 2.1 | T | T | T | 87.3 |
| 1993-94 | 0.0 | 0.0 | 0.0 | T | 3.7 | 6.4 | 0.9 | 8.2 | 0.5 | T | 0.0 | T | 19.7 |
| 1994-95 | 0.0 | 0.0 | 0.0 | 0.8 | 13.7 | 6.3 | 3.9 | 4.4 | 0.7 | T | 0.0 | 0.0 | 29.8 |
| 1995-96 | 0.0 | 0.0 | 0.0 | 22.7 | |||||||||
| 1996-97 | |||||||||||||
| 1997-98 | 6.4 | 8.5 | 1.6 | 1.8 | T | 0.0 | 0.0 | ||||||
| 1998-99 | 0.0 | 0.0 | 0.0 | T | 0.8 | 11.2 | 8.7 | 14.7 | 3.8 | 2.7 | 0.6 | 0.0 | 42.5 |
| 1999-00 | 0.0 | 0.0 | 0.0 | 0.0 | 2.1 | 9.7 | 21.3 | 6.7 | 1.1 | T | 0.3 | ||
| 2000-01 | 0.0 | 0.0 | 0.0 | T | 10.9 | 15.1 | 9.6 | 8.3 | 2.2 | 2.5 | 0.0 | 0.0 | 48.6 |
| 2001- | 0.0 | 0.0 | 0.0 | 0.7 | 12.5 | 21.9 | |||||||
| POR=52 YRS | 0.0 | 0.0 | T | 0.4 | 6.4 | 14.6 | 15.3 | 7.4 | 3.7 | 0.6 | 0.1 | T | 48.5 |