2001 SEATTLE, WASHINGTON SEATTLE – TACOMA AIRPORT (SEA)
The Seattle–Tacoma International Airport is located 6 miles south of the Seattle city limits and 14 miles north of Tacoma. It is situated on a low ridge lying between Puget Sound on the west and the Green River valley on the east with terrain sloping moderately to the shores of Puget Sound some 2 miles to the west. The Olympic Mountains, rising sharply from Puget Sound, are about 50 miles to the northwest. Rather steep bluffs border the Green River Valley about 2.5 miles to the east and the foothills of the Cascade Range begin 10 to 15 miles to the east of the airport.
The mild climate of the Pacific Coast is modified by the Cascade Mountains and, to a lesser extent, by the Olympic Mountains. The climate is characterized by mild temperatures, a pronounced though not sharply defined rainy season, and considerable cloudiness, particularly during the winter months. The Cascades are very effective in shielding the Seattle–Tacoma area from the cold, dry continental air during the winter and the hot, dry continental air during the summer months. The extremes of temperature that occur in western Washington are the result of the occasional pressure distributions that force the continental air into the Puget Sound area. But the prevailing southwesterly circulation keeps the average winter daytime temperatures in the 40s and the nighttime readings in the 30s. During the summer, daytime temperatures are usually in the 70s with nighttime lows in the 50s. Extremes of temperatures, both in the winter and summer, are usually of short duration. The dry season is centered around July and early August with July being the driest month of the year. The rainy season extends from October to March with December normally the wettest month, however, precipitation is rather evenly distributed through the winter and early spring months with more than 75 percent of the yearly precipitation falling during the winter wet season. Most of the rainfall in the Seattle area comes from storms common to the middle latitudes. These disturbances are most vigorous during the winter as they move through western Washington. The storm track shifts to the north during the summer and those that reach the State are not the wind and rain producers of the winter months. Local summer afternoon showers and a few thunderstorms occur in the Seattle–Tacoma area but they do not contribute materially to the precipitation.
The occurrence of snow in the Seattle–Tacoma area is extremely variable and usually melts before accumulating measurable depths. There are winters on record with only a trace of snow, but at the other extreme, over 21 inches has fallen in a 24–hour period. Usually, winter storms do not produce snow unless the storm moves in such a way to bring cold air out of Canada directly or with only a short over water trajectory.
The highest winds recorded in the Seattle–Tacoma area were associated with strong storms crossing the state from the southwest. Prevailing winds are from the southwest but occasional severe winter storms will produce strong northerly winds. Winds during the summer months are relatively light with occasional land–sea breeze effects creating afternoon northerly winds of 8 to 15 miles an hour. Fog or low clouds that form over the southern Puget Sound area in the late summer, fall, and early winter months, often dominate the weather conditions during the late night and early morning hours with visibilities occasionally lower for a few hours near sunrise. Most of the summer clouds form along the coast and move into the Seattle area from the southwest.
Based on the 1951–1980 period, the average first occurrence of 32 degrees Fahrenheit in the fall is November 11 and the average last occurrence in the spring is March 24.
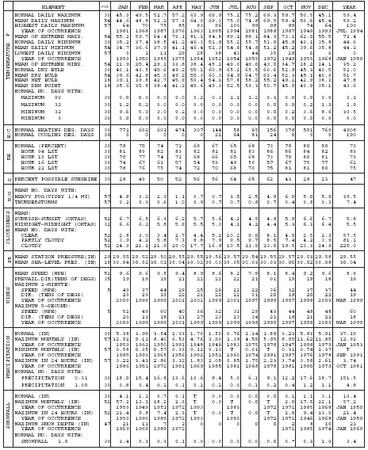
NORMALS, MEANS, AND EXTREMES
SEATTLE, WA (SEA)
LATITUDE: LONGITUDE: ELEVATION (FT): TIME ZONE: WBAN: 24233
47 27′ 41″ N 122 18′ 49″ W GRND: 447 BARO: 450 PACIFIC (UTC + 8)
| ELEMENT | POR | JAN | FEB | MAR | APR | MAY | JUN | JUL | AUG | SEP | OCT | NOV | DEC | YEAR | |
| TEMPERATURE F | NORMAL DAILY MAXIMUM | 30 | 45.0 | 49.5 | 52.7 | 57.2 | 63.9 | 69.9 | 75.2 | 75.2 | 69.3 | 59.7 | 50.5 | 45.1 | 59.4 |
| MEAN DAILY MAXIMUM | 54 | 44.6 | 48.8 | 52.2 | 57.3 | 64.0 | 69.3 | 75.0 | 74.8 | 69.5 | 59.4 | 50.6 | 45.4 | 59.2 | |
| HIGHEST DAILY MAXIMUM | 57 | 64 | 70 | 75 | 85 | 93 | 96 | 100 | 99 | 98 | 89 | 74 | 64 | 100 | |
| YEAR OF OCCURRENCE | 1981 | 1968 | 1987 | 1976 | 1963 | 1995 | 1994 | 1981 | 1988 | 1987 | 1949 | 1993 | JUL 1994 | ||
| MEAN OF EXTREME MAXS. | 54 | 55.2 | 59.7 | 64.4 | 73.1 | 81.1 | 84.8 | 89.1 | 88.1 | 84.3 | 73.1 | 61.0 | 55.5 | 72.4 | |
| NORMAL DAILY MINIMUM | 30 | 35.2 | 37.4 | 38.5 | 41.2 | 46.3 | 51.9 | 55.2 | 55.7 | 51.9 | 45.8 | 40.1 | 35.8 | 44.6 | |
| MEAN DAILY MINIMUM | 54 | 34.7 | 36.6 | 37.9 | 41.1 | 46.4 | 51.3 | 54.6 | 54.8 | 51.2 | 45.2 | 39.6 | 35.8 | 44.1 | |
| LOWEST DAILY MINIMUM | 57 | 0 | 1 | 11 | 29 | 28 | 38 | 43 | 44 | 35 | 28 | 6 | 6 | 0 | |
| YEAR OF OCCURRENCE | 1950 | 1950 | 1955 | 1975 | 1954 | 1952 | 1954 | 1955 | 1972 | 1949 | 1955 | 1968 | JAN 1950 | ||
| MEAN OF EXTREME MINS. | 54 | 21.9 | 25.4 | 29.2 | 33.8 | 38.4 | 45.2 | 49.0 | 49.0 | 43.0 | 34.7 | 28.2 | 24.1 | 35.2 | |
| NORMAL DRY BULB | 30 | 40.1 | 43.5 | 45.6 | 49.2 | 55.1 | 60.9 | 65.2 | 65.5 | 60.6 | 52.8 | 45.3 | 40.5 | 52.0 | |
| MEAN DRY BULB | 54 | 39.6 | 42.8 | 45.0 | 49.2 | 55.3 | 60.3 | 64.9 | 64.7 | 60.4 | 52.3 | 45.1 | 40.6 | 51.7 | |
| MEAN WET BULB | 18 | 39.1 | 39.8 | 42.7 | 45.9 | 50.4 | 54.1 | 57.8 | 58.2 | 55.2 | 49.1 | 42.9 | 38.3 | 47.8 | |
| MEAN DEW POINT | 18 | 35.6 | 35.5 | 38.4 | 41.2 | 45.6 | 49.3 | 52.5 | 53.3 | 50.7 | 45.9 | 40.0 | 35.1 | 43.6 | |
| NORMAL NO. DAYS WITH: | |||||||||||||||
| MAXIMUM 90 | 30 | 0.0 | 0.0 | 0.0 | 0.0 | 0.2 | 0.3 | 1.1 | 1.2 | 0.3 | 0.0 | 0.0 | 0.0 | 3.1 | |
| MAXIMUM 32 | 30 | 1.2 | 0.2 | 0.0 | 0.0 | 0.0 | 0.0 | 0.0 | 0.0 | 0.0 | 0.0 | 0.2 | 1.3 | 2.9 | |
| MINIMUM 32 | 30 | 9.6 | 5.3 | 3.0 | 0.2 | 0.0 | 0.0 | 0.0 | 0.0 | 0.0 | 0.2 | 3.6 | 8.6 | 30.5 | |
| MINIMUM 0 | 30 | 0.0 | 0.0 | 0.0 | 0.0 | 0.0 | 0.0 | 0.0 | 0.0 | 0.0 | 0.0 | 0.0 | 0.0 | 0.0 | |
| H/C | NORMAL HEATING DEG. DAYS | 30 | 772 | 602 | 601 | 474 | 307 | 144 | 58 | 65 | 156 | 378 | 591 | 760 | 4908 |
| NORMAL COOLING DEG. DAYS | 30 | 0 | 0 | 0 | 0 | 0 | 21 | 64 | 81 | 24 | 0 | 0 | 0 | 190 | |
| RH | NORMAL (PERCENT) | 30 | 78 | 75 | 74 | 71 | 69 | 67 | 65 | 68 | 73 | 79 | 80 | 80 | 73 |
| HOUR 04 LST | 30 | 81 | 80 | 82 | 83 | 82 | 81 | 81 | 83 | 86 | 86 | 84 | 82 | 83 | |
| HOUR 10 LST | 30 | 79 | 77 | 74 | 71 | 68 | 66 | 65 | 68 | 73 | 79 | 80 | 81 | 73 | |
| HOUR 16 LST | 30 | 74 | 67 | 61 | 57 | 54 | 53 | 49 | 50 | 57 | 67 | 75 | 77 | 62 | |
| HOUR 22 LST | 30 | 78 | 76 | 75 | 74 | 72 | 70 | 68 | 70 | 75 | 81 | 81 | 80 | 75 | |
| S | PERCENT POSSIBLE SUNSHINE | 30 | 28 | 40 | 50 | 52 | 56 | 56 | 64 | 65 | 62 | 43 | 28 | 23 | 47 |
| W/O | MEAN NO. DAYS WITH: | ||||||||||||||
| HEAVY FOG(VISBY 1/4 MI) | 57 | 4.8 | 3.2 | 2.3 | 1.1 | 0.7 | 0.7 | 1.5 | 2.5 | 4.9 | 6.9 | 5.0 | 5.9 | 39.5 | |
| THUNDERSTORMS | 57 | 0.2 | 0.3 | 0.6 | 1.0 | 0.9 | 0.7 | 0.7 | 0.8 | 0.7 | 0.4 | 0.8 | 0.3 | 7.4 | |
| CLOUDINESS | MEAN: | ||||||||||||||
| SUNRISE-SUNSET (OKTAS) | 52 | 6.7 | 6.5 | 6.3 | 6.2 | 5.7 | 5.6 | 4.2 | 4.5 | 4.8 | 5.9 | 6.6 | 6.7 | 5.8 | |
| MIDNIGHT-MIDNIGHT (OKTAS) | 32 | 6.6 | 6.1 | 5.8 | 5.9 | 5.5 | 5.3 | 4.1 | 4.2 | 4.4 | 5.3 | 6.3 | 6.4 | 5.5 | |
| MEAN NO. DAYS WITH: | |||||||||||||||
| CLEAR | 52 | 2.8 | 3.0 | 3.4 | 2.7 | 4.4 | 5.1 | 10.2 | 9.0 | 8.1 | 4.0 | 2.5 | 2.3 | 57.5 | |
| PARTLY CLOUDY | 52 | 3.9 | 4.2 | 5.8 | 7.3 | 8.8 | 7.9 | 9.5 | 9.7 | 8.5 | 7.4 | 4.2 | 3.9 | 81.1 | |
| CLOUDY | 52 | 24.3 | 21.1 | 21.9 | 20.0 | 17.7 | 16.9 | 10.5 | 11.9 | 13.0 | 19.5 | 23.3 | 24.9 | 225.0 | |
| PR | MEAN STATION PRESSURE(IN) | 29 | 29.55 | 29.52 | 29.50 | 29.55 | 29.55 | 29.56 | 29.57 | 29.54 | 29.55 | 29.57 | 29.53 | 29.58 | 29.55 |
| MEAN SEA-LEVEL PRES. (IN) | 18 | 30.04 | 30.02 | 30.01 | 30.04 | 30.02 | 30.03 | 30.05 | 30.03 | 30.03 | 30.06 | 30.02 | 30.08 | 30.04 | |
| WINDS | MEAN SPEED (MPH) | 51 | 9.6 | 9.6 | 9.5 | 9.4 | 8.9 | 8.6 | 8.2 | 7.9 | 8.1 | 8.4 | 9.2 | 9.6 | 8.9 |
| PREVAIL. DIR (TENS OF DEGS) | 35 | 19 | 19 | 19 | 21 | 21 | 21 | 22 | 21 | 01 | 19 | 19 | 18 | 19 | |
| MAXIMUM 2-MINUTE: | |||||||||||||||
| SPEED (MPH) | 5 | 40 | 37 | 44 | 29 | 25 | 26 | 22 | 22 | 36 | 32 | 37 | 37 | 44 | |
| DIR. (TENS OF DEGS) | 20 | 23 | 19 | 22 | 21 | 22 | 22 | 01 | 20 | 18 | 20 | 22 | 19 | ||
| YEAR OF OCCURRENCE | 2000 | 1999 | 1999 | 2001 | 2001 | 1999 | 2001 | 1997 | 1999 | 1997 | 1998 | 2000 | MAR 1999 | ||
| MAXIMUM 5-SECOND: | |||||||||||||||
| SPEED (MPH) | 5 | 52 | 49 | 60 | 40 | 36 | 32 | 31 | 29 | 43 | 44 | 48 | 48 | 60 | |
| DIR. (TENS OF DEGS) | 20 | 21 | 18 | 21 | 27 | 23 | 23 | 34 | 21 | 18 | 21 | 22 | 18 | ||
| YEAR OF OCCURRENCE | 2000 | 1999 | 1999 | 2001 | 1999 | 1999 | 1999 | 1998 | 1999 | 1997 | 1998 | 2000 | MAR 1999 | ||
| PRECIPITATION | NORMAL (IN) | 30 | 5.38 | 3.99 | 3.54 | 2.33 | 1.70 | 1.50 | 0.76 | 1.14 | 1.88 | 3.23 | 5.83 | 5.91 | 37.19 |
| MAXIMUM MONTHLY (IN) | 57 | 12.92 | 9.11 | 8.40 | 6.53 | 4.76 | 3.90 | 2.39 | 4.59 | 5.95 | 8.95 | 11.62 | 11.85 | 12.92 | |
| YEAR OF OCCURRENCE | 1953 | 1961 | 1950 | 1991 | 1948 | 1946 | 1983 | 1975 | 1978 | 1947 | 1998 | 1979 | JAN 1953 | ||
| MINIMUM MONTHLY (IN) | 57 | 0.58 | 0.35 | 0.57 | 0.33 | 0.12 | 0.13 | T | 0.01 | T | 0.31 | 0.74 | 1.37 | T | |
| YEAR OF OCCURRENCE | 1985 | 1993 | 1965 | 1956 | 1992 | 1951 | 1960 | 1974 | 1991 | 1987 | 1976 | 1978 | SEP 1991 | ||
| MAXIMUM IN 24 HOURS (IN) | 57 | 3.22 | 3.41 | 2.86 | 3.32 | 1.83 | 2.08 | 0.85 | 1.75 | 2.23 | 3.74 | 3.58 | 2.61 | 3.74 | |
| YEAR OF OCCURRENCE | 1986 | 1951 | 1972 | 1991 | 1969 | 1985 | 1981 | 1968 | 1978 | 1981 | 1990 | 1979 | OCT 1981 | ||
| NORMAL NO. DAYS WITH: | |||||||||||||||
| PRECIPITATION 0.01 | 30 | 18.0 | 15.4 | 16.8 | 13.6 | 10.6 | 8.4 | 5.0 | 6.1 | 9.1 | 12.2 | 17.6 | 18.7 | 151.5 | |
| PRECIPITATION 1.00 | 30 | 0.8 | 0.4 | 0.2 | 0.1 | 0.1 | 0.2 | 0.0 | 0.1 | 0.2 | 0.4 | 1.2 | 1.1 | 4.8 | |
| SNOWFALL | NORMAL (IN) | 30 | 4.1 | 1.2 | 0.7 | 0.1 | T | 0.0 | 0.0 | 0.0 | 0.0 | 0.1 | 1.1 | 3.1 | 10.4 |
| MAXIMUM MONTHLY (IN) | 52 | 57.2 | 13.1 | 18.2 | 2.3 | T | 0.0 | T | 0.0 | T | 2.0 | 17.5 | 22.1 | 57.2 | |
| YEAR OF OCCURRENCE | 1950 | 1949 | 1951 | 1972 | 1993 | 1980 | 1972 | 1971 | 1985 | 1968 | JAN 1950 | ||||
| MAXIMUM IN 24 HOURS (IN) | 52 | 21.4 | 9.8 | 7.4 | 2.3 | T | 0.0 | T | 0.0 | T | 2.0 | 9.4 | 13.0 | 21.4 | |
| YEAR OF OCCURRENCE | 1950 | 1990 | 1989 | 1972 | 1993 | 1980 | 1972 | 1971 | 1946 | 1968 | JAN 1950 | ||||
| MAXIMUM SNOW DEPTH (IN) | 47 | 21 | 11 | 7 | 2 | 0 | 0 | 0 | 0 | 0 | 2 | 8 | 10 | 21 | |
| YEAR OF OCCURRENCE | 1969 | 1969 | 1989 | 1972 | 1971 | 1985 | 1974 | JAN 1969 | |||||||
| NORMAL NO. DAYS WITH: | |||||||||||||||
| SNOWFALL 1.0 | 30 | 1.4 | 0.3 | 0.3 | 0.1 | 0.0 | 0.0 | 0.0 | 0.0 | 0.0 | 0.* | 0.3 | 1.0 | 3.4 |
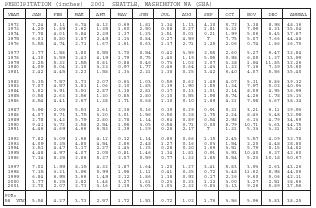
| PRECIPITATION (inches) 2001 SEATTLE, WASHINGTON WA (SEA) | |||||||||||||
| YEAR | JAN | FEB | MAR | APR | MAY | JUN | JUL | AUG | SEP | OCT | NOV | DEC | ANNUAL |
| 1972 | 7.24 | 8.11 | 6.74 | 4.12 | 0.69 | 1.81 | 1.34 | 1.13 | 4.10 | 0.72 | 3.38 | 8.98 | 48.36 |
| 1973 | 4.29 | 1.89 | 1.62 | 1.35 | 1.60 | 2.50 | 0.08 | 0.27 | 1.81 | 3.31 | 7.99 | 8.33 | 35.04 |
| 1974 | 7.78 | 4.01 | 5.84 | 2.39 | 1.37 | 1.25 | 1.51 | 0.01 | 0.21 | 1.99 | 5.06 | 6.45 | 37.87 |
| 1975 | 6.01 | 5.80 | 2.87 | 2.49 | 1.13 | 0.84 | 0.27 | 4.59 | T | 7.75 | 5.07 | 7.66 | 44.48 |
| 1976 | 5.55 | 4.74 | 2.71 | 1.67 | 1.61 | 0.63 | 1.17 | 2.71 | 1.25 | 2.06 | 0.74 | 1.86 | 26.70 |
| 1977 | 1.77 | 1.58 | 3.80 | 0.55 | 3.70 | 0.54 | 0.42 | 3.59 | 2.55 | 2.60 | 5.27 | 6.47 | 32.84 |
| 1978 | 4.30 | 3.59 | 2.43 | 4.19 | 1.79 | 0.75 | 1.40 | 1.19 | 5.95 | 0.98 | 6.05 | 1.37 | 33.99 |
| 1979 | 2.25 | 5.32 | 1.55 | 0.81 | 0.88 | 0.46 | 0.73 | 1.02 | 2.07 | 3.38 | 1.94 | 11.85 | 32.26 |
| 1980 | 4.09 | 5.04 | 2.10 | 3.23 | 0.97 | 1.77 | 0.46 | 0.64 | 1.43 | 1.32 | 7.16 | 7.39 | 35.60 |
| 1981 | 2.42 | 4.45 | 2.23 | 1.58 | 1.33 | 2.31 | 1.38 | 0.25 | 3.42 | 6.40 | 4.07 | 5.56 | 35.40 |
| 1982 | 5.35 | 7.57 | 3.73 | 2.07 | 0.63 | 1.03 | 0.59 | 0.62 | 1.49 | 4.07 | 5.31 | 6.86 | 39.32 |
| 1983 | 7.07 | 4.57 | 3.81 | 1.06 | 2.10 | 1.85 | 2.39 | 1.90 | 1.85 | 1.34 | 7.97 | 5.02 | 40.93 |
| 1984 | 3.62 | 3.91 | 3.91 | 2.87 | 3.38 | 2.81 | 0.17 | 0.13 | 1.01 | 2.14 | 8.09 | 4.95 | 36.99 |
| 1985 | 0.58 | 2.63 | 2.56 | 1.30 | 0.85 | 2.80 | 0.10 | 0.55 | 1.98 | 5.74 | 4.26 | 1.78 | 25.13 |
| 1986 | 8.54 | 4.41 | 2.67 | 1.38 | 1.71 | 0.68 | 1.10 | 0.10 | 1.89 | 4.21 | 7.98 | 3.67 | 38.34 |
| 1987 | 5.98 | 2.05 | 5.53 | 2.61 | 2.38 | 0.16 | 0.39 | 0.29 | 0.91 | 0.31 | 3.21 | 6.11 | 29.93 |
| 1988 | 4.07 | 0.71 | 3.75 | 3.20 | 3.01 | 1.56 | 0.50 | 0.28 | 1.75 | 2.24 | 8.43 | 3.48 | 32.98 |
| 1989 | 2.78 | 3.43 | 5.79 | 2.80 | 2.78 | 1.14 | 0.64 | 0.89 | 0.54 | 2.98 | 6.13 | 4.79 | 34.69 |
| 1990 | 9.41 | 3.72 | 2.58 | 2.54 | 1.98 | 3.05 | 0.58 | 0.71 | 0.05 | 5.79 | 10.71 | 3.63 | 44.75 |
| 1991 | 4.46 | 4.69 | 4.66 | 6.53 | 1.39 | 1.29 | 0.28 | 2.17 | T | 1.31 | 5.33 | 3.31 | 35.42 |
| 1992 | 7.82 | 3.09 | 1.68 | 4.12 | 0.12 | 1.14 | 0.89 | 0.66 | 1.15 | 2.45 | 5.57 | 4.09 | 32.78 |
| 1993 | 4.09 | 0.35 | 4.80 | 4.54 | 2.86 | 2.48 | 1.27 | 0.16 | 0.03 | 1.54 | 2.20 | 4.48 | 28.80 |
| 1994 | 2.51 | 4.47 | 3.17 | 2.27 | 1.43 | 1.25 | 0.28 | 0.30 | 1.69 | 3.51 | 5.79 | 8.15 | 34.82 |
| 1995 | 4.48 | 4.97 | 4.07 | 2.05 | 0.81 | 1.46 | 1.34 | 1.81 | 0.91 | 3.93 | 10.40 | 6.37 | 42.60 |
| 1996 | 7.34 | 8.35 | 2.06 | 5.37 | 2.07 | 0.59 | 0.77 | 1.32 | 1.85 | 5.54 | 5.23 | 10.18 | 50.67 |
| 1997 | 7.02 | 1.99 | 8.15 | 4.32 | 1.87 | 1.64 | 1.20 | 1.27 | 3.41 | 5.83 | 3.93 | 2.63 | 43.26 |
| 1998 | 7.15 | 3.31 | 3.96 | 0.99 | 1.98 | 1.11 | 0.41 | 0.35 | 0.72 | 3.48 | 11.62 | 8.98 | 44.06 |
| 1999 | 6.84 | 6.95 | 3.66 | 1.49 | 2.12 | 1.86 | 1.18 | 0.92 | 0.17 | 2.26 | 9.60 | 5.06 | 42.11 |
| 2000 | 3.77 | 5.25 | 2.82 | 1.48 | 3.27 | 1.61 | 0.23 | 0.33 | 1.12 | 3.00 | 3.27 | 2.51 | 28.66 |
| 2001 | 2.70 | 2.07 | 2.73 | 3.16 | 1.39 | 3.05 | 1.03 | 2.32 | 0.83 | 3.13 | 9.26 | 5.89 | 37.56 |
| POR=58 YRS | 5.58 | 4.27 | 3.73 | 2.57 | 1.72 | 1.53 | 0.72 | 1.02 | 1.76 | 3.56 | 5.96 | 5.83 | 38.25 |
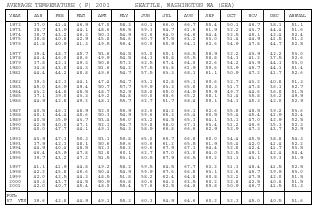
| AVERAGE TEMPERATURE (F) 2001 SEATTLE, WASHINGTON WA (SEA) | |||||||||||||
| YEAR | JAN | FEB | MAR | APR | MAY | JUN | JUL | AUG | SEP | OCT | NOV | DEC | ANNUAL |
| 1972 | 37.0 | 41.4 | 46.9 | 47.0 | 58.3 | 60.1 | 66.0 | 66.7 | 55.4 | 50.1 | 46.7 | 38.1 | 51.1 |
| 1973 | 38.7 | 43.9 | 44.1 | 48.6 | 56.5 | 59.3 | 64.7 | 61.6 | 61.9 | 52.2 | 43.7 | 44.4 | 51.6 |
| 1974 | 38.7 | 43.2 | 46.3 | 50.3 | 54.9 | 62.6 | 64.0 | 64.6 | 64.4 | 52.5 | 45.1 | 42.4 | 52.4 |
| 1975 | 38.8 | 40.8 | 42.9 | 45.8 | 54.6 | 60.7 | 67.5 | 63.2 | 63.0 | 51.4 | 44.9 | 41.5 | 51.3 |
| 1976 | 41.8 | 40.9 | 41.3 | 49.5 | 56.4 | 60.0 | 65.9 | 64.1 | 62.6 | 54.9 | 47.8 | 44.7 | 52.5 |
| 1977 | 39.4 | 48.7 | 45.7 | 53.6 | 54.5 | 63.0 | 65.1 | 68.5 | 58.9 | 52.2 | 43.9 | 42.2 | 53.0 |
| 1978 | 44.4 | 46.0 | 48.6 | 49.9 | 54.5 | 64.3 | 65.8 | 65.5 | 58.8 | 54.3 | 41.2 | 37.5 | 52.6 |
| 1979 | 37.8 | 42.3 | 49.3 | 50.8 | 57.2 | 62.5 | 67.4 | 64.0 | 62.6 | 54.2 | 43.9 | 44.1 | 53.0 |
| 1980 | 34.8 | 43.8 | 44.3 | 51.6 | 54.2 | 57.5 | 63.8 | 61.9 | 59.6 | 53.9 | 46.7 | 44.1 | 51.4 |
| 1981 | 44.4 | 44.2 | 48.8 | 49.6 | 54.7 | 57.5 | 63.3 | 68.1 | 61.1 | 50.9 | 47.2 | 41.7 | 52.6 |
| 1982 | 39.3 | 42.1 | 44.1 | 47.4 | 54.7 | 63.1 | 62.8 | 65.1 | 60.6 | 52.7 | 43.2 | 40.8 | 51.3 |
| 1983 | 45.0 | 46.9 | 49.4 | 50.7 | 57.7 | 59.9 | 63.3 | 65.6 | 58.3 | 51.7 | 47.8 | 36.1 | 52.7 |
| 1984 | 43.2 | 44.8 | 48.5 | 48.7 | 52.9 | 58.8 | 65.0 | 64.9 | 59.9 | 49.7 | 44.6 | 36.8 | 51.5 |
| 1985 | 37.1 | 39.0 | 43.3 | 49.2 | 54.8 | 60.0 | 68.6 | 65.2 | 58.1 | 51.4 | 35.8 | 36.2 | 49.9 |
| 1986 | 44.9 | 42.8 | 49.2 | 48.1 | 55.7 | 62.7 | 61.7 | 68.4 | 59.1 | 54.3 | 45.3 | 42.0 | 52.9 |
| 1987 | 40.5 | 46.3 | 48.9 | 52.0 | 56.9 | 62.6 | 64.2 | 66.1 | 62.6 | 55.8 | 48.5 | 39.2 | 53.6 |
| 1988 | 40.1 | 44.4 | 45.6 | 50.3 | 54.9 | 59.6 | 65.3 | 65.4 | 60.5 | 55.4 | 45.4 | 41.9 | 52.4 |
| 1989 | 40.5 | 35.9 | 43.7 | 53.4 | 56.0 | 63.2 | 64.5 | 65.3 | 64.1 | 53.1 | 47.0 | 42.9 | 52.5 |
| 1990 | 42.5 | 40.0 | 47.1 | 52.1 | 54.7 | 59.8 | 68.0 | 67.3 | 63.4 | 51.2 | 46.6 | 35.3 | 52.3 |
| 1991 | 40.0 | 47.7 | 44.1 | 49.1 | 54.3 | 58.9 | 66.8 | 66.6 | 62.9 | 52.9 | 47.3 | 43.7 | 52.9 |
| 1992 | 43.9 | 47.3 | 50.3 | 53.1 | 59.8 | 65.0 | 66.7 | 66.8 | 60.0 | 54.4 | 45.5 | 38.8 | 54.3 |
| 1993 | 37.9 | 42.3 | 48.1 | 50.6 | 59.6 | 60.6 | 61.2 | 65.5 | 61.9 | 55.4 | 42.0 | 41.4 | 52.2 |
| 1994 | 44.9 | 40.4 | 48.5 | 52.3 | 58.2 | 60.6 | 67.9 | 67.3 | 64.4 | 52.8 | 42.4 | 41.7 | 53.5 |
| 1995 | 46.4 | 45.9 | 47.8 | 51.8 | 60.1 | 62.7 | 67.0 | 63.0 | 64.0 | 52.5 | 49.1 | 42.4 | 54.4 |
| 1996 | 39.7 | 43.2 | 47.2 | 51.5 | 53.1 | 60.5 | 67.9 | 66.5 | 59.2 | 51.1 | 43.1 | 39.3 | 51.9 |
| 1997 | 41.1 | 41.9 | 44.8 | 49.2 | 58.2 | 59.5 | 64.5 | 67.7 | 62.2 | 51.3 | 48.4 | 41.5 | 52.5 |
| 1998 | 42.2 | 45.8 | 46.6 | 50.4 | 54.9 | 59.9 | 67.6 | 66.8 | 63.1 | 52.6 | 46.7 | 39.9 | 53.0 |
| 1999 | 42.0 | 42.5 | 44.3 | 48.5 | 51.8 | 58.2 | 62.4 | 64.8 | 60.8 | 52.2 | 47.9 | 42.0 | 51.5 |
| 2000 | 40.3 | 43.7 | 44.5 | 50.9 | 53.8 | 60.6 | 64.3 | 63.5 | 60.2 | 52.8 | 42.5 | 40.8 | 51.5 |
| 2001 | 42.0 | 40.7 | 45.4 | 48.0 | 55.4 | 57.6 | 62.5 | 64.8 | 59.8 | 50.9 | 46.7 | 41.5 | 51.3 |
| POR=57 YRS | 39.6 | 42.8 | 44.9 | 49.1 | 55.3 | 60.3 | 64.9 | 64.6 | 60.2 | 52.3 | 45.0 | 40.5 | 51.6 |
REFERENCE NOTES:
PAGE 1:
THE TEMPERATURE GRAPH SHOWS NORMAL MAXIMUM AND NORMAL MINIMUM DAILY TEMPERATURES (SOLID CURVES) AND THE ACTUAL DAILY HIGH AND LOW TEMPERATURES (VERTICAL BARS).
PAGE 2 AND 3:
H/C INDICATES HEATING AND COOLING DEGREE DAYS.
RH INDICATES RELATIVE HUMIDITY
W/O INDICATES WEATHER AND OBSTRUCTIONS
S INDICATES SUNSHINE.
PR INDICATES PRESSURE.
CLOUDINESS ON PAGE 3 IS THE SUM OF THE CEILOMETER AND SATELLITE DATA NOT TO EXCEED EIGHT EIGHTHS (OKTAS).
GENERAL:
T INDICATES TRACE PRECIPITATION, AN AMOUNT GREATER THAN ZERO BUT LESS THAN THE LOWEST REPORTABLE VALUE.
+ INDICATES THE VALUE ALSO OCCURS ON EARLIER DATES.
BLANK ENTRIES DENOTE MISSING OR UNREPORTED DATA.
NORMALS ARE 30–YEAR AVERAGES (1961–1990).
ASOS INDICATES AUTOMATED SURFACE OBSERVING SYSTEM.
PM INDICATES THE LAST DAY OF THE PREVIOUS MONTH.
POR (PERIOD OF RECORD) BEGINS WITH THE JANUARY DATA MONTH AND IS THE NUMBER OF YEARS USED TO COMPUTE THE MEAN. INDIVIDUAL MONTHS WITHIN THE POR MAY BE MISSING.
WHEN THE POR FOR A NORMAL IS LESS THAN 30 YEARS, THE NORMAL IS PROVISIONAL AND IS BASED ON THE NUMBER OF YEARS INDICATED.
0.* OR * INDICATES THE VALUE OR MEAN–DAYS–WITH IS BETWEEN 0.00 AND 0.05.
CLOUDINESS FOR ASOS STATIONS DIFFERS FROM THE NON–ASOS OBSERVATION TAKEN BY A HUMAN OBSERVER. ASOS STATION CLOUDINESS IS BASED ON TIME–AVERAGED CEILOMETER DATA FOR CLOUDS AT OR BELOW 12,000 FEET AND ON SATELLITE DATA FOR CLOUDS ABOVE 12,000 FEET.
THE NUMBER OF DAYS WITH CLEAR, PARTLY CLOUDY, AND CLOUDY CONDITIONS FOR ASOS STATIONS IS THE SUM OF THE CEILOMETER AND SATELLITE DATA FOR THE SUNRISE TO SUNSET PERIOD.
GENERAL CONTINUED:
CLEAR INDICATES 0–2 OKTAS, PARTLY CLOUDY INDICATES 3–6 OKTAS, AND CLOUDY INDICATES 7 OR 8 OKTAS. WHEN AT LEAST ONE OF THE ELEMENTS (CEILOMETER OR SATELLITE) IS MISSING, THE DAILY CLOUDINESS IS NOT COMPUTED.
WIND DIRECTION IS RECORDED IN TENS OF DEGREES (2 DIGITS) CLOCKWISE FROM TRUE NORTH. "00" INDICATES CALM. "36" INDICATES TRUE NORTH.
RESULTANT WIND IS THE VECTOR AVERAGE OF THE SPEED AND DIRECTION.
AVERAGE TEMPERATURE IS THE SUM OF THE MEAN DAILY MAXIMUM AND MINIMUM TEMPERATURE DIVIDED BY 2.
SNOWFALL DATA COMPRISE ALL FORMS OF FROZEN PRECIPITATION, INCLUDING HAIL.
A HEATING (COOLING) DEGREE DAY IS THE DIFFERENCE BETWEEN THE AVERAGE DAILY TEMPERATURE AND 65 F.
DRY BULB IS THE TEMPERATURE OF THE AMBIENT AIR.
DEW POINT IS THE TEMPERATURE TO WHICH THE AIR MUST BE COOLED TO ACHIEVE 100 PERCENT RELATIVE HUMIDITY.
WET BULB IS THE TEMPERATURE THE AIR WOULD HAVE IF THE MOISTURE CONTENT WAS INCREASED TO 100 PERCENT RELATIVE HUMIDITY.
ON JULY 1, 1996, THE NATIONAL WEATHER SERVICE BEGAN USING THE "METAR" OBSERVATION CODE THAT WAS ALREADY EMPLOYED BY MOST OTHER NATIONS OF THE WORLD. THE MOST NOTICEABLE DIFFERENCE IN THIS ANNUAL PUBLICATION WILL BE THE CHANGE IN UNITS FROM TENTHS TO EIGHTS (OKTAS) FOR REPORTING THE AMOUNT OF SKY COVER.
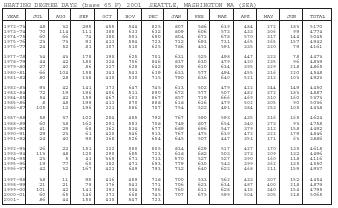
| HEATING DEGREE DAYS (base 65 F) 2001 SEATTLE, WASHINGTON WA (SEA) | |||||||||||||
| YEAR | JUL | AUG | SEP | OCT | NOV | DEC | JAN | FEB | MAR | APR | MAY | JUN | TOTAL |
| 1972-73 | 48 | 32 | 295 | 455 | 544 | 825 | 807 | 586 | 639 | 484 | 272 | 183 | 5170 |
| 1973-74 | 70 | 114 | 111 | 388 | 633 | 632 | 809 | 606 | 573 | 433 | 306 | 99 | 4774 |
| 1974-75 | 60 | 66 | 74 | 380 | 591 | 690 | 804 | 671 | 678 | 570 | 317 | 144 | 5045 |
| 1975-76 | 23 | 73 | 93 | 413 | 594 | 723 | 712 | 693 | 731 | 465 | 265 | 157 | 4942 |
| 1976-77 | 24 | 52 | 81 | 307 | 510 | 625 | 786 | 451 | 591 | 335 | 320 | 79 | 4161 |
| 1977-78 | 34 | 43 | 178 | 390 | 625 | 701 | 631 | 525 | 498 | 447 | 323 | 78 | 4473 |
| 1978-79 | 44 | 42 | 180 | 324 | 706 | 846 | 837 | 630 | 479 | 420 | 235 | 96 | 4839 |
| 1979-80 | 27 | 40 | 86 | 327 | 628 | 642 | 929 | 610 | 634 | 395 | 329 | 218 | 4865 |
| 1980-81 | 66 | 104 | 158 | 343 | 543 | 639 | 633 | 577 | 494 | 455 | 316 | 220 | 4548 |
| 1981-82 | 80 | 28 | 138 | 430 | 530 | 715 | 790 | 636 | 640 | 521 | 312 | 103 | 4923 |
| 1982-83 | 93 | 42 | 141 | 373 | 647 | 745 | 613 | 502 | 479 | 422 | 244 | 149 | 4450 |
| 1983-84 | 72 | 19 | 196 | 406 | 511 | 890 | 672 | 577 | 507 | 482 | 372 | 183 | 4887 |
| 1984-85 | 54 | 42 | 159 | 467 | 603 | 867 | 857 | 719 | 666 | 469 | 310 | 160 | 5373 |
| 1985-86 | 8 | 48 | 199 | 413 | 870 | 888 | 618 | 616 | 479 | 502 | 305 | 90 | 5036 |
| 1986-87 | 105 | 12 | 196 | 323 | 586 | 707 | 754 | 522 | 491 | 384 | 253 | 105 | 4438 |
| 1987-88 | 58 | 37 | 102 | 284 | 485 | 792 | 767 | 590 | 593 | 435 | 316 | 165 | 4624 |
| 1988-89 | 60 | 38 | 162 | 291 | 583 | 708 | 749 | 807 | 654 | 340 | 273 | 93 | 4758 |
| 1989-90 | 41 | 29 | 68 | 362 | 534 | 677 | 689 | 696 | 547 | 379 | 312 | 158 | 4492 |
| 1990-91 | 29 | 23 | 61 | 420 | 546 | 913 | 767 | 475 | 639 | 472 | 322 | 179 | 4846 |
| 1991-92 | 24 | 40 | 90 | 368 | 526 | 654 | 645 | 507 | 447 | 351 | 171 | 63 | 3886 |
| 1992-93 | 26 | 22 | 151 | 322 | 580 | 805 | 834 | 629 | 517 | 427 | 170 | 135 | 4618 |
| 1993-94 | 113 | 48 | 120 | 290 | 685 | 723 | 618 | 682 | 503 | 373 | 209 | 132 | 4496 |
| 1994-95 | 23 | 5 | 43 | 369 | 671 | 713 | 570 | 527 | 527 | 390 | 160 | 118 | 4116 |
| 1995-96 | 19 | 77 | 60 | 382 | 471 | 693 | 779 | 630 | 543 | 399 | 362 | 135 | 4550 |
| 1996-97 | 42 | 32 | 167 | 422 | 649 | 793 | 732 | 640 | 622 | 468 | 211 | 159 | 4937 |
| 1997-98 | 38 | 11 | 95 | 416 | 489 | 718 | 700 | 533 | 562 | 433 | 307 | 152 | 4454 |
| 1998-99 | 21 | 21 | 79 | 376 | 543 | 771 | 706 | 623 | 634 | 487 | 400 | 218 | 4879 |
| 1999-00 | 101 | 42 | 141 | 393 | 504 | 706 | 760 | 611 | 628 | 415 | 340 | 154 | 4795 |
| 2000-01 | 60 | 65 | 146 | 373 | 668 | 745 | 707 | 675 | 599 | 504 | 305 | 218 | 5065 |
| 2001- | 86 | 44 | 150 | 430 | 547 | 723 | |||||||
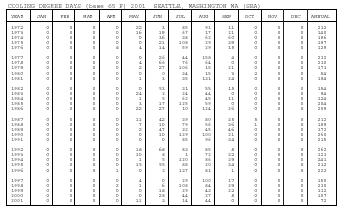
| COOLING DEGREE DAYS (base 65 F) 2001 SEATTLE, WASHINGTON WA (SEA) | |||||||||||||
| YEAR | JAN | FEB | MAR | APR | MAY | JUN | JUL | AUG | SEP | OCT | NOV | DEC | ANNUAL |
| 1972 | 0 | 0 | 0 | 0 | 22 | 3 | 85 | 91 | 11 | 0 | 0 | 0 | 212 |
| 1973 | 0 | 0 | 0 | 0 | 16 | 19 | 67 | 17 | 21 | 0 | 0 | 0 | 140 |
| 1974 | 0 | 0 | 0 | 0 | 0 | 36 | 38 | 62 | 60 | 0 | 0 | 0 | 196 |
| 1975 | 0 | 0 | 0 | 0 | 0 | 21 | 108 | 29 | 39 | 0 | 0 | 0 | 197 |
| 1976 | 0 | 0 | 0 | 8 | 4 | 14 | 59 | 29 | 15 | 0 | 0 | 0 | 129 |
| 1977 | 0 | 0 | 0 | 0 | 0 | 26 | 44 | 158 | 4 | 0 | 0 | 0 | 232 |
| 1978 | 0 | 0 | 0 | 0 | 4 | 66 | 76 | 64 | 0 | 0 | 0 | 0 | 210 |
| 1979 | 0 | 0 | 0 | 0 | 2 | 27 | 106 | 15 | 21 | 0 | 0 | 0 | 171 |
| 1980 | 0 | 0 | 0 | 0 | 0 | 0 | 34 | 15 | 3 | 2 | 0 | 0 | 54 |
| 1981 | 0 | 0 | 0 | 0 | 1 | 3 | 35 | 131 | 24 | 0 | 0 | 0 | 194 |
| 1982 | 0 | 0 | 0 | 0 | 0 | 53 | 31 | 55 | 15 | 0 | 0 | 0 | 154 |
| 1983 | 0 | 0 | 0 | 0 | 24 | 2 | 24 | 44 | 0 | 0 | 0 | 0 | 94 |
| 1984 | 0 | 0 | 0 | 0 | 1 | 5 | 62 | 45 | 11 | 0 | 0 | 0 | 124 |
| 1985 | 0 | 0 | 0 | 0 | 3 | 17 | 125 | 59 | 0 | 0 | 0 | 0 | 204 |
| 1986 | 0 | 0 | 0 | 0 | 22 | 27 | 10 | 124 | 26 | 0 | 0 | 0 | 209 |
| 1987 | 0 | 0 | 0 | 0 | 11 | 42 | 39 | 80 | 35 | 5 | 0 | 0 | 212 |
| 1988 | 0 | 0 | 0 | 0 | 7 | 10 | 79 | 56 | 36 | 1 | 0 | 0 | 189 |
| 1989 | 0 | 0 | 0 | 0 | 2 | 47 | 32 | 45 | 46 | 0 | 0 | 0 | 172 |
| 1990 | 0 | 0 | 0 | 0 | 0 | 10 | 129 | 100 | 21 | 0 | 0 | 0 | 260 |
| 1991 | 0 | 0 | 0 | 0 | 0 | 0 | 85 | 96 | 34 | 0 | 0 | 0 | 215 |
| 1992 | 0 | 0 | 0 | 0 | 18 | 68 | 83 | 85 | 8 | 0 | 0 | 0 | 262 |
| 1993 | 0 | 0 | 0 | 0 | 10 | 8 | 1 | 72 | 32 | 0 | 0 | 0 | 123 |
| 1994 | 0 | 0 | 0 | 0 | 1 | 5 | 120 | 86 | 29 | 0 | 0 | 0 | 241 |
| 1995 | 0 | 0 | 0 | 0 | 15 | 55 | 88 | 20 | 34 | 0 | 0 | 0 | 212 |
| 1996 | 0 | 0 | 0 | 1 | 0 | 2 | 137 | 81 | 1 | 0 | 0 | 0 | 222 |
| 1997 | 0 | 0 | 0 | 0 | 4 | 0 | 29 | 100 | 17 | 0 | 0 | 0 | 150 |
| 1998 | 0 | 0 | 0 | 2 | 1 | 6 | 108 | 84 | 29 | 0 | 0 | 0 | 230 |
| 1999 | 0 | 0 | 0 | 0 | 0 | 18 | 29 | 43 | 22 | 0 | 0 | 0 | 112 |
| 2000 | 0 | 0 | 0 | 0 | 0 | 28 | 44 | 27 | 8 | 0 | 0 | 0 | 107 |
| 2001 | 0 | 0 | 0 | 0 | 11 | 3 | 14 | 44 | 0 | 0 | 0 | 0 | 72 |
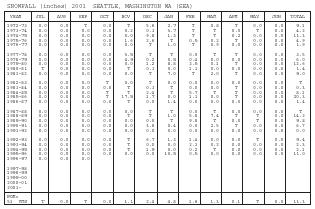
| SNOWFALL (inches) 2001 SEATTLE, WASHINGTON WA (SEA) | |||||||||||||
| YEAR | JUL | AUG | SEP | OCT | NOV | DEC | JAN | FEB | MAR | APR | MAY | JUN | TOTAL |
| 1972-73 | 0.0 | 0.0 | T | 0.0 | T | 5.6 | 2.7 | T | 0.8 | T | 0.0 | 0.0 | 9.1 |
| 1973-74 | 0.0 | 0.0 | 0.0 | 0.0 | 0.2 | 0.3 | 3.7 | T | T | 0.0 | T | 0.0 | 4.2 |
| 1974-75 | 0.0 | 0.0 | 0.0 | 0.0 | 0.0 | 9.8 | 1.3 | T | T | 0.2 | 0.0 | 0.0 | 11.3 |
| 1975-76 | 0.0 | 0.0 | 0.0 | 0.0 | 1.6 | 2.6 | T | 0.5 | 0.2 | T | 0.0 | 0.0 | 4.9 |
| 1976-77 | 0.0 | 0.0 | 0.0 | 0.0 | 0.0 | T | 1.0 | T | 0.9 | 0.0 | 0.0 | 0.0 | 1.9 |
| 1977-78 | 0.0 | 0.0 | 0.0 | 0.0 | 3.5 | T | T | 0.0 | T | T | 0.0 | 0.0 | 3.5 |
| 1978-79 | 0.0 | 0.0 | 0.0 | 0.0 | 4.9 | 0.2 | 0.5 | 0.4 | 0.0 | 0.0 | 0.0 | 0.0 | 6.0 |
| 1979-80 | 0.0 | 0.0 | 0.0 | 0.0 | 0.0 | 1.2 | 8.8 | 2.5 | 0.1 | T | 0.0 | 0.0 | 12.6 |
| 1980-81 | T | 0.0 | 0.0 | 0.0 | T | 0.3 | 0.0 | 1.1 | 0.0 | 0.0 | 0.0 | 0.0 | 1.4 |
| 1981-82 | 0.0 | 0.0 | 0.0 | 0.0 | 0.0 | T | 7.0 | T | 2.0 | T | 0.0 | 0.0 | 9.0 |
| 1982-83 | 0.0 | 0.0 | 0.0 | T | 0.0 | T | 0.0 | 0.0 | 0.0 | 0.0 | 0.0 | 0.0 | T |
| 1983-84 | 0.0 | 0.0 | 0.0 | 0.0 | T | 0.3 | T | 0.0 | 0.0 | T | 0.0 | 0.0 | 0.3 |
| 1984-85 | 0.0 | 0.0 | 0.0 | T | T | 2.4 | T | 5.7 | T | T | 0.0 | 0.0 | 8.1 |
| 1985-86 | 0.0 | 0.0 | 0.0 | T | 17.5 | 1.7 | 0.0 | 1.1 | 0.0 | T | 0.0 | 0.0 | 20.3 |
| 1986-87 | 0.0 | 0.0 | 0.0 | 0.0 | T | 0.0 | 1.4 | 0.0 | 0.0 | 0.0 | 0.0 | 0.0 | 1.4 |
| 1987-88 | 0.0 | 0.0 | 0.0 | 0.0 | 0.0 | T | T | 0.0 | T | 0.0 | 0.0 | 0.0 | T |
| 1988-89 | 0.0 | 0.0 | 0.0 | 0.0 | T | T | 1.0 | 5.8 | 7.4 | T | T | 0.0 | 14.2 |
| 1989-90 | 0.0 | 0.0 | 0.0 | 0.0 | 0.0 | 0.0 | T | 9.8 | T | 0.0 | T | 0.0 | 9.8 |
| 1990-91 | 0.0 | 0.0 | 0.0 | 0.0 | 0.0 | 3.8 | 0.4 | 0.0 | 2.5 | T | 0.0 | 0.0 | 6.7 |
| 1991-92 | 0.0 | 0.0 | 0.0 | 0.0 | 0.0 | 0.0 | 0.0 | 0.0 | 0.0 | 0.0 | 0.0 | 0.0 | 0.0 |
| 1992-93 | 0.0 | 0.0 | 0.0 | 0.0 | T | 6.7 | 1.3 | 1.4 | 0.0 | 0.0 | T | 0.0 | 9.4 |
| 1993-94 | 0.0 | 0.0 | 0.0 | 0.0 | T | 0.0 | 0.0 | 2.1 | 0.2 | 0.0 | 0.0 | 0.0 | 2.3 |
| 1994-95 | 0.0 | 0.0 | 0.0 | 0.0 | T | 1.9 | 0.0 | 0.2 | T | 0.0 | 0.0 | 0.0 | 2.1 |
| 1995-96 | 0.0 | 0.0 | 0.0 | 0.0 | 0.0 | 0.0 | 10.5 | 0.5 | 0.0 | 0.0 | 0.0 | 0.0 | 11.0 |
| 1996-97 | 0.0 | 0.0 | 0.0 | ||||||||||
| 1997-98 | |||||||||||||
| 1998-99 | |||||||||||||
| 1999-00 | |||||||||||||
| 2000-01 | |||||||||||||
| 2001- | |||||||||||||
| POR=51 YRS | T | 0.0 | T | 0.0 | 1.1 | 2.4 | 4.8 | 1.6 | 1.3 | 0.1 | T | 0.0 | 11.3 |
Comment about this article, ask questions, or add new information about this topic: