Winter Storms
WHERE & WHY WINTER STORMS OCCUR
Winter storms are generated, as are many of the thunderstorms of summer, from disturbances along the boundary between cold polar and warm tropical air masses—the fronts where air masses of different temperatures and densities wage their perpetual war of instability and equilibrium. The disturbances may become intense low-pressure systems, churning over tens of thousands of square miles in a great counter-clockwise sweep. In order for disturbances to become winter storms there are three key factors: cold air (below-freezing temperatures facilitate the production of snow and ice); moisture (which forms clouds and precipitation); and lift (which raises the moist air to form clouds, precipitation, and fronts).
In the Pacific, these disturbances form along polar fronts off the east coast of Asia and travel northeastward toward Alaska. But some, particularly those forming along the mid-Pacific polar front, take a more southerly track, striking the United States as far south as southern California. Few Pacific disturbances cross the Rockies, but some do, redeveloping to the east. One region of such redevelopment lies east of the Colorado Rockies; the storms that come out of that region are called Colorado cyclones . Another region of storm redevelopment is east of the Canadian Rockies, from which come the so-called Alberta cyclones . Both types take an eastward path, and most frequently converge over the Great Lakes. The lakes themselves generate severe local winter storms, and forge other storms from northward-drifting disturbances that originate over the Gulf of Mexico and the southern plains.
On the East Coast, winter storms often form along the Atlantic polar front near the coast of Virginia and the Carolinas and in the general area east of the southern Appalachians. These are the notorious Cape Hatteras storms— nor'easters—that develop to great intensity as they move up the coast, then drift seaward toward Iceland, where they finally dissipate.
Because they form over water, these storms are difficult to forecast, and occasionally surprise the Atlantic megalopolis with paralyzing snows. In 1969, the U.S. Departments of Commerce, Transportation, and Defense tightened winter storm surveillance with reconnaissance aircraft, an ocean buoy, and a new weather ship. With better hour-to-hour information on the storms, weather forecasters ashore have begun to ease the burden of unexpected heavy snows in eastern cities.
For some parts of the United States—the Northern Rockies, for example—storms with snow followed by cold are a threat from mid-September to mid-May; during one of the colder months from November to March, it is not unusual for several separate storms to affect some area across the continent. Intense winter storms are frequently accompanied by cold waves, ice or glaze, heavy snow, blizzards, or a combination of these; often, in a single winter storm, precipitation type changes several times as the storm passes. The common feature of these storms is the ability to completely immobilize large areas and to isolate and kill persons and livestock in their path. In the north, the severity of these storms makes their threat a seasonal one. Farther south, the occasional penetration of severe winter storms into more moderate climates causes severe hardship and great loss of warm-weather crops.
FREEZING RAIN & ICE STORMS
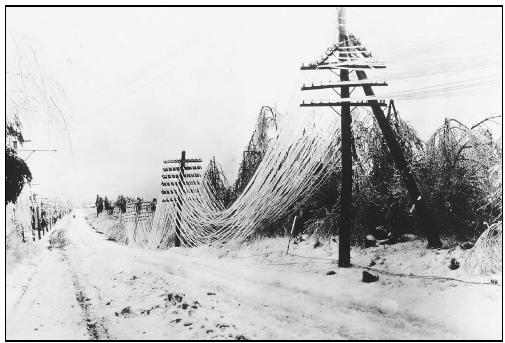
Freezing rain or freezing drizzle is rain or drizzle that occurs when surface temperatures are below freezing (32°F). The moisture falls in liquid form but freezes upon impact, resulting in a coating of ice glaze on all exposed objects. The occurrence of freezing rain or drizzle is often called an ice storm when a substantial glaze layer accumulates. Ice forming on exposed objects generally ranges from a thin glaze to coatings about 1 in thick, but much thicker deposits have been observed. For example, ice deposits to 8 in in diameter were reported on wires in northern Idaho in January 1961, and loadings of 11 lb per foot of telephone wire were found in Michigan in February 1922. It has been estimated that an evergreen tree 50 ft high with an average width of 20 ft may be coated with as much as five tons of ice during a severe ice storm. A heavy accumulation of ice, especially when accompanied by high winds, devastates trees and transmission lines. Sidewalks, streets, and highways become extremely hazardous to pedestrians and motorists; over 85% of ice-storm deaths are traffic related. Freezing rain and drizzle frequently occur for a short time as a transitory condition between the occurrence of rain or drizzle and snow, and therefore usually occur at temperatures slightly below freezing.
Some of the most destructive ice storms have occurred in the southern states, where warm-weather buildings and crops are not adapted to withstand severe winter conditions. The most damaging ice storm in the United States was probably that which struck the South from January 28–February 4, 1951, causing some $50 million damage in Mississippi, $15 million in Louisiana, and nearly $2 million in Arkansas; this storm also caused 22 deaths. The region of greatest incidence, however, is a broad belt from Nebraska, Kansas, and Oklahoma eastward through the middle Atlantic and New England states.
Sleet
Ice storms are sometimes incorrectly referred to as sleet storms. Sleet can be easily identified as frozen raindrops (ice pellets) that bounce when hitting the ground or other objects. Sleet does not stick to trees and wires; but sleet in sufficient depth does cause hazardous driving conditions.
WINTER STORM IMPACT
Early winter storm records
Nearly everyone east of the Pacific coastal ranges remembers significant winter storms—days of heavy snow, interminable blizzards, inconvenience, economic loss, and sometimes, personal tragedy. For Wyoming, Kansas, and Texas, the blizzard of 1888 was one of the worst on record. January 11–13 of that year also brought the most disastrous blizzard ever known in Montana, the Dakotas, and Minnesota, combining gale winds, blowing snow, and extreme cold into a lethal, destructive push from the Rockies eastward. That same year, the eastern seaboard from Chesapeake Bay to Maine got its big storm of the century. On March 11–14, 1888, a blizzard dumped an average of 40 in of snow over southeastern New York and southern New England. The storm killed 200 in New York City alone; total deaths were over 400.
Effect of 1950s–60s storms
Large numbers of snow-related deaths—345 and 354— occurred in 1958 and 1960 respectively. About half of these
deaths occurred in New England, New York, and Pennsylvania. The 1966 season saw the eastern seaboard paralyzed by snow from Virginia through New England, with more than 50 deaths, and thousands marooned. A March storm buried the Dakotas, Minnesota, and Nebraska, with 30-ft drifts pushed up by winds gusting to more than 100 mph. The 1967 winter storm season was not much better, and included a May Day blizzard in the Dakotas and a nor'easter that brought snow and hurricane-force winds to northern New England late in May. Snowfall across middle America was as much as four times the normal amount in early 1968, and 1969 was called "the year of the big snows" in the Midwest.
The Blizzard of 1978
The winter of 1977–78 was unusually harsh, particularly in the Midwest and East. Its most devastating punch was the "Northeast Blizzard of 78," one of the worst of the twentieth century. On February 5–7, 1978, the blizzard created havoc along the eastern seaboard.
In New York City, the 17.7-in snowfall was the sixth largest since records began in 1869. Boston, Massachusetts, had over 2 ft of snow, as did Providence, Rhode Island. Winds of more than 55 mph caused massive snowdrifts, drove seas through seawalls, undermined homes, destroyed beaches (including Rocky Beaches on Long Island), breached protective dunes, and left many areas from Cape May, New Jersey, northward open to further damage from spring coastal storms. The American Red Cross reported 99 deaths and 4,587 injuries or illnesses attributable to the storm. Damage in Massachusetts exceeded $1.5 billion, while New York and New Jersey losses aggregated to about $94 million.
Superstorm, 1993
In March 1993, one of the nation's greatest non-tropical weather events occurred, adversely impacting 100 million individuals and severely crippling the commercial activity of the eastern one-third of the United States, as well as travel activities nationwide.
On March 12–14, 1993, 22 states in the eastern United States were subjected to the blizzard conditions (in the north) and high winds, coastal flooding, and convective weather (in the south) as the storm swept through the region. Record cold temperatures were noted in all affected areas.
Still recovering from Hurricane Andrew and a rash of tornadoes in Tampa Bay, Florida reported additional property damage costs of $1.6 billion; about one-third of the storm-related deaths occurred there. Thirty storm-related deaths and some $400 million in property damage were reported from the remainder of the southeastern United States. The mid-Atlantic and northeast, while sustaining significantly fewer storm-related deaths, suffered major economic misfortune due to the extensive slowdown of business activity.
The Blizzard of 1996
In early December 1995, lake-effect snowstorms caused record 24-hour snowfalls in Buffalo, New York, of 38 in, and in Sault Ste. Marie, Michigan, which was hit with 28 in December 9–10.
In mid-December, an unusually intense storm struck the Pacific Northwest. Heavy rains of 5–20 in accompanied the system, which featured very low pressures and high winds. Record low sea-level pressure readings were recorded at Astoria, Oregon (28.5 in), Seattle, Washington (28.6 in), and Medford, Oregon (28.9 in). Winds gusted to 119 mph at Sea Lion Caves, Oregon, and 103 mph at Angel Island, California. Six deaths and over two million power outages were attributed to the storm.
In the latter part of the month, Miami, Florida, failed to exceed 65°F for eight consecutive days—December 21–28—an all-time record for the city.
January proved to be quite cold over much of the nation (below normal in 37 states), with unusually heavy snowfall over most of the East. On January 6–8, much of the eastern seaboard received 1–3 ft of snow during the "Blizzard of '96." A large area from the southern Appalachians to southern New Hampshire and Maine received a foot or more, with 20 in or more very common over the major metropolitan areas of the East. However, upstate New York received very little snow as the storm featured a very pronounced western edge where snowfall ended.
The sudden warm-up that followed proved to be almost as deadly and damaging as the blizzard itself. Moderate-to-heavy rains (3.03 in over 24 hours at Williamsport, Pennsylvania) and rapid snowmelt triggered serious flooding along the Delaware, Susquehanna, upper Ohio, Potomac, and James River basins, with crests as high as 20 ft above flood stage.
Nearly 200 deaths were attributed to the blizzard and ensuing flooding; damages and costs totaled approximately $3 billion.
Snowiest U.S. Cities
Listed below are the snowiest U.S. cities. Average annual snowfall is shown parenthetically.
- Blue Canyon, CA (240.8 in)
- Marquette, MI (128.6 in)
- Sault Ste. Marie, MI (116.7 in)
- Syracuse, NY (111.6 in)
- Caribou, ME (110.4 in)
New England/New York, 1998
A catastrophic ice storm and flood event struck northern New England and northern New York during the first two weeks of January 1998. Heavy rain associated with a warm, moist air mass overspread a shallow but dense layer of cold air producing ice accumulations in excess of 3 in. The heavy rainfall, exceeding 4 in in some areas, combined with significant runoff from the melting snowpack to produce record flooding. The ice coated all outdoor surfaces, destroying the electric power infrastructure, toppling trees, collapsing outdoor structures, and threatening the lives of a large, distributed population. The flooding exacerbated the icing problems by forcing the evacuation of more than 1,000 homes and the closure of numerous roads. A record crest was observed on the Black River at Watertown, New York, where the river crested 2 ft above the previous flood of record.
Conservative damage estimates approach $0.5 billion. More than three million people in four states and two Canadian provinces were without electricity. In Maine, 80% of the state's population lost electrical service, some for more than two weeks. Residents were forced to find alternative means of heating their homes, pumping water, traveling, and communicating. Tens of thousands of trees were downed or severely damaged. Agricultural losses exceeded one million dollars as farmers were unable to milk their cows without electricity. National Guard units were activated and many counties in Maine, New York, Vermont, and New Hampshire were declared federal disaster areas. Despite its severity, duration, and scope, only seven fatalities were directly attributed to the event.
The New Year's 1999 Blizzard in the Midwest
The second-worst blizzard of the twentieth century (ranking behind the blizzard in January 1967) struck portions of the Midwest on January 1–3, 1999. The storm, which developed over the Texas panhandle, produced 9–22 in of snow in Chicago, Illinois, and strong northeast winds gusting to over 30 mph—and over 60 mph along the Lake Michigan shoreline. Soon after the snow ended, record low temperatures occurred with values of –20°F or lower in parts of Illinois and surrounding states on January 3 and 4. The areas with the heaviest snows—15 inches or more— included central and northern Illinois, southern Wisconsin, central and northern Indiana, southern Michigan, and northern Ohio.
Estimates of losses and recovery costs were $3–4 billion with 73 dead as a result of the storm. The governor of Illinois declared the entire state a disaster area on January 4, and on January 20, President Clinton declared 45 Illinois counties disaster areas (half the state) and subject to receiving federal relief. Areas of Indiana were also declared disaster areas.
Many of the worst impacts were associated with the storm's effects on transportation. Every form of Midwestern transportation was either halted or delayed by two to four days, and transportation problems were the source of many accidents and deaths. Auto- and train-related deaths totaled 39 with five more dead due to snowmobile accidents.
Railroad trains in the storm's heart were stalled or delayed by 12–24 hours, and since Chicago is the nation's rail hub, many priority shipments for the East and West Coasts were delayed, at great expense, by one to four days. The suburban train service of Chicago, one of the nation's finest, was overwhelmed by travelers who were unable to use normal vehicular transport, and three separate train accidents killed three. These and many other operational problems greatly slowed train service for three days.
Major auto accidents involving numerous vehicles occurred on major highways and interstates, causing more than 2,500 auto and truck accidents. Snow removal on city streets buried thousands of cars and driveway entrances, trapping many motorists without transportation, and it took up to a week after the storm before most vehicles had been extracted from these man-made snowbanks. Many traveling motorists became trapped on highways and thousands were housed in emergency shelters (churches and city buildings) for one to three nights.
The storm's impact on commercial aviation was staggering at Chicago and Detroit. Northwest Airlines reported more than 1,100 canceled flights during January 2–4, and United Airlines canceled 60% of its flights at Chicago's O'Hare Airport during the two-day storm. O'Hare had 300,000 travelers stranded for periods of hours up to four days. Costs were in the millions of dollars, and the stress on travelers was immense, particularly since the storm occurred on the weekend a day after New Year's Eve.
Navigation on the major Midwestern rivers was reduced by 50%. The cold temperatures during and after the storm created large ice floes on the Illinois and Mississippi Rivers, and these limited safe barge movement and the operation of locks and dams.
Coldest U.S. Cities
Listed below are the coldest cities in the United States. Average mean temperatures are listed parenthetically.
- International Falls, MN (36.4°F)
- Duluth, MN (38.2°F)
- Caribou, ME (38.9°F)
- Marquette, MI (39.2°F)
- Sault Ste. Marie, MI (39.7°F)
Human health was another area of major impact. There were 39 known deaths due to vehicle and train accidents. Five died in snowmobile accidents, two froze to death, and another 32 died of heart attacks resulting from overexertion, due mainly to snow shoveling. The storm also induced numerous illnesses and created a blood shortage in the nation since the Midwest is the prime source of fresh blood supplies and many donors could not reach hospitals to give blood.
Cities in the storm's main track experienced enormous problems and costs in achieving snow removal. Fortunately, the storm was accurately predicted several days in advance and most cities, such as Chicago, made major preparations that lessened the storm's long-term impacts. Most Chicago streets had been cleared by January 3, whereas other cities with less advance preparation like Detroit, Michigan, were still digging out a week after the storm. Chicago put 850 snow removal trucks on the streets (240 is the normal number for heavy snow). The cost of the snow removal and salt in the Chicago metropolitan area was $44 million ($14 million for snow removal at O'Hare Airport). Communities with populations of 100,000 typically reported storm costs of $250,000.
The huge effect on transportation produced major impacts on retail business and school openings. Most retailers were closed for one or two days, and lost business for several days after the storm, but those selling snow removal equipment typically sold out their supplies. The blocked streets and country roads led to multi-day school closings throughout the five-state area where the storm struck. Even by January 9, a week after the storm, only 47% of the students in Chicago schools were able to attend classes. School closings in the storm area ranged from three to seven days.
Warm weather returned to the Midwest by mid-January and the melting of the deep snow cover began. However, heavy rains with thunderstorms in the heavy snow areas occurred on January 17 and 20–22. This precipitation coupled with above-freezing temperatures brought rapid melting, dense fogs, and major flooding.
This weather pattern took on a spring-like flavor later in the month as milder temperatures returned to the lower half of the country. This trend in combination with fast-moving storms coming in from the Pacific spawned a record number of January tornadoes. Three significant tornado outbreaks occurred, resulting in 19 deaths. The first outbreak occurred on January 2 in southeast Texas and along the western Gulf coast, the second on January 17 in Tennessee, and the third on January 21–22, mostly in and near Arkansas and Tennessee. There were 169 tornadoes reported in January 1999—the highest number of tornadoes ever reported for January.
RECORD COLD GRIPS MUCH OF THE NATION IN NOVEMBER AND DECEMBER 2000: TWO-MONTH PERIOD IS THE COLDEST ON RECORD IN THE UNITED STATES
NOAA scientists announced that the United States national temperature during the November–December, 2000, two-month period was the coldest such period on record. The scientists worked with data from the world's largest statistical weather database at NOAA's National Climatic Data Center in Asheville, North Carolina.
Following the second coldest November on record in the United States, below normal temperatures continued to grip much of the nation in December. With an average temperature of 28.9°F, December 2000 was the seventh coldest December since national records began in 1895. Jay Lawrimore, chief of the Climate Monitoring Branch at the National Climatic Data Center, said, "Two months in a row of much below average temperatures resulted in the coldest November–December U.S. temperature on record, 33.8°F." This broke the old record of 34.2°F set in 1898. Near record cold temperatures for the same period occurred most recently in 1985 and 1983, when the nation's average temperature was 34.6°F and 34.8°F respectively, the third and fifth coldest such two-month periods on record.
Forty-three states within the contiguous United States recorded below average temperatures during the November– December period. The only states with near-normal temperatures were Nevada, New Mexico, New Hampshire, Vermont, and Maine. Severe winter conditions hit the central and southern Plains particularly hard. The coldest November– December on record occurred in Oklahoma, Arkansas, and Missouri, while six states experienced the second coldest such two-month period (Illinois, Iowa, Kansas, Texas, Louisiana, and Mississippi). For Dallas-Fort Worth, December 2000 was 7.5°F below normal at 39.4°F.
Heavy snow also accompanied the cold in many areas, particularly throughout the Plains and Upper Midwest. In Buffalo, New York, snowfall records were set during the three month period of October–December, where a total of 95.9 in broke the previous record of 92.2 in. At Midway Airport in Chicago, Illinois, snowfall records were set for a 24-hour period, where a total of 14.5 in broke the previous record set in December 1960.
December snowfall records were set in Marquette, Michigan, where a total of 89.5 in broke the previous record of 82.6 inches set in December 1981. Cities such as Milwaukee, Wisconsin; Waterloo, Iowa; and Amarillo, Texas, also set records for the most snowfall in the month of December. While precipitation amounts were normal to above normal throughout the central and eastern United States—except for the mid-Atlantic region—the West and Northwest regions (composed of Washington, Oregon, Indiana, Nevada, and California) recorded their fourth driest November–December since records began in 1895.
This prolonged cold outbreak came at the end of a year that began with the warmest winter on record in the United States. Above normal temperatures continued through the month of October and made the January–October 2000 period the warmest such ten-month period since national temperature records began in 1895. Preliminary data indicate that 2000 was the thirteenth warmest year on record in the United States, 1.2°F above the long-term average of 52.8°F.
Even though average long-term United States and global temperatures are warmer than they were a century ago, dramatic short-term swings in temperature are to be expected due to variability in circulation patterns. This variability can lead to periods of record cold temperatures while long-term trends remain positive. Although the United States has experienced periods of below average temperatures throughout the past century, temperatures have risen approximately 1°F since 1900.
During the same period global temperatures have increased at a rate near 1.1°F/century. Global temperatures in 2000 are expected to be similar to those recorded in 1999, the fifth warmest year since records began in 1880. The only years warmer were 1998, 1997, 1995, and 1990. The ten warmest years on record have all occurred since 1983.
SOUTHEASTERN U.S. ICE STORM OF DECEMBER 2002
Roughly 1.5 million homes were without power several days after the December 4–5, 2002, storm that moved from the southwestern U.S. to the eastern seaboard in about 48 hours. An armada of cherry–pickers helped to restore power to nearly 1.5 million people in the ice–coasted Carolinas. Six to eight inches or more of snow coated the mid-Atlantic region from Washington, D.C., northeastward into New England.
DANGERS OF WINTER STORMS
Winter storms can kill without breaking climatological records. Their danger is persistent, year-to-year. Since 1936, snowstorms have caused, directly and indirectly, about 200 deaths a year—and a year of 300 deaths is not unusual. Of such deaths, usually 70% are attributed to snowstorm-related automobile and other accidents; about 25% are caused by overexertion, exhaustion, and consequent fatal heart attack resulting from shoveling snow, pushing cars, and other snow-related physical labor. The remaining number, about 5%, are deaths due to home fires, carbon monoxide poisoning in stalled cars, electrocution from downed wires, and building collapse. Of deaths directly related to exposure to the cold, 50% are individuals over the age of 60; 75% are males; and about 20% of these deaths overall occur in homes.
WINTER WARNINGS
The terms watch and warning are used for winter storms, as for other natural hazards. The watch alerts the public that a storm has formed and is approaching the area. People in the alerted area should keep listening for the latest advisories over radio and television, and begin to take precautionary measures. The warning means that a storm is imminent and immediate action should be taken to protect life and property.
The word snow in a forecast, without a qualifying word such as occasional or intermittent , means that the fall of snow is of a steady nature and will probably continue for several hours without letup.
Heavy snow warnings are issued to the public when a fall of 4 in or more is expected in a 12-hour period, or a fall of 6 in or more is expected in a 24-hour period. Some variations on these rules may be used in different parts of the country. Where 4-in snowfalls are common, for example, the emphasis on heavy snow is generally associated with six or more inches of snow. In other parts of the country where heavy snow is infrequent or in metropolitan areas with heavy traffic, a snowfall of 2–3 in will justify a heavy snow warning.
Snow flurries are defined as snow falling for short durations at intermittent periods; however, snowfall during the flurries may reduce visibility to an eighth of a mile or less. Accumulations from snow flurries are generally small. Snow squalls are brief, intense falls of snow and are comparable to summer rain showers. They are accompanied by gusty surface winds.
Blowing and drifting snow generally occur together and result from strong winds and falling snow or loose snow on the ground. Blowing snow is defined as snow lifted from the surface by the wind and blown about to a degree that horizontal visibility is greatly restricted.
Drifting snow is used in forecasts to indicate that strong winds will blow falling snow or loose snow on the ground into significant drifts. In the northern Plains, the combination of blowing and drifting snow, after a substantial snowfall has ended, is often referred to as a ground blizzard.
Blizzards are the most dramatic and perilous of all winter storms, characterized by low temperatures and by strong winds bearing large amounts of snow. Most of the snow accompanying a blizzard is in the form of fine, powdery particles of snow that are whipped in such great quantities that at times visibility is only a few yards. Blizzard warnings are issued when winds with speeds of at least 35 mph are accompanied by considerable falling or blowing snow and temperatures of 20°F or lower are expected to prevail for an extended period of time.
Severe blizzard warnings are issued when blizzards of extreme proportions are expected and indicate wind with speeds of at least 45 mph plus a great density of falling or blowing snow and a temperature of 10°F or lower.
Hazardous driving (travelers') warnings are issued to indicate that falling, blowing, or drifting snow, freezing rain or drizzle, sleet, or strong winds will make driving difficult.
Livestock (stockmen's) warnings alert ranchers and farmers that livestock will require protection from a large accumulation of snow or ice, a rapid drop in temperature, or strong wind.
A cold-wave warning indicates an expected rapid fall in temperature within a 24-hour period that will require substantially increased protection to agricultural, industrial, commercial, and social activities. The temperature falls and minimum temperatures required to justify cold-wave warnings vary with the changing of the season and with geographic location. Regardless of the month or the section of the country, a cold-wave warning is a red-flag alert to the public that during a forthcoming forecast period a change to very cold weather will require greater-than-normal protective measures.
The terms storm , freezing rain , and freezing drizzle warn the public that a coating of ice is expected on the ground and on other exposed surfaces. The qualifying term heavy is used to indicate ice coating that, because of the extra weight of the ice, will cause significant damage to trees, overhead wires, and the like. Damage will be greater if the freezing rain or drizzle is accompanied by high winds.
NWS tests new winter weather warning index
On November 25, 1998, the National Weather Service's Cheyenne, Wyoming, office began testing a new storm-warning procedure that could result in a public-rating scale designed to better describe the potential impact of winter storms. The new rating system, created by forecasters in Cheyenne should let forecasters provide a winter watch and warning service more useful to those affected by taking into account variables such as wind and/or temperature—not just amount of snow—to rate a storm's impact.
Cheyenne forecasters devised the new index after an October 1997 storm dumped heavy snow on parts of Wyoming and Nebraska for 15 hours in gale-force winds. As the storm grew in strength, forecasts progressed from a winter storm watch to a snow advisory, a snow and blowing snow advisory and, finally, to a blizzard warning. More flexible locally adapted warning criteria could have saved time and made the frequent changes unnecessary.
The new index rates winter storms in five categories: one, a minor inconvenience; two, inconvenience; three, significant inconvenience; four, potentially life threatening; and five, life threatening. Winter storms are difficult to rate objectively on a number scale, as they do not have the same impact in all situations or locations; the NWS hopes that this more subjective index will be more useful to the public in preparing for a storm's impact.
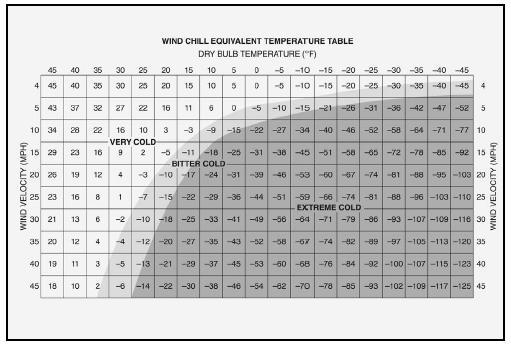
WIND CHILL INDEX
A reasonably satisfactory solution to that elusive characteristic of weather known as "coldness" was first proposed by Dr. Paul Siple in 1939. The term "wind chill" was used to describe the relative discomfort resulting from combinations of wind and temperature. The method used was not applicable to temperatures above 32°F and high wind speeds caused exaggerated windchill values. During the Antarctic winter of 1941, Siple and Passel developed a new formula to determine wind chill from experiments made at Little America. Measurements were made of the time required for the freezing of 8.8 oz of water in a plastic cylinder under a variety of conditions of wind and temperature. They assumed that the rate of heat loss was proportional to the difference in temperature between the cylinder and the temperature of the surrounding air. The results, expressed in kilocalories per square meter, per hour, per degree Celsius, were plotted against wind speed in meters per second.
Heat loss occurs by means of radiation, conduction, and convection. Combining all effects, the general equation for heat loss H is: H = (A + B √ v + Cv) Δ t . Within the equation, constants A , B , and C are equal to 10.45, 10.00, and –1.0 respectively. H is equal to heat loss (wind chill) in kilograms (kg) cals/m 2 /hr; v is wind speed in meters per second; and Δ t is the difference in degrees Celsius between neutral skin temperature of 33°F (0.6°C) and air temperature.
Blizzard Safety for Livestock
Blizzards take a terrible toll on livestock. For both humane and economic reasons, stockmen should take necessary precautions in advance of severe winter storms.
MOVE LIVESTOCK, ESPECIALLY YOUNG LIVESTOCK, INTO SHELTERED AREAS. Shelter belts, properly oriented and laid out, provide better protection for range cattle than shed-type shelters, which may cause cattle to overcrowd, leading to overheating and respiratory disorders.
HAUL EXTRA FEED TO FEEDING AREAS before the storm arrives. Storm duration is the largest determinant of livestock losses; if the storm lasts more than 48 hours, emergency feed methods are required. Range cattle are hardy and can survive extreme winter weather providing they have some nonconfining type of shelter from the wind and are able to feed at frequent intervals.
Autopsies of cattle killed by winter storms have shown the cause of death to be dehydration, not cold or suffocation. Because cattle cannot lick enough snow to satisfy their thirst, stockmen are advised to use heaters in water tanks to provide livestock with water and feed after prolonged exposure to winter storm conditions.
The constant A includes the cooling caused by radiation and conduction. The value of the constants A , B , and C varies widely in formulae presented by different investigators. This is to be expected since H also depends on certain properties of the body being cooled. The above formula measures the cooling power of the wind and temperature in
Winter Storm Safety Rules
Keep ahead of the winter storm by listening to the latest weather warnings and bulletins on radio and television.
CHECK BATTERY-POWERED EQUIPMENT BEFORE THE STORM ARRIVES. A portable radio or television set may be your only contact with the outside world during a winter storm. Also check emergency cooking facilities and flashlights.
CHECK YOUR SUPPLY OF HEATING FUEL. Fuel carriers may not be able to move if a winter storm buries your area in snow. Closing off unneeded rooms, stuffing towels or rags in cracks under doors, and covering windows at night will help retain heat when fuel supplies are exhausted.
CHECK YOUR FOOD and stock an extra supply. Your supplies should include food that requires no cooking or refrigeration in case of power failure. You will need to replenish your body with fluids to prevent dehydration; food provides the body with the energy necessary to generate its own heat.
PREVENT FIRE HAZARDS due to overheated coal or oil-burning stoves, fireplaces, heaters, or furnaces.
STAY INDOORS DURING STORMS unless you are in peak physical condition. If you must go out, avoid overexertion.
IF CAUGHT OUTSIDE find shelter, try to stay dry, and cover all exposed parts of the body. If no shelter is available, construct a lean-to, windbreak, or snow cave for protection. If possible, build a fire; it will draw attention to your location as well as provide warmth (especially if stones are placed around it to absorb and reflect the heat). Finally, avoid eating snow, as it lowers body temperature; melt it first.
DO NOT KILL YOURSELF SHOVELING SNOW. It is extremely hard work for anyone in less than prime physical condition, and can bring on a heart attack, a major cause of death during and after winter storms.
RURAL RESIDENTS: MAKE NECESSARY TRIPS FOR SUPPLIES BEFORE THE STORM DEVELOPS. Arrange for emergency heat supply in case of power failure; be sure camp stoves and lanterns are filled.
DRESS TO FIT THE SEASON. If you spend much time outdoors, wear loose-fitting, lightweight, warm clothing in several layers; layers can be removed to prevent perspiring and subsequent chill. Outer garments should be tightly woven, water repellent, and hooded. The hood should protect much of your face and cover your mouth to ensure warm breathing and protect your lungs from the extremely cold air. A warm, snug hat is very important since much of the body's heat loss is through the head. Remember that entrapped, insulating air, warmed by body heat, is the best protection against cold. Layers of protective clothing are more effective and efficient than single layers of thick clothing, and mittens, snug at the wrists, are better protection than fingered gloves.
AUTOMOBILE PREPARATIONS. Your automobile can be your best friend—or worst enemy—during winter storms, depending on your preparations. Get your car winterized before the storm season begins. Check the following before winter storms strike your area: ignition system; heater; battery; brakes; lights; tire treads; wiper blades; cooling system/defroster; fuel system; snow tires; lubrication; chains; exhaust system tight; and winter-grade oil. Keep water out of your fuel by maintaining a FULL tank of gasoline.
BE EQUIPPED FOR THE WORST. Carry a winter storm car kit, especially if cross-country travel is anticipated or if you live in the northern states. Suggested Winter Storm Car Kit: blankets or sleeping bags, matches and candles, empty 3-lb coffee can with plastic cover, facial tissue, paper towels, extra clothing, high-calorie, nonperishable food, bottled water, compass, road maps, knife, first-aid kit, shovel, sack of sand, flashlight or signal light, gas can, windshield scraper, booster cables, two tow chains, fire extinguisher, catalytic heater, and axe.
Safe Winter Auto Travel
Winter travel by automobile is serious business. Take your travel seriously. If possible, inform family members or friends of your travel plans (including routes, arrival/departure times, etc.).
- If the storm exceeds or even tests your limitations, seek available refuge immediately.
- Plan your travel and select primary and alternate routes.
- Check latest weather information on your radio.
- Try not to travel alone; two or three persons are preferable.
- Travel in convoy with another vehicle, if possible.
- Always fill gasoline tank before entering open country, even for a short distance.
- Drive carefully, defensively, watching for "black ice" on roadways.
If a Blizzard Catches You in Your Car
AVOID OVEREXERTION AND EXPOSURE. Exertion from attempting to push your car, shovel heavy drifts, and perform other difficult chores during the strong winds, blinding snow, and bitter cold of a blizzard may cause a heart attack—even for persons in apparently good physical condition.
STAY IN YOUR VEHICLE. Do not attempt to walk out into a blizzard. Disorientation comes quickly in blowing and drifting snow. Being lost in open country during a blizzard is almost certain death. You are more likely to be found, and more likely to be sheltered, in your car.
DO NOT PANIC.
KEEP FRESH AIR IN YOUR VEHICLE. Freezing wet snow and wind-driven snow can completely seal the passenger compartment.
BEWARE THE SILENT KILLERS: CARBON MONOXIDE AND OXYGEN STARVATION. Run the motor and heater sparingly, and only with the downwind window open for ventilation.
EXERCISE by clapping hands and moving arms, fingers, legs, and toes vigorously from time to time. To keep blood circulating, do not stay in one position for long.
TURN ON DOME LIGHT AT NIGHT to make the vehicle visible to work crews.
TIE a piece of material (preferably red) to your car's antenna or door. Once the snow has stopped, raise the hood, indicating engine problems.
KEEP WATCH. Do not permit all occupants of the car to sleep at once.
complete shade and does not consider the gain of heat from incoming radiation, either direct or diffuse. Under conditions of bright sunshine, the wind chill index should be reduced by about 200 kg/cals/m 2 /hr.
The wind chill index, or equivalent temperature, is based upon a neutral skin temperature of 91°F. With physical exertion, the body's heat production rises, perspiration begins, and heat is removed from the body by vaporization. The body also loses heat through conduction to cold surfaces with which it is in contact, and in breathing cold air, which results in the loss of heat from the lungs. The index, therefore, does not take into account all possible losses of heat from the body. It does, however, give a good measure of convective cooling, which is the major source of body heat loss.
HEATING-DEGREE DAYS
Early in the twentieth century heating engineers developed the concept of heating-degree days as a useful index of heating fuel requirements. They found that when the daily mean temperature is lower than 65°F, most buildings require heat to maintain an inside temperature of 70°F. The daily mean temperature is obtained by adding together the maximum and minimum temperatures reported for the day and dividing the total by two. Each degree of mean temperature below 65 is counted as one heating-degree day. Thus, if the maximum temperature is 70°F and the minimum 52°F, four heating-degree days would be produced. (70 + 52 = 122; 122 divided by 2 = 61; 65 – 61 = 4). If the daily mean temperature is 65°F or higher, the heating-degree day total is zero.
For every additional heating-degree day, more fuel is needed to maintain a comfortable 70°F indoors. A day with a mean temperature of 35°F—30 heating-degree days— would require twice as much fuel as a day with a mean temperature of 50°F—15 heating-degree days—assuming, of course, similar meteorological conditions such as wind speed and cloudiness. Each degree below 70°F that is called for as indoor temperature will conserve one heating-degree day where the measure is used in calculating fuel unit requirements.
The heating-degree concept has become so valuable that daily, monthly, and seasonal totals are routinely computed for all temperature-observing stations in the National Weather Service's network. Daily figures are used by fuel
companies for evaluation of fuel use rates and for efficient scheduling of deliveries. For example, if a heating system is known to use one gallon of fuel for every five heating-degree days, oil deliveries will be scheduled to meet this burning rate. Gas and electric company dispatchers use the data to anticipate demand and to implement priority procedures when demand exceeds capacity.
The amount of heat required to maintain a certain temperature level is proportional to the heating-degree days. A fuel bill usually will be twice as high for a month with 1,000 heating-degree days as for a month with 500. For example, it can be estimated that about four times as much fuel will be required to heat a building in Chicago, Illinois, where the annual average is 6,100 heating-degree days as it would to heat a building in New Orleans, Louisiana, where the average is about 1,500. All this is true only if building construction and living habits in these areas are similar. Since such factors are not constant, these ratios must be modified by actual experience. The use of heating-degree days has the advantage that consumption rates are fairly constant, i.e., fuel consumed for 100 degree days is about the same whether the 100 heating-degree days were accumulated on only three or four days or were spread over seven or eight days.
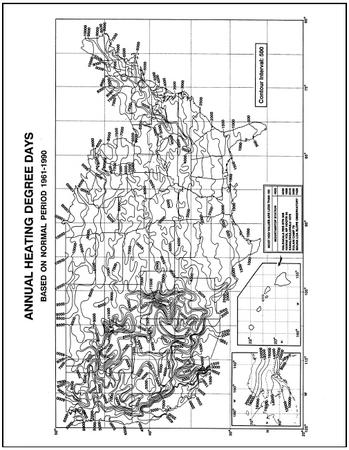
Accumulation of temperature data for a particular location has resulted in the establishment of "normal" values based on 30 years of record. NOAA's Environmental Data Service (EDS) publishes maps and tables of heating-degree day normals. The maps are useful only for broad general comparisons, because temperatures, even in a small area, vary considerably depending on differences in altitude, exposure, wind, and other circumstances. Tables of normal monthly and annual heating-degree days for U.S. cities provide a more accurate basis for comparison. The tables show, for instance, that Washington, D.C. (National Airport), has a normal annual total of 4,047 heating-degree days, while the normal for Boston, Massachusetts (Logan International Airport), is 5,641.
Heating-degree day comparisons within a single area are the most accurate. For example, March heating-degree day totals in the Midwest average about 70% of those for January. In Chicago, the coldest six months in order of decreasing coldness are January, December, February, March, November, and April. Annual heating-degree day data are published by heating season, which runs from July of one year through June of the next year. This enables direct comparison of seasonal heating-degree day data and seasonal heating fuel requirements.
HUMIDITY & INDOOR WINTER COMFORT
Compared with summer, when the moisture content of the air (relative humidity) is an important factor of body discomfort, the amount of moisture in the air in the winter has a lesser effect on the human body during outdoor winter activities. But moisture is a big factor for winter INDOOR comfort because of effects on health and energy consumption.
The colder the outdoor temperature, the more heat must be added indoors to be comfortable. That heat, however, dries the indoor air and lowers the indoor relative humidity. While a room temperature of 71–77°F may be comfortable for short periods under very dry conditions, prolonged exposure to dry air has varying effects on the human body and usually causes discomfort.
Dry air has been shown to have four main effects on the human body:
- Breathing dry air can cause such respiratory ailments as asthma, bronchitis, sinusitis, and nosebleeds; it may also cause general dehydration since body fluids are depleted during respiration.
- Skin moisture evaporation can cause skin irritations and eye itching.
- Irritative effects, such as static electricity, which causes mild shocks when metal is touched, are common when moisture is low.
- The "apparent temperature" of the air is lower than what the thermometer indicates, and the body "feels" colder.
Weather Anecdotes
March 23, 1987 … Colby Co., KS. An elderly couple became stranded and remained in their car through a second blizzard and were finally rescued April 4, 13 days later. They both suffered from exposure and were hospitalized. The man's feet were later amputated due to frostbite.
March 30, 1987 … Oldham Co., KY. A 8-year-old boy with his dog became disoriented and lost in the storm and wandered away from their home while playing in the snow. Rescuers found them 14 hours later and the boy said he used the dog as a blanket to try and keep warm. Wind chill was about 8°F. His only injury was numbness to his extremities.
April 25, 1997 … De Baca, Guadalupe, and Torrance Counties, NM. These three counties sustained losses of over 1 million dollars in lost sheep and cattle due to blizzard conditions. One ranch in eastern Torrance County lost 1,300 sheep from a herd of 1,700. Sheep loses totaled over 5,000 animals. Economic loses of sheep do not include the loss of over 4,000 unborn lambs.
These problems can be reduced by simply increasing the indoor relative humidity. By increasing the relative humidity to above 50% when the indoor temperature is between 71–77°F, most average-dressed persons will feel comfortable. This can be done by using humidifiers, vaporizers, steam generators, or large pans of water. Even wet towels or water in a bathtub will help. The lower the room temperature the easier the relative humidity can be brought to its desired level. A relative humidity indicator (hygrometer) may be of assistance in determining the humidity in the house.
How cold will you feel?
When the humidity is low, the body feels cooler than what the thermometer indicates. While the indoor temperature may read 75°F, the apparent temperature (what it feels like) may be warmer or cooler depending upon the moisture content (relative humidity) of the air. Apparent temperature can vary as much as 8°F when the relative humidity is in a range of 10–80%. Why? The human body cools when exposed to dry air because skin moisture evaporates, and the sense of coolness increases as humidity decreases. The drier the room, the cooler the skin feels. With a room temperature of 70°F, for example, a person will feel cooler if the humidity is low than if the humidity is high; this is especially noticeable when entering a dry room after bathing.