Heat & Humidity
TEMPERATURE TRENDS
During the past century, global surface temperatures have increased at a rate near 1.1°F per century, but this trend has dramatically increased to a rate approaching 3.6°F per century during the past 25 years. There have been two sustained periods of warming, one beginning around 1910 and ending around 1945, and the most recent beginning about 1976. Temperatures during the latter period of warming have increased at a rate comparable to the rates of warming projected to occur during the next century with continued increases of anthropogenic greenhouse gases.
Data collected by NOAA's polar orbiting satellites and analyzed for NOAA by the University of Alabama in Huntsville (UAH) and Remote Sensing Systems (RSS, Santa Rosa, California) indicate that temperatures centered in the middle troposphere at altitudes from 2 to 6 miles are also on pace to make 2002 the second warmest year for the globe.
The average lower troposphere temperature (surface to about 5 miles) for 2002 will also very likely be the second warmest on record. Analysis of the satellite record that began in 1979 shows that the global average temperature in the middle troposphere has increased, but the differing analysis techniques of the two teams result in different trends. The UAH team found an increase of 0.06°F per decade while a trend of 0.21°F per decade was found by the RSS team. This compares to surface temperature increases approaching 0.3°F per decade during the same period.
While lower tropospheric temperatures as measured by the MSU indicate increasing temperatures over the last two decades, stratospheric (9–14 miles) temperatures have been decreasing. This is consistent with the depletion of ozone in the lower stratosphere. The large increase in 1982 was caused by the volcanic eruption of El Chichon, and the increase in 1991 was caused by the eruption of Mt. Pinatubo in the Philippines.
Preliminary global temperatures for 2002
Global temperatures in 2002 are likely to be 1.03°F above the long-term (1880–2001) average, which will place 2002 as the second warmest year on record. The only warmer year was 1998, in which a strong El Niño contributed to higher global temperatures. Land temperatures are likely to be 1.66°F above average and ocean temperatures 0.76°F above the 1880–2001 mean. Both land and ocean temperature will very likely rank as second warmest on record.
Neutral ENSO conditions at the beginning of 2002 gave way to a strengthening El Niño episode during late boreal summer and continuing into early winter. Moderate positive anomalies of equatorial Pacific sea surface temperatures (El Niño conditions) are expected to persist through the early part of 2003.
The Northern Hemisphere temperature will very likely average near record levels in 2002 at 1.19°F above the long-term average. The Southern Hemisphere also reflected the globally warmer conditions, with a positive anomaly expected near 0.83°F.
In 2002 warmer temperatures and shifts in atmospheric circulation patterns contributed to the greatest surface melt on the Greenland Ice Sheet in the 24-year satellite record. There was also a record low level of Arctic sea ice extant in September, the lowest since satellite monitoring began in 1978, according to the National Snow and Ice Data Center.
Annual anomalies in excess of 1.8°F were widespread across much of North America and Asia.
The 1880–2001 average combined land and ocean annual temperature is 56.9°F, the annually averaged land temperature for the same period is 47.3°F, and the long-term annually averaged sea surface temperature is 60.9°F.
Preliminary United States temperatures for 2002
2002 will likely rank as one of the top 20 warmest years on record for the U.S., with an estimated temperature of 53.6°F. After beginning the year with much-above-average warmth, especially in the Northeast, 2002 ended with cooler-than-normal to near-average temperatures across much of the nation.
The 2001–2002 winter season (December to February) was the 9th warmest on record for the U.S., with much of the warmth occurring in the Northeast, which had its warmest winter on record. Spring (March to May) was near normal nationally with a warmer-than-average April compensating for a cooler March and May. However, the summer season (June to August) was one of the warmest in 108 years of national records. Summer 2002 was tied (with 1988) for the 3rd warmest, behind only 1936 and 1934. The 2002 fall season was near average, though September was the 7th warmest such month on record, followed by a cool October and near-average November.
The last three 5-year periods (1998–2002, 1997–2001, 1996–2000), have been the warmest 5-year periods in the last 108 years of national records, and the last 6-(1997–2002), 7-(1996–2002), 8-(1995–2002), 9-(1994–2002), and 10-year (1993–2002) periods have been the warmest on record for the U.S., illustrating the near-persistent warmth of the last decade.
A tenth or more of the country experienced very warm averages for seven months of the year, with two months, April and July, each exceeding 30%. More than 10% of the country was very cold in March and May, and more than a third of the country was very cold in October. Very warm and very cold conditions are defined as the warmest and coldest 10% of recorded temperatures, respectively.
2002 is on pace to be the warmest on record for Delaware and the second warmest for Maryland and New Jersey. Fourteen other states will likely be much warmer than normal during 2002. No state in the contiguous U.S. has averaged below normal for the year.
Annual temperatures averaged across the state of Alaska will approach or exceed record levels for 2002, with every season in Alaska averaging above normal. Fall 2002 was the warmest September–November on record for the state. Nine states in the Northeast and Midwest had their warmest winter on record, and the Southwest region had its warmest summer on record. Three states (Colorado, Maryland, and Delaware) also broke summer warmth records.
Data collected by NOAA's TIROS–N polar-orbiting satellites and adjusted for time-dependent biases by NASA and the Global Hydrology and Climate Center at the University of Alabama in Huntsville, indicate that temperatures in the lower half of the atmosphere (lowest 8 km of the atmosphere) were above the 20-year (1979–1998) average for 2002 for the 5th consecutive year and ranked as the 8th warmest such period since 1979.
Global temperatures—2001
Global temperatures in 2001 were 0.92°F* above the long-term (1880–2000) average**, which makes 2001 the third warmest year on record. The only warmer years were 2002 and 1998, in which a strong El Niño contributed to higher global temperatures. Land temperatures were 1.35°F* above average and ocean temperatures 0.72°F* above the 1880–2000 mean.
*Updated anomalies using most recent station data and NCEP OI Version 2 anomalies. **The 1880–2000 average combined land and ocean annual temperature is 56.9°F, the annually averaged land temperature for the same period is 47.3°F, and the long-term annually averaged sea surface temperature is 60.9°F.
A weak La Niña persisted into early 2001 in the tropical Pacific, but neutral ENSO conditions developed and were maintained throughout the latter half of the year. Near-normal or weak positive anomalies (El Niño) conditions are expected to persist through the early part of 2002.
The Northern Hemisphere temperature continued to average near record levels in 2001 at 1.08°F above the long-term average. The Southern Hemisphere also reflected the globally warmer conditions, with a positive anomaly of 0.77°F.
Annual anomalies in excess of 1.8°F were widespread across North America and much of Europe and the Middle East.
2000: A YEAR OF RECORD WARMTH
Temperature Trends—2000
The year 2000 began with record warmth and ended with colder than normal temperatures across much of the country. However, annual United States and global temperatures remained well above normal.
The U.S. national temperature was above average during 2000 according to statistics calculated by scientists working from the world's largest statistical weather database at NOAA's National Climatic Data Center in Asheville, North Carolina.
After beginning with record winter warmth, the year 2000 ended with colder than normal temperatures across much of the nation. This does not, however, alter the fact that the year 2000 was also one of the top 20 warmest years on record in 106 years. The average temperature in the United States was 54.0°F.
Heat waves and drought plagued much of the southern and western United States in 2000, while the Midwest and northeastern United States experienced prolonged periods of cooler and wetter than normal conditions. July 2000 was the coolest July on record in Pennsylvania and West Virginia, and the second coolest in New York. Precipitation was above average in 15 states throughout the Northeast and Midwest during the summer months (June–August).
By August 2000, 36% of the nation was in severe to extreme drought, although precipitation in the following months significantly reduced the severity of drought in many areas. The widespread drought contributed to one of the worst U.S. wildfire seasons in 50 years. More than 7 million acres of forests and grasslands were consumed by fire in 2000 with the greatest losses in western states, particularly Idaho and Montana, and estimated losses nationwide of more than $1 billion.
Global temperatures in 2000 were also warmer. Temperatures were 0.7°F above the long-term (1880–2000) average(56.9°F), the 8th warmest year on record. The only warmer years were 1998, 1997, 1995, 1990, 1999, 2001, and 2002. Land temperatures were 1.1°F above the average, 47.3°F, and ocean temperatures 0.5°F above the 1880–2000 mean of 60.9°F.
A strong La Niña at the beginning of 2000 weakened during July and August, but was still evident at year's end.
HOW ORDINARY SUMMER HEAT DEVELOPS
Given terrain and geographic situation, North American summers are bound to be hot. As the advancing Sun drives back the polar air, the land is opened up to light and solar heat, and occupied by masses of moist, warm air spun land-ward off the tropical ocean. With these rain-filled visitors come the tongues of dry desert air that flick northward out of Mexico, and, occasionally, the hot winds called chinooks that howl down the Rockies' eastern slopes.
Inequalities of atmospheric heating and cooling, of moistness and aridity, are regulated at middle latitudes by horizontal and vertical mixing. The mixing apparatus is the parade of cyclones (low-pressure centers, or lows) and anti-cyclones (high-pressure centers, or highs) that lie at the heart of most weather, good and bad.
The cyclones and anticyclones drift in the mid-latitude westerlies, the prevailing eastward-blowing winds that follow a scalloped path around the Northern Hemisphere. The large-scale undulations of these winds may extend for thousands of miles, and are called planetary waves. Their high-speed core is the jet stream, which snakes across the continent some 6–8 mi up, keeping mainly to the cool side of highs and lows as they form and spin and die below it.
The strength of the jet stream itself varies, and therefore, it rarely moves across a hemisphere as one continuous river of air. Generally, its segments span 1,000–3,000 mi, with a width of 100–400 mi, and a thickness of 3,000–7,000 ft. A jet stream's winds can be as low as 50 knots or as high as 300; frequently the jet stream wind speed settles at 100–150 knots.
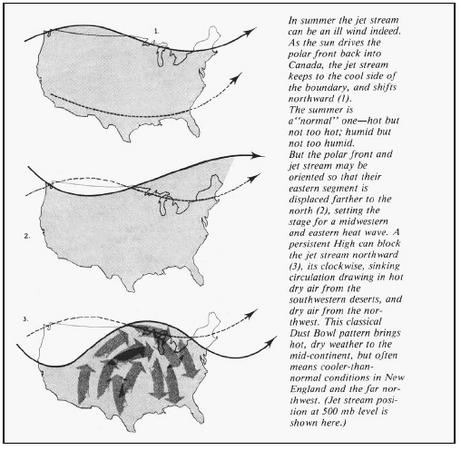
The kind of weather predominating in an area over a period of time depends largely on the prevailing position and orientation of the jet stream. As the continent warms, the jet stream shifts northward, along with the tracks of surface weather disturbances. Cyclones like the ones that brought April rains to the Gulf states bring June thundershowers to the Plains; the humid spring of Georgia becomes the muggy summer of Illinois. These semi-regular alternations of instability and equilibrium, hot and cool, moist and dry, combine year-in and year-out to generate the average June– September climate for North America.
How heat waves occur
When these alternating processes are somehow interrupted, the climatic "norm" of summer is impacted by a heat wave. The anomaly is usually associated with a change in the planetary waves, so that the prevailing winds from the southwestern deserts sweep farther north than usual and blanket a large region with hot, often humid air at ground level. An upper-level high may settle over the mid-continent, destroying cloud cover with its descending, compression-heated currents, until the blessing of fair weather turns to the curse of drought. In addition, heat from the hot, dry ground feeds back into the atmosphere, tending to perpetuate the heat-wave circulation.
Whatever the cause, the effect is uncomfortable and dangerous. Continental heat waves live in human memory the way fierce winters do.
THE HUMAN BODY'S REACTION TO HEAT
To keep on the cool side of their upper thermal limits, our bodies dissipate heat by varying the rate and depth of blood circulation, by losing water through the skin and sweat glands, and, as the last extremity is reached, by panting. Under normal conditions, these reflex activities are kept in balance and controlled by the brain's hypothalamus, a comparatively simple sensor of rising and falling environmental temperatures, and a sophisticated manager of temperatures inside the body.
Most Humid U.S. Cities
- Quillayute, WA
- Olympia, WA
- Port Arthur, TX; Lake Charles, LA; Gainesville, FL; Apalachicola, FL; Corpus Christi, TX (tie)
- New Orleans, LA; Eugene, OR; Houston, TX (tie)
Least Humid U.S. Cities
- Las Vegas, NV
- Phoenix, AZ
- Yuma, AZ
- Tucson, AZ
- El Paso, TX
Like the hot light in a car, the hypothalamus responds to the temperature of coolant, in this case, blood. A surge of blood heated above 98.6°F sends the hypothalamus into action. As its orders go out, the heart begins to pump more blood, blood vessels dilate to accommodate the increased
flow, and the bundles of tiny capillaries threading through the upper layers of the skin are put into operation. The body's blood is circulated closer to the skin's surface, and excess heat drains off into the cooler atmosphere. At the same time, water diffuses through the skin as insensible perspiration, so called because it evaporates before it becomes visible, and the skin seems dry to the touch.
Heat loss from increased circulation and insensible perspiration is a comparatively minor correction. If the hypothalamus continues to sense overheating, it calls upon the millions of sweat glands that perforate the outer layer of our skin. These tiny glands can shed great quantities of water (and heat) in what is called sensible perspiration, or sweating. Between sweating and insensible perspiration, the skin handles about 90% of the body's heat-dissipating function.
As environmental temperature approaches normal body temperature, physical discomfort is replaced by physical danger. The body loses its ability to get rid of heat through the circulatory system, because there is no heat-drawing drop in temperature between the skin and the surrounding air. At this point, the skin's elimination of heat by sweating becomes virtually the only means of maintaining constant temperature.
Most water enters the atmosphere via the process of evaporation, the jump from liquid to vapor phase; to do this, a water molecule must absorb enough energy to break the tenacious clutch of its fellow molecules. Evaporation, consequently, has the effect of absorbing large quantities of energy in the form of latent heat, which cools the parent body. This is familiar to anyone who has stepped from a bath into a dry room. The breakdown of the evaporation process when one steps from a bath into a hot, moist room is just as familiar.
Sweating, by itself, does nothing to cool the body, unless the water is removed by evaporation—and high relative humidity retards evaporation. Under conditions of high temperature (above 90°F) and high relative humidity (above 75%), the body is doing everything it can to maintain 98.6°F inside. The heart is pumping a torrent of blood through dilated circulatory vessels, the sweat glands are pouring liquids—and essential dissolved chemicals, like sodium and chloride— onto the surface of the skin. And the body's metabolic heat production goes on in the vital organs. When thermal limits are exceeded by very much or for very long, the warm-blooded organism does not doze, reptile fashion—it dies.
A study of three September heat waves in Los Angeles and Orange County, California, shows what excessive temperature alone can do. Without the complicating factors of high humidity or air pollution, the heat waves were accompanied by an increased mortality, especially among the elderly. The California study agreed with other research that showed that increased mortality in a heat wave tends to follow maximum temperatures by about one day—the day it takes to overwork a tired circulatory system. The causes of "extra" deaths in September 1963 would seem to bear this out. Most were assigned to coronary and cerebrovascular disease. Heat syndrome was almost absent.
Heat syndrome refers to several clinically recognizable disturbances of the human thermoregulatory system. The disorders generally have to do with a reduction or collapse of the body's ability to shed heat by circulatory changes and sweating, or a chemical (salt) imbalance caused by too much sweating. Ranging in severity from the vague malaise of heat asthenia to the extremely lethal heat stroke, heat syndrome disorders share one common feature: the individual has overexposed or over-exercised for his or her age and physical condition for the thermal environment. Studies of heat syndrome and its victims indicate that it occurs at all ages, but, other things being equal, the severity of the disorder tends to increase with age—heat cramps in a 17-year-old may be heat exhaustion in someone age 40, and heat stroke in a person over 60.
Sunburn, while not categorized as heat syndrome, is pertinent here, for ultraviolet radiation burns can significantly retard the skin's ability to shed excess heat.
Acclimatization has to do with adjusting sweat-salt concentrations, among other things. In winter and summer, this concentration changes, just as it does when one moves from Boston to Panama. The idea is to lose enough water to regulate body temperature, with the least possible chemical disturbance. Because females appear to be better at this than males—females excrete less sweat and so less salt—heat syndrome usually strikes fewer females.
Climatic stress is worse for people with heart disease than for others. In a hot, humid environment, impaired evaporation and water loss hamper thermal regulation, while physical exertion and heart failure increase the body's rate of heat production. The ensuing cycle is vicious in the extreme.
Heat Index
It isn't the heat; it's the humidity. The job of keeping the body cool falls increasingly upon the evaporation of sweat as the temperature rises. Meanwhile, the other forms of heat dissipation such as radiation and convection, which depend upon temperature differences between the skin and surroundings, are reduced in effectiveness. In turn, the rate of evaporation of sweat is influenced by the humidity in the surrounding air. (Wind speed and thermal radiation are also factors.)
Rules to Heat Wave Safety
- SLOW DOWN. Your body cannot do its best in high temperature and humidity, and might do its worst.
- HEED YOUR BODY'S EARLY WARNINGS THAT HEAT SYNDROME IS ON THE WAY. Reduce your level of activities immediately and get to a cooler environment.
- DRESS FOR SUMMER. Lightweight, light-colored clothing reflects heat and sunlight, and helps your thermoregulatory system maintain normal body temperature.
- EAT SMALL MEALS AND EAT MORE OFTEN. Avoid foods that are high in protein, which increase metabolic heat production and increase water loss.
- DO NOT DRY OUT. Heat wave weather can wring you out before you know it. Drink plenty of water or other non-alcoholic fluids while the hot spell lasts, even if you do not feel thirsty.
- AVOID THERMAL SHOCK. Acclimatize yourself gradually to warmer weather. Be extra careful for those first critical two or three hot days.
- VARY YOUR THERMAL ENVIRONMENT. Physical stress increases with exposure time in heat-wave weather. Try to get out of the heat for at least a few hours each day. If you cannot do this at home, drop into a cool store, restaurant, or theater— anything—to keep your exposure time down.
- DO NOT GET TOO MUCH SUN. Sunburn makes the job of heat dissipation that much more difficult.
- KNOW THE HEAT SYNDROME SYMPTOMS AND FIRST AID.
Discomfort is usually a complaint as soon as sweating begins, although, to be sure, the discomfort and heat stress on the body would be much greater if one could not sweat. Clothing reduces the effectiveness of sweating, but it is needed for protection from the Sun. In order to reflect heat
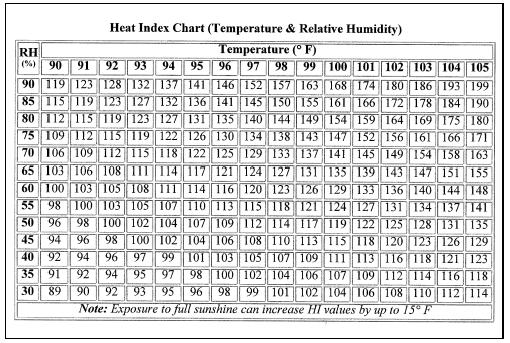
| Heat Index Chart (Temperature & Relative Humidity) | ||||||||||||||||
| RH% | Temperature (°F) | |||||||||||||||
| 90 | 91 | 92 | 93 | 94 | 95 | 96 | 97 | 98 | 99 | 100 | 101 | 102 | 103 | 104 | 105 | |
| Note: Exposure to full sunshine can increase HI values by up to 15° F | ||||||||||||||||
| 90 | 119 | 123 | 128 | 132 | 137 | 141 | 146 | 152 | 157 | 163 | 168 | 174 | 180 | 186 | 193 | 199 |
| 85 | 115 | 119 | 123 | 127 | 132 | 136 | 141 | 145 | 150 | 155 | 161 | 166 | 172 | 178 | 184 | 190 |
| 80 | 112 | 115 | 119 | 123 | 127 | 131 | 135 | 140 | 144 | 149 | 154 | 159 | 164 | 169 | 175 | 180 |
| 75 | 109 | 112 | 115 | 119 | 122 | 126 | 130 | 134 | 138 | 143 | 147 | 152 | 156 | 161 | 166 | 171 |
| 70 | 106 | 109 | 112 | 115 | 118 | 122 | 125 | 129 | 133 | 137 | 141 | 145 | 149 | 154 | 158 | 163 |
| 65 | 103 | 106 | 108 | 111 | 114 | 117 | 121 | 124 | 127 | 131 | 135 | 139 | 143 | 147 | 151 | 155 |
| 60 | 100 | 103 | 105 | 108 | 111 | 114 | 116 | 120 | 123 | 126 | 129 | 133 | 136 | 140 | 144 | 148 |
| 55 | 98 | 100 | 103 | 105 | 107 | 110 | 113 | 115 | 118 | 121 | 124 | 127 | 131 | 134 | 137 | 141 |
| 50 | 96 | 98 | 100 | 102 | 104 | 107 | 109 | 112 | 114 | 117 | 119 | 122 | 125 | 128 | 131 | 135 |
| 45 | 94 | 96 | 98 | 100 | 102 | 104 | 106 | 108 | 110 | 113 | 115 | 118 | 120 | 123 | 126 | 129 |
| 40 | 92 | 94 | 96 | 97 | 99 | 101 | 103 | 105 | 107 | 109 | 111 | 113 | 116 | 118 | 121 | 123 |
| 35 | 91 | 92 | 94 | 95 | 97 | 98 | 100 | 102 | 104 | 106 | 107 | 109 | 112 | 114 | 116 | 118 |
| 30 | 89 | 90 | 92 | 93 | 95 | 96 | 98 | 99 | 101 | 102 | 104 | 106 | 108 | 110 | 112 | 114 |
and enhance circulation of air, hot-weather clothing should be light colored, lightweight, porous, and loose fitting. For most individuals, cotton or high-cotton blends are still the best hot weather fabrics.
Livestock weather safety index
Livestock, like human beings, are subject to heat stress that is variable not only with temperature but with different combinations of temperature and relative humidity. This is particularly true for animals that are confined or being loaded or transported.
Additional hazard: the effect of calm, cloudless days
Lack of cloud cover and little or no movement of air are additional hazards that can increase stress and should be considered. An emergency situation is most likely to develop when the temperature is 90–95°F early in the day, and higher temperatures are forecast for the period that the livestock will be in the marketing process. Additional stress created by handling livestock should be kept at an absolute minimum.
Reduction of hazard: the effect of wind
The cooling effect of wind can alleviate conditions by lowering temperature a few degrees in open areas. However, when the air temperature approaches the skin temperature of the animal, the cooling effect of wind becomes minimal.
Acclimatization
Hot, humid weather is more detrimental to livestock in the early summer than in mid- or late summer and during any season following an extended cool period. This heat tolerance has not been qualified but should be considered during periods of marginal danger or emergency categories.
Hogs are a special problem
Most livestock do not adjust readily to high temperatures (heat stress). Hogs are especially vulnerable when closely confined in a vehicle, building, or pen. A careful study by Livestock Conservation, Inc. (Chicago, Illinois) of the relationship of hog deaths during the marketing process shows that high temperatures, especially with high relative humidity, cause abnormally high losses.
Heat builds up internally in the hog's body if it cannot be thrown off by the lungs or skin. If the internal temperature reaches 105–106°F, heat exhaustion occurs and will be followed by death unless the situation is relieved.
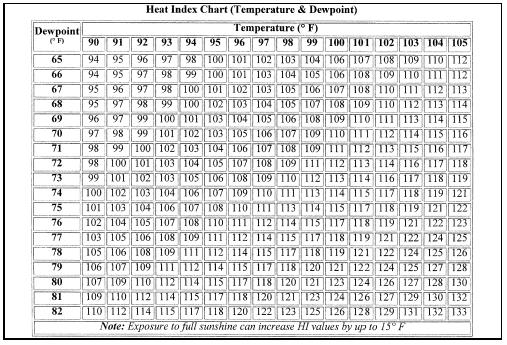
| Heat Index Chart (Temperature & Relative Humidity) | ||||||||||||||||
| Dewpoint (° F) | Temperature (° F) | |||||||||||||||
| 90 | 91 | 92 | 93 | 94 | 95 | 96 | 97 | 98 | 99 | 100 | 101 | 102 | 103 | 104 | 105 | |
| Note: Exposure to full sunshine can increase HI values by up to 15° F | ||||||||||||||||
| 65 | 94 | 95 | 96 | 97 | 98 | 100 | 101 | 102 | 103 | 104 | 106 | 107 | 108 | 109 | 110 | 112 |
| 66 | 94 | 95 | 97 | 98 | 99 | 100 | 101 | 103 | 104 | 105 | 106 | 108 | 109 | 110 | 111 | 112 |
| 67 | 95 | 96 | 97 | 98 | 100 | 101 | 102 | 103 | 105 | 106 | 107 | 108 | 110 | 111 | 112 | 113 |
| 68 | 95 | 97 | 98 | 99 | 100 | 102 | 103 | 104 | 105 | 107 | 108 | 109 | 110 | 112 | 113 | 114 |
| 69 | 96 | 97 | 99 | 100 | 101 | 103 | 104 | 105 | 106 | 108 | 109 | 110 | 111 | 113 | 114 | 115 |
| 70 | 97 | 98 | 99 | 101 | 102 | 103 | 105 | 106 | 107 | 109 | 110 | 111 | 112 | 114 | 115 | 116 |
| 71 | 98 | 99 | 100 | 102 | 103 | 104 | 106 | 107 | 108 | 109 | 111 | 112 | 113 | 115 | 116 | 117 |
| 72 | 98 | 100 | 101 | 103 | 104 | 105 | 107 | 108 | 109 | 111 | 112 | 113 | 114 | 116 | 117 | 118 |
| 73 | 99 | 101 | 102 | 103 | 105 | 106 | 108 | 109 | 110 | 112 | 113 | 114 | 116 | 117 | 118 | 119 |
| 74 | 100 | 102 | 103 | 104 | 106 | 107 | 109 | 110 | 111 | 113 | 114 | 115 | 117 | 118 | 119 | 121 |
| 75 | 101 | 103 | 104 | 106 | 107 | 108 | 110 | 111 | 113 | 114 | 115 | 117 | 118 | 119 | 121 | 122 |
| 76 | 102 | 104 | 105 | 107 | 108 | 110 | 111 | 112 | 114 | 115 | 117 | 118 | 119 | 121 | 122 | 123 |
| 77 | 103 | 105 | 106 | 108 | 109 | 111 | 112 | 114 | 115 | 117 | 118 | 119 | 121 | 122 | 124 | 125 |
| 78 | 105 | 106 | 108 | 109 | 111 | 112 | 114 | 115 | 117 | 118 | 119 | 121 | 122 | 124 | 125 | 126 |
| 79 | 106 | 107 | 109 | 111 | 112 | 114 | 115 | 117 | 118 | 120 | 121 | 122 | 124 | 125 | 127 | 128 |
| 80 | 107 | 109 | 110 | 112 | 114 | 115 | 117 | 118 | 120 | 121 | 123 | 124 | 126 | 127 | 128 | 130 |
| 81 | 109 | 110 | 112 | 114 | 115 | 117 | 118 | 120 | 121 | 123 | 124 | 126 | 127 | 129 | 130 | 132 |
| 82 | 110 | 112 | 114 | 115 | 117 | 118 | 120 | 122 | 123 | 125 | 126 | 128 | 129 | 131 | 132 | 133 |
Hogs lose about 80% of their body heat through the lungs when the environmental temperature is above 80°F; only 20% is lost from the skin by radiation and air movement. Hogs must breathe approximately 20 times as much air at 100°F as at 80°F to maintain a safe internal body temperature (around 102°F) when the environmental temperature is 100°F.
HEAT WAVE DANGERS
In a "normal" year, about 151 Americans die from summer heat and too much Sun—"excessive heat and insolation" is the vital statistics category. Among our family of natural hazards, only the excessive cold of winter—not lightning, hurricanes, tornadoes, floods, earthquakes, or tsunamis—takes a greater average toll.
Tragic consequences of heat waves
In 1986–99, at least 2,115 persons were killed in the United States by the effects of heat and solar radiation. At least 1,021 people succumbed to heat in the Midwest in 1995. These are direct casualties. It is not known how many deaths are brought on by excessive heat or solar radiation— for example, how many diseased or aging hearts surrender that would not have under better conditions. Heat waves bring great stresses to the human body; among the aged or infirm are many whose systems cannot withstand the extreme summer conditions.
Most summers see heat waves in one section or another of the United States. East of the Rockies, they tend to be periods of high temperatures and humidity—although the worst have been catastrophically dry. There is evidence that heat waves are worse in the airless brick and asphalt canyons of the inner cities than in the better-lawned, more open suburbs. Among the big ones are the hot summer of 1830, which scorched the north-central interior, and that of 1860, which dried up the Great Plains. July 1901 saw high temperatures in the Middle West that resulted in 9,508 heat deaths.
Heat waves, 1930s–1960s
There is nothing in American climatological annals to touch the heat waves that came with the Dust Bowl droughts of the 1930s. The years 1930, 1934, and 1936 brought progressively more severe summer weather. Record highs of 121°F in North Dakota and Kansas, and 120°F in South Dakota, Oklahoma, Arkansas, and Texas were observed in the summer of 1936; July and August of that year saw record highs of 109°F or better tied or broken in Indiana, Louisiana, Maryland, Michigan, Minnesota, Nebraska, New Jersey, Pennsylvania, West Virginia, and Wisconsin.
These were cruel years in terms of heat deaths. From 1930 through 1936—ranging from a low of 678 deaths in 1932 to 4,768 in 1936—heat killed nearly 15,000 persons. The toll is consistently high, but tends sharply upward with increases in average July temperatures. This relationship between excessive July heat and significant jumps in heat deaths persists to the present day, despite the softening effects of modern consumer technology.
The second half of the century also reported a significant number of heat deaths. Many states had their hottest summer of record in 1952; that year's death toll—1,401—is the highest for the 1950–67 period. The summer of 1954, a year when heat killed 978, was almost as bad. The heat wave of July 1966 covered much of the eastern and middle continent with high temperatures and very high humidity. Over 400 people died as a result of the heat wave (as compared to nearly 100 in 1965).
Heat waves of 1980, 1993, 1995, and 1998–2000
One of the most tragic heat waves since the 1930s occurred in 1980, according to the National Center for Health Statistics. That year unusually high temperatures held the central and southwestern United States in their grip for the best part of 15 weeks, and directly or indirectly caused 1,700 deaths. This total, which also includes occupationally related heat deaths, is more than nine times that of an ordinary year.
The 1980 heat wave began about June 10, and—except for remissions from about July 21 to about August 10, and August 17 to about September 1—lasted continuously through September's third week. As an example of its intensity, the first week of September saw temperatures of 9°F above normal over much of the central and eastern states.
On the weekend of July 14, 1993, states throughout the Midwest reported record high temperatures. Chicago, Illinois, experiencing its worst heat emergency until 1995, attributed nearly 500 deaths (primarily senior citizens) to the heat or to heat-related activities. Later in the summer, the municipal government developed and implemented heat-crisis plans that included setting up "cooling centers" and contacting senior citizens (to offer fans or transportation to cooling centers, etc.).
On July 13–15, 1995, approximately 70 daily maximum temperature records were set at locations from the central and northern Great Plains to the Atlantic coast. The July 1995 heat wave in Chicago, Illinois, and Milwaukee, Wisconsin, was a highly rare, and in some respects, unprecedented event in terms of both unusually high maximum and minimum temperatures and the accompanying high relative humidity. Chicago experienced its worst weather-related disaster, with 465 heat-related deaths recorded during July 11–27. Milwaukee was also severely affected, with 85 heat-related deaths recorded during the same period. The number of deaths in Chicago and Milwaukee exceeds the average number of lives lost each year in the United States to all floods, hurricanes, and tornadoes.
Heat waves of the late 1990s were not without tragedy. In 1998, a heat wave in Texas killed more than 120 people. In 1999, there were 497 heat related deaths in the United States, more than five times the 92 deaths caused by tornadoes. Even in 2000, heat caused the death of 19 people in a San Francisco Bay area heat wave in June.
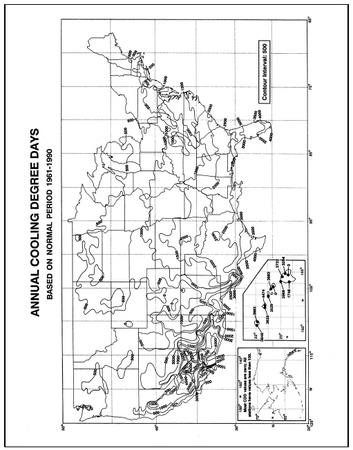
COOLING-DEGREE DAYS
The cooling-degree day statistic—summer sister of the familiar heating-degree day—serves as an index of airconditioning requirements during the year's warmest months.
According to experts, the need for air-conditioning begins to be felt when the daily maximum temperature climbs to 80°F and higher. The cooling-degree day is therefore a kind of mirror image of the heating-degree day. After obtaining the daily mean temperature—by adding together the day's high and low temperatures and dividing the total by two— the base 65 is subtracted from the resulting figure to determine the cooling-degree day total. For example, a day with a maximum temperature of 82°F and a minimum of 60°F would produce six cooling-degree days. (82 + 60 = 142; 142 divided by 2 = 71; 71 – 65 = 6). If the daily mean temperature is 65°F or lower, the cooling-degree day total is zero.
Hottest U.S. Cities
Listed below are the hottest U.S. cities. Mean average temperature is shown parenthetically.
- Key West, FL (77.7°F)
- Miami, FL (75.6°F)
- West Palm Beach, FL (74.6°F)
- Fort Myers, FL and Yuma, AZ (73.9°F)
- Brownsville, TX (73.6°F)
The greater the number of cooling-degree days, the more energy is required to maintain indoor temperatures at a comfortable level. However, the relationship between cooling-degree days and energy use is less precise than that between heating-degree days and fuel consumption. There is considerable controversy among meteorologists, as well as airconditioning engineers, as to what meteorological variables are most closely related to energy consumption by airconditioning systems. Many experts argue that because high-humidity levels make people feel more uncomfortable as temperatures rise, some measure of moisture should be included
in calculating energy needs for air-conditioning. In addition to humidity some experts feel there are other factors, such as cloudiness and wind speed, that should be included in computation of energy needs for air-conditioning. All agree, however, that there is a need for a more effective measure of the influence of weather on air-conditioning loads.
Until a definitive study of the problem is conducted, NOAA's EDS is continuing to use and publish statistics based on simple cooling-degree-day calculations, employing air temperatures measured at National Weather Service (NWS) offices and cooperating stations throughout the country. As with heating-degree days, normals of cooling-degree days have been established, based on 30 years of record. It should be noted that heating- and cooling-degree days do not cancel each other out. Totals for each are accumulated independently.
NATIONAL WEATHER SERVICE WARNINGS
Many forecast offices of the NWS (NOAA, U.S. Department of Commerce) issue Danger and/or Emergency Warnings. If potential users are unaware of this program they should contact their local weather service office or agricultural extension agent for information on service in their region.
Global warming
This section is based on a brief synopsis of the 2001 report by the Intergovernmental Panel on Climate Change, the U.S. National Assessment, published by the U.S. Global Change Research Program in the year 2000, and the National Research Council's 2001 report "Climate Change Science: An Analysis of Some Key Questions," as well as the National Climatic Data Center's (NCDC) own data resources. It was prepared by David Easterling and Tom Karl, National Climatic Data Center, Asheville, N.C., 28801.
One of the most hotly debated topics on Earth is the issue of climate change, and the National Environmental Satellite, Data, and Information Service (NESDIS) data centers are central to answering some of the most pressing global change questions that remain unresolved. The National Climatic Data Center contains the instrumental records that can precisely define the nature of climatic fluctuations at time scales of a up to a century. Diverse kinds of data platforms contribute to NCDC's armamentarium; they include ships, buoys, weather stations, balloons, satellites, and aircraft. The National Oceanographic Data Center contains the sub-surface data that reveal the ways that heat is distributed and redistributed over the planet. Knowing how these systems are changing and how they have changed in the past is crucial to understanding how they will change in the future. And, for climate information that extends from hundreds to thousands of years, the paleoclimatology program, also at the National Climatic Data Center, helps to provide longer term perspectives.
Internationally, the Intergovernmental Panel on Climate Change (IPCC), under the auspices of the United Nations (UN), World Meteorological Organization (WMO), and the United Nations Environment Programme (UNEP), is the most senior and authoritative body providing scientific advice to global policy makers. The IPCC met in full session in 1990, 1995, and in 2001. They address issues such as the buildup of greenhouse gases; evidence, attribution, and prediction of climate change; impacts of climate change; and policy options.
Listed below are a number of questions commonly addressed to climate scientists, and brief replies (based on IPCC reports and other research) in common, understandable language.
What is the greenhouse effect, and is it affecting our climate?
The greenhouse effect is unquestionably real and helps to regulate the temperature of our planet. It is essential for life on Earth and is one of Earth's natural processes. It is the result of heat absorption by certain gases in the atmosphere (called greenhouse gases because they effectively "trap" heat in the lower atmosphere) and re-radiation downward of some of that heat. Water vapor is the most abundant greenhouse gas, followed by carbon dioxide and other trace gases. Without a natural greenhouse effect, the temperature of the Earth would be about 0°F instead of its present 57°F. So, the concern is not with the fact that we have a greenhouse effect, but whether human activities are leading to an enhancement of the greenhouse effect.
Are greenhouse gases increasing?
Human activity has been increasing the concentration of greenhouse gases in the atmosphere (mostly carbon dioxide from combustion of coal, oil, and gas; plus a few other trace gases). There is no scientific debate on this point. Pre-industrial levels of carbon dioxide (prior to the start of the Industrial Revolution) were about 280 parts per million by volume (ppmv), and current levels are about 370 ppmv. The concentration of CO 2 in our atmosphere today has not been exceeded in the last 420,000 years, and likely not in the last 20 million years. According to the IPCC Special Report on Emission Scenarios (SRES), by the end of the 21st century we could expect to see carbon dioxide concentrations of anywhere from 490 to 1260 ppm (75–350% above the pre–industrial concentration).
Is the climate warming?
Yes. Global surface temperatures have increased about 0.6°C (plus or minus 0.2°C) since the late-19th century, and about 0.4°F (0.2 to 0.3°C) over the past 25 years (the period with the most credible data). The warming has not been globally uniform. Some areas (including parts of the southeastern U.S.) have, in fact, cooled over the last century. The recent warmth has been greatest over North America and Eurasia between 40 and 70°N. Warming, assisted by the record El Niño of 1997–1998, has continued right up to the present, with 2001 being the second warmest year on record after 1998.
Linear trends can vary greatly depending on the period over which they are computed. Temperature trends in the lower troposphere (between about 2,500 and 26,000 ft.) from 1979 to the present, the period for which Satellite Microwave Sounding Unit data exist, are small and may be un-representative of longer term trends and trends closer to the surface. Furthermore, there are small unresolved differences between radiosonde and satellite observations of tropospheric temperatures, though both data sources show slight warming trends. If one calculates trends beginning with the commencement of radiosonde data in the 1950s, the record shows a slight increase in warming due to temperature rises in the 1970s. There are statistical and physical reasons (e.g., short record lengths, the transient differential effects of volcanic activity and El Niño, and boundary layer effects) for expecting differences between recent trends in surface and lower tropospheric temperatures, but the exact causes for the differences are still under investigation (see National Research Council report Reconciling Observations of Global Temperature Change).
An enhanced greenhouse effect is expected to cause cooling in higher parts of the atmosphere because the increased "blanketing" effect in the lower atmosphere holds in more heat, allowing less to reach the upper atmosphere. Cooling of the lower stratosphere (about 49,000–79,500 ft.) since 1979 is shown by both satellite Microwave Sounding Unit and radiosonde data, but is larger in the radiosonde data.
Relatively cool surface and tropospheric temperatures, and a relatively warmer lower stratosphere, were observed in 1992 and 1993, following the 1991 eruption of Mt. Pinatubo. The warming reappeared in 1994. A dramatic global warming, at least partly associated with the record El Niño, took place in 1998. This warming episode is reflected from the surface to the top of the troposphere.
There has been a general, but not global, tendency toward reduced diurnal temperature range (DTR) (the difference between high and low daily temperatures) over about 50% of the global land mass since the middle of the 20th century. Cloud cover has increased in many of the areas with reduced diurnal temperature range. The overall positive trend for maximum daily temperature over the period of study (1950–1993) is 0.1°C per decade, whereas the trend for daily minimum temperatures is 0.2°C per decade. This results in a negative trend in the DTR of –0.1°C per decade.
Indirect indicators of warming such as borehole temperatures, snow cover, and glacier recession data, are in substantial agreement with the more direct indicators of recent warmth. Evidence such as changes in glacier length is useful because it not only provides qualitative support for existing meteorological data, but glaciers often exist in places too remote to support meteorological stations, the records of glacial advances and retreats often extend back further than weather station records, and glaciers are usually at much higher altitudes than weather stations, thus allowing more insight into temperature changes higher in the atmosphere.
Large-scale measurements of sea-ice have only been possible since the advent of satellites, but by looking at a number of different satellite estimates it has been determined that Arctic sea ice has decreased between 1973 and 1996 at a rate of –2.8% (+/– 0.3%) per decade. Although this seems to correspond to a general increase in temperature over the same period, there are lots of quasi-cyclic atmospheric dynamics (for example the Arctic Oscillation) that may also influence the extent and thickness of sea ice in the Arctic. Sea ice in the Antarctic has shown perhaps a slight increase since 1979, though extending the Antarctic sea-ice record back in time is more difficult due to the lack of direct observations in this part of the world.
Are El Niños related to global warming?
El Niños are not caused by global warming. Clear evidence exists from a variety of sources (including archaeological studies) that El Niños have been present for hundreds, and some indicators suggest maybe millions, of years. However, it has been hypothesized that warmer global sea-surface temperatures can enhance the El Niño phenomenon, and it is also true that El Niños have been more frequent and intense in recent decades. Recent climate model results that simulate the 21st century with increased greenhouse gases suggest that El Niño–like sea-surface temperature patterns in the tropical Pacific are likely to be more persistent.
Is the hydrological cycle (evaporation and precipitation) changing?
Overall, land precipitation for the globe has increased by roughly 2% since 1900; however, precipitation changes have been spatially variable over the last century. Instrumental records show that there has been a general increase in precipitation of about 0.5–1.0% per decade over land in northern mid–high latitudes, except in parts of eastern Russia. However, a decrease of about 0.3% per decade in precipitation has occurred during the 20th century over land in sub-tropical latitudes, though this trend has weakened in recent decades. Due to the difficulty in measuring precipitation, it has been important to constrain these observations by analyzing other related variables. The measured changes in precipitation are consistent with observed changes in streamflow, lake levels, and soil moisture (where data are available and have been analyzed).
The extent of snow cover in the Northern Hemisphere has consistently remained below average since 1987, and has decreased by about 10% since 1966. This is mostly due to a decrease in spring and summer snowfall over both the Eurasian and North American continents since the mid-1980s. However, the extent of snow cover in the winter and autumn has shown no significant trend for the Northern Hemisphere over the same period.
Improved satellite data show that a general trend of increasing clouds over both land and ocean since the early 1980s seems to have reversed in the early 1990s, and the total amount of clouds over land and ocean now appears to be decreasing. However, there are several studies that suggest regional cloudiness, perhaps especially in the thick precipitating clouds, has increased over the 20th century.
Is the atmospheric/oceanic circulation changing?
A rather abrupt change in the El Niño–Southern Oscillation behavior occurred around 1976–1977 and the new regime has persisted. There have been relatively more frequent and persistent El Niño episodes rather than the cool La Niñas. This behavior is highly unusual in the last 120 years (the period of instrumental record). Changes in precipitation over the tropical Pacific are related to this change in the El Niño–Southern Oscillation, which has also affected the pattern and magnitude of surface temperatures. However, it is unclear whether this apparent change in the ENSO cycle is caused by global warming.
Is the climate becoming more variable or extreme?
On a global scale there is little evidence of sustained trends in climate variability or extremes. This perhaps reflects inadequate data and a dearth of analyses. However, on regional scales, there is clear evidence of changes in variability or extremes.
In areas where a drought or excessive wetness usually accompanies an El Niño, these dry or wet spells have been more intense in recent years. Other than these areas, little evidence is available of changes in drought frequency or intensity.
In some areas where overall precipitation has increased(i.e., the mid-high northern latitudes), there is evidence of increases in the heavy and extreme precipitation events. Even in areas such as eastern Asia, it has been found that extreme precipitation events have increased despite total precipitation remaining constant or even decreasing somewhat. This is related to a decrease in the frequency of precipitation in this region.
Many individual studies of various regions show that extra-tropical cyclone activity seems to have generally increased over the last half of the 20th century in the Northern Hemisphere; but it has decreased in the Southern Hemisphere. It is not clear whether these trends are multi-decadal fluctuations or part of a longer-term trend.
Where reliable data are available, tropical storm frequency and intensity show no significant long-term trend in any basin. There are apparent decadal-interdecadal fluctuations, but nothing that is conclusive in suggesting a longer-term component.
Global temperature extremes have been found to exhibit no significant trend in interannual variability, but several studies suggest a significant decrease in intra-annual variability. There has been a clear trend to fewer extremely low minimum temperatures in several widely separated areas in recent decades. Widespread significant changes in extreme high temperature events have not been observed.
There is some indication of a decrease in day-to-day temperature variability in recent decades.
How important are these changes in a longer-term context?
Paleoclimatic data are critical for enabling us to extend our knowledge of climatic variability beyond what is measured by modern instruments. Many natural phenomena are climate dependent (the growth rate of a tree, for example), and, as such, they provide natural "archives" of climate information. Some useful paleoclimate data can be found in sources as diverse as tree rings, ice cores, corals, lake sediments (including fossil insects and pollen data), speleothems (stalactites, etc.), and ocean sediments. Some of these, including ice cores and tree rings, also provide chronological data because of the way in which they are formed; so high-resolution climate reconstruction is possible in these cases. However, there is not as comprehensive a network of paleoclimate data as there is with instrumental coverage, so global climate reconstructions are often difficult to obtain. Nevertheless, combining different types of paleoclimate records enables us to gain a near-global picture of climate changes in the past.
For the Northern Hemisphere summer temperature, recent decades appear to be the warmest since at least about 1000 A.D. , and the warming trend since the late 19th century is unprecedented over the last 1,000 years. Older data are insufficient to provide reliable hemispheric temperature estimates. Ice-core data suggest that the 20th century has been warm in many parts of the globe; but they also suggest that the significance of this warming varies geographically, particularly when viewed in the context of climate variations of the last millennium.
Large and rapid climatic changes affecting the atmospheric and oceanic circulation and temperature, and the hydrological cycle, occurred during the last ice age and during the transition towards the present Holocene period (which began about 10,000 years ago). Based on the incomplete evidence available, the projected change of 1.5–4°C over the next century would be unprecedented in comparison with the best available records from the last several thousand years.
Is the sea level rising?
Global mean sea level has been rising at an average rate of 1–2 mm per year over the past 100 years, which is significantly larger than the rate averaged over the last several thousand years. The projected increase from 1990 to 2100 is anywhere from 0.09–0.88 meters, depending on which greenhouse gas scenario is used. There are many physical uncertainties that contribute to sea-level rise, including a variety of frozen and unfrozen water sources.
Can the observed changes be explained by natural variability, including changes in solar output?
Since our entire climate system is fundamentally driven by energy from the Sun, it stands to reason that if the Sun's energy output were to change, then so would the climate. Since the advent of space-borne measurements in the late 1970s, solar output has indeed been shown to vary. There appears to be confirmation of earlier suggestions of an 11- and 22-year cycle of irradiance. With only 20 years of reliable measurements however, it is difficult to deduce a trend. But, from the short record we have so far, the trend in solar irradiance is estimated at roughly 0.09 W/m 2 compared to 0.4 W/m 2 from well-mixed greenhouse gases. There are many indications that the Sun also has a longer-term variation that has potentially contributed to the century-scale forcing to a greater degree. There is, though, a great deal of uncertainty in estimates of solar irradiance beyond what can be measured by satellites, and still the contribution of direct solar irradiance forcing is small compared to the greenhouse gas component. However, our understanding of the indirect effects of changes in solar output and feedbacks in the climate system is minimal. There is much need to refine our understanding of key natural forcing mechanisms of the climate, including solar irradiance changes, in order to reduce uncertainty in our projections of future climate change.
In addition to changes in energy from the Sun itself, the Earth's position and orientation relative to the Sun (our orbit) also varies slightly, thereby bringing us closer and farther away from the Sun in predictable cycles (called Milankovitch cycles). Variations in these cycles are believed to be the cause of Earth's ice ages (glacials). Particularly important for the development of glacials is the radiation receipt at high northern latitudes. Diminishing radiation at these latitudes during the summer months would have enabled winter snow and ice cover to persist throughout the year, eventually leading to a permanent snow-or icepack. While Milankovitch cycles have tremendous value as a theory to explain ice ages and long-term changes in the climate, they are unlikely to have very much impact on the decade-century timescale. Over several centuries it may be possible to observe the effect of these orbital parameters; however, for the prediction of climate change in the 21st century, these changes will be far less important than radiative forcing from greenhouse gases.
What about the future?
Due to the enormous complexity of the atmosphere, the most useful tools for gauging future changes are "climate models." These are computer-based mathematical models that simulate, in three dimensions, the climate's behavior, its components, and their interactions. Climate models are constantly improving, though by definition a model is a simplification and simulation of reality, an approximation of the climate system. The first step in any modeled projection of climate change is to simulate the present climate and compare it to observations. If the model is considered to do a good job at representing modern climate, then certain parameters can be changed, such as the concentration of greenhouse gases, which helps us understand how the climate would change in response. Projections of future climate change therefore depend on how well the computer climate model simulates the climate and on our understanding of how forcing functions will change in the future.
The IPCC Special Report on Emission Scenarios determines the range of future possible greenhouse gas concentrations (and other forcings) based on considerations such as population growth, economic growth, energy efficiency, and a host of other factors. This leads to a wide range of possible forcing scenarios, and consequently to a wide range of possible future climates.
According to the range of possible forcing scenarios, and taking into account uncertainty in climate model performance, the IPCC projects a global temperature increase of anywhere from 1.4 to 5.8°C from 1990 to 2100. However, this global average will integrate widely varying regional responses, such as the likelihood that land areas will warm much faster than ocean temperatures, particularly those land areas in northern high latitudes (and mostly in the cold season).
Precipitation is also expected to increase over the 21st century, particularly at northern mid-high latitudes; the trends may be more variable in the tropics.
Weather Anecdotes
May 21, 1996 … Philadelphia, PA. A 74-year-old man died in a hospital parking lot when the defroster, instead of the air conditioner, was running in the car.
June 23, 1996 … Spartanburg, SC. A 39-year-old man died from a heat stroke while relaxing beside his pool.
April 30, 1999 … India. A record-breaking heat wave killed eight people, bringing the total deaths during the two-week heat to 89. The eastern state of Orissa is the worst hit area hit by the heat with 34 fatalities. Temperatures reached 117°F in the state's Balangir tribal district. More than 2,000 people died in a similar heat wave in Orissa the previous year, when a 50-year-old record high for April of nearly 110°F was reported.
Snow extent and sea-ice are also projected to decrease further in the Northern Hemisphere, and glaciers and icecaps are expected to continue to retreat.
Comment about this article, ask questions, or add new information about this topic: