2001 HILO, HAWAII (ITO)
The city of Hilo is located near the midpoint of the eastern shore of the Island of Hawaii. This island is by far the largest of the Hawaiian group, with an area of 4,038 square miles, more than twice that of all the other islands combined. Its topography is dominated by the great volcanic masses of Mauna Loa (13,653 feet), Mauna Kea (13,796 feet), and of Haulalai, the Kohala Mountains, and Kilauea. In fact, the island consists entirely of the slopes of these mountains and of the broad saddles between them. Mauna Loa and Kilauea, which occupy the southern half of the island, are still active volcanoes.
Hawaii lies well within the belt of northeasterly trade winds generated by the semi–permanent Pacific high pressure cell to the north and east. The climate provides equable temperatures from day to day and season to season. In Hilo, July and August are the warmest months, with average daily highs and lows of 83 and 68 degrees. January and February, the coolest months, have highs of 80 degrees and lows of 63 degrees. Greater variations occur in localities with less rain and cloud, but temperatures in the mid–90s and low 50s are uncommon anywhere on the island near sea level.
Over the windward slopes of Hawaii, rainfall occurs principally as orographic showers within the ascending moist trade winds. Mean annual rainfall, except for the semi–sheltered Hamakua district, increases from 100 inches or more along the coasts to a maximum of over 300 inches at elevations of 2,000 to 3,000 feet, and then declines to about 15 inches at the summits of Mauna Kea and Mauna Loa. Leeward areas are topographically sheltered from the trades and are therefore drier, although sea breezes created by daytime heating of the land move onshore and upslope, causing afternoon and evening cloudiness and showers. The driest locality on the island, and in the State, with an annual rainfall of less than 10 inches, is the coastal strip just leeward of the southern portion of the Kohala Mountains and of the saddle between the Kohalas and Mauna Kea.
Within the city of Hilo, average rainfall varies from about 130 inches a year near the shore to as much as 200 upslope. The wettest part of the island, with a mean annual rainfall exceeding 300 inches, lies about 6 miles upslope from the city limits. Relative humidity at Hilo is in the moderate range, however, due to the natural ventilation provided by the prevailing winds, the weather is seldom oppressive.
The trade winds prevail throughout the year and profoundly influence the climate. The islands entire western coast is sheltered from the trades by high mountains, except that unusually strong trade winds may sweep through the saddle between the Kohala Mountains and Mauna Kea and reach the areas to the lee. But even places exposed to the trades may be affected by local mountain circulations. Except for heavy rain, really severe weather seldom occurs. During the winter, cold fronts or the cyclonic storms of subtropical origin may bring blizzards to the upper slopes of Mauna Loa and Mauna Kea, with snow extending at times to 9,000 feet or below and icing nearer the summit.
Storms crossing the Pacific a thousand miles to the north, low pressure or tropical storms, may generate seas that cause heavy swell and surf.
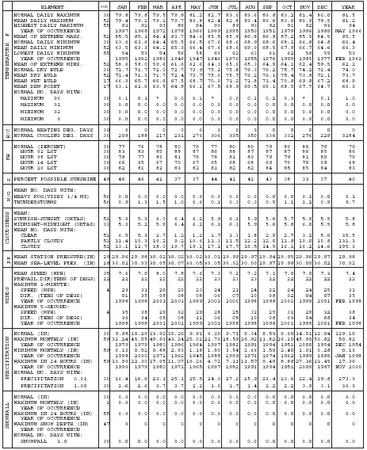
NORMALS, MEANS, AND EXTREMES
HILO, HI (ITO)
LATITUDE: LONGITUDE: ELEVATION (FT): TIME ZONE: WBAN: 21504
19 43′ 24″ N 155 03′ 05″ W GRND: 44 BARO: � 0;47 HAWAII (UTC + 10)
| ELEMENT | POR | JAN | FEB | MAR | APR | MAY | JUN | JUL | AUG | SEP | OCT | NOV | DEC | YEAR | |
| TEMPERATURE F | NORMAL DAILY MAXIMUM | 30 | 79.8 | 79.8 | 79.5 | 79.8 | 81.2 | 82.7 | 83.0 | 83.6 | 83.8 | 83.2 | 81.4 | 80.0 | 81.5 |
| MEAN DAILY MAXIMUM | 52 | 79.4 | 79.2 | 79.2 | 79.7 | 80.8 | 82.4 | 82.8 | 83.4 | 83.6 | 83.0 | 80.9 | 79.5 | 81.2 | |
| HIGHEST DAILY MAXIMUM | 55 | 92 | 92 | 93 | 89 | 94 | 90 | 89 | 93 | 92 | 91 | 92 | 93 | 94 | |
| YEAR OF OCCURRENCE | 1997 | 1968 | 1972 | 1978 | 1966 | 1969 | 1995 | 1950 | 1951 | 1979 | 1996 | 1980 | MAY 1966 | ||
| MEAN OF EXTREME MAXS. | 52 | 85.5 | 85.1 | 84.4 | 83.7 | 84.6 | 85.5 | 85.9 | 86.8 | 86.8 | 87.2 | 85.5 | 84.5 | 85.5 | |
| NORMAL DAILY MINIMUM | 30 | 63.6 | 63.6 | 64.4 | 65.5 | 66.5 | 67.6 | 68.6 | 68.9 | 68.6 | 68.1 | 66.8 | 64.8 | 66.4 | |
| MEAN DAILY MINIMUM | 52 | 63.5 | 63.3 | 64.2 | 65.3 | 66.4 | 67.6 | 68.6 | 69.0 | 68.5 | 67.9 | 66.7 | 64.6 | 66.3 | |
| LOWEST DAILY MINIMUM | 55 | 54 | 53 | 54 | 56 | 58 | 60 | 62 | 63 | 61 | 62 | 58 | 55 | 53 | |
| YEAR OF OCCURRENCE | 1995 | 1962 | 1983 | 1949 | 1947 | 1946 | 1970 | 1955 | 1970 | 1999 | 1985 | 1977 | FEB 1962 | ||
| MEAN OF EXTREME MINS. | 52 | 58.6 | 58.0 | 59.6 | 61.6 | 62.6 | 64.3 | 65.0 | 65.3 | 64.9 | 64.1 | 62.4 | 59.5 | 62.2 | |
| NORMAL DRY BULB | 30 | 71.7 | 71.7 | 72.0 | 72.7 | 73.9 | 75.2 | 75.8 | 76.3 | 76.2 | 75.7 | 74.2 | 72.4 | 74.0 | |
| MEAN DRY BULB | 52 | 71.4 | 71.3 | 71.7 | 72.4 | 73.7 | 75.0 | 75.7 | 76.2 | 76.1 | 75.4 | 73.8 | 72.1 | 73.7 | |
| MEAN WET BULB | 17 | 66.0 | 65.7 | 66.6 | 67.5 | 68.7 | 70.0 | 71.2 | 71.8 | 71.4 | 70.8 | 69.8 | 67.2 | 68.9 | |
| MEAN DEW POINT | 17 | 63.1 | 62.6 | 63.5 | 64.8 | 66.1 | 67.5 | 68.9 | 69.5 | 69.1 | 68.5 | 67.7 | 64.7 | 66.3 | |
| NORMAL NO. DAYS WITH: | |||||||||||||||
| MAXIMUM 90 | 30 | 0.1 | 0.1 | * | 0.0 | 0.1 | * | 0.0 | 0.1 | 0.2 | 0.3 | * | 0.1 | 1.0 | |
| MAXIMUM 32 | 30 | 0.0 | 0.0 | 0.0 | 0.0 | 0.0 | 0.0 | 0.0 | 0.0 | 0.0 | 0.0 | 0.0 | 0.0 | 0.0 | |
| MINIMUM 32 | 30 | 0.0 | 0.0 | 0.0 | 0.0 | 0.0 | 0.0 | 0.0 | 0.0 | 0.0 | 0.0 | 0.0 | 0.0 | 0.0 | |
| MINIMUM 0 | 30 | 0.0 | 0.0 | 0.0 | 0.0 | 0.0 | 0.0 | 0.0 | 0.0 | 0.0 | 0.0 | 0.0 | 0.0 | 0.0 | |
| H/C | NORMAL HEATING DEG. DAYS | 30 | 0 | 0 | 0 | 0 | 0 | 0 | 0 | 0 | 0 | 0 | 0 | 0 | 0 |
| NORMAL COOLING DEG. DAYS | 30 | 208 | 188 | 217 | 231 | 276 | 306 | 335 | 350 | 336 | 332 | 276 | 229 | 3284 | |
| RH | NORMAL (PERCENT) | 30 | 77 | 76 | 78 | 80 | 79 | 77 | 80 | 80 | 79 | 80 | 80 | 79 | 79 |
| HOUR 02 LST | 30 | 83 | 83 | 85 | 88 | 87 | 86 | 88 | 87 | 87 | 87 | 86 | 85 | 86 | |
| HOUR 08 LST | 30 | 78 | 77 | 80 | 81 | 79 | 78 | 81 | 80 | 79 | 79 | 81 | 80 | 79 | |
| HOUR 14 LST | 30 | 66 | 65 | 67 | 70 | 67 | 65 | 68 | 68 | 69 | 70 | 70 | 68 | 68 | |
| HOUR 20 LST | 30 | 82 | 81 | 82 | 83 | 82 | 81 | 82 | 82 | 84 | 85 | 85 | 84 | 83 | |
| S | PERCENT POSSIBLE SUNSHINE | 49 | 46 | 46 | 42 | 37 | 37 | 44 | 41 | 41 | 43 | 38 | 33 | 37 | 40 |
| W/O | MEAN NO. DAYS WITH: | ||||||||||||||
| HEAVY FOG (VISBY 1/4 MI) | 56 | 0.0 | 0.0 | 0.0 | 0.0 | 0.0 | 0.0 | 0.0 | 0.0 | 0.0 | 0.0 | 0.1 | 0.0 | 0.1 | |
| THUNDERSTORMS | 56 | 0.9 | 1.3 | 1.5 | 1.0 | 0.6 | 0.1 | 0.3 | 0.3 | 0.5 | 1.1 | 1.2 | 0.9 | 9.7 | |
| CLOUDINESS | MEAN: | ||||||||||||||
| SUNRISE-SUNSET (OKTAS) | 51 | 5.0 | 5.3 | 6.0 | 6.4 | 6.2 | 5.9 | 6.1 | 5.9 | 5.6 | 5.7 | 5.9 | 5.5 | 5.8 | |
| MIDNIGHT-MIDNIGHT (OKTAS) | 33 | 5.0 | 5.2 | 5.9 | 6.4 | 6.2 | 6.1 | 6.3 | 5.9 | 5.6 | 5.8 | 6.0 | 5.5 | 5.8 | |
| MEAN NO. DAYS WITH: | |||||||||||||||
| CLEAR | 51 | 6.5 | 5.3 | 2.7 | 1.2 | 1.2 | 1.7 | 1.3 | 1.8 | 2.9 | 2.7 | 3.2 | 5.0 | 35.5 | |
| PARTLY CLOUDY | 51 | 11.4 | 10.3 | 10.2 | 9.2 | 10.6 | 11.3 | 11.5 | 12.2 | 12.0 | 11.8 | 10.0 | 10.8 | 131.3 | |
| CLOUDY | 51 | 13.1 | 12.7 | 18.0 | 19.7 | 19.1 | 17.1 | 17.7 | 16.5 | 14.5 | 16.1 | 16.2 | 14.6 | 195.3 | |
| PR | MEAN STATION PRESSURE (IN) | 29 | 29.96 | 29.98 | 30.02 | 30.02 | 30.02 | 30.01 | 29.99 | 29.97 | 29.94 | 29.95 | 29.96 | 29.97 | 29.98 |
| MEAN SEA-LEVEL PRES. (IN) | 18 | 30.02 | 30.03 | 30.05 | 30.07 | 30.05 | 30.05 | 30.02 | 30.00 | 29.97 | 29.98 | 30.00 | 30.02 | 30.02 | |
| WINDS | MEAN SPEED (MPH) | 35 | 7.6 | 7.9 | 8.0 | 7.8 | 7.6 | 7.3 | 7.2 | 7.2 | 7.1 | 7.0 | 7.0 | 7.3 | 7.4 |
| PREVAIL. DIR (TENS OF DEGS) | 22 | 22 | 22 | 22 | 22 | 22 | 23 | 23 | 23 | 22 | 22 | 22 | 22 | 22 | |
| MAXIMUM 2-MINUTE: | |||||||||||||||
| SPEED (MPH) | 4 | 29 | 31 | 26 | 23 | 23 | 24 | 21 | 24 | 22 | 24 | 24 | 25 | 31 | |
| DIR. (TENS OF DEGS) | 01 | 35 | 08 | 08 | 08 | 06 | 07 | 10 | 08 | 02 | 04 | 07 | 35 | ||
| YEAR OF OCCURRENCE | 1998 | 1998 | 2001 | 2001 | 1999 | 2001 | 2000 | 1998 | 1998 | 2001 | 1999 | 2001 | FEB 1998 | ||
| MAXIMUM 5-SECOND: | |||||||||||||||
| SPEED (MPH) | 4 | 35 | 38 | 29 | 32 | 29 | 28 | 25 | 32 | 25 | 31 | 29 | 32 | 38 | |
| DIR. (TENS OF DEGS) | 36 | 34 | 08 | 08 | 11 | 06 | 08 | 10 | 08 | 03 | 04 | 08 | 34 | ||
| YEAR OF OCCURRENCE | 1998 | 1998 | 2001 | 2001 | 1999 | 2001 | 1998 | 1998 | 1998 | 2001 | 1999 | 2001 | FEB 1998 | ||
| PRECIPITATION | NORMAL (IN) | 30 | 9.88 | 10.29 | 13.92 | 15.26 | 9.91 | 6.20 | 9.71 | 9.34 | 8.53 | 9.60 | 14.51 | 12.04 | 129.19 |
| MAXIMUM MONTHLY (IN) | 59 | 32.24 | 45.55 | 49.93 | 43.24 | 25.01 | 22.70 | 28.59 | 26.92 | 21.82 | 26.10 | 45.90 | 50.82 | 50.82 | |
| YEAR OF OCCURRENCE | 1979 | 1979 | 1980 | 1986 | 1964 | 1997 | 1982 | 1991 | 1994 | 1951 | 2000 | 1954 | DEC 1954 | ||
| MINIMUM MONTHLY (IN) | 59 | 0.13 | 0.52 | 0.88 | 2.93 | 1.18 | 1.80 | 3.54 | 2.66 | 1.59 | 2.40 | 1.01 | 0.28 | 0.13 | |
| YEAR OF OCCURRENCE | 1998 | 2000 | 1972 | 1962 | 1945 | 1985 | 1999 | 1971 | 1974 | 1962 | 1989 | 1980 | JAN 1998 | ||
| MAXIMUM IN 24 HOURS (IN) | 59 | 10.90 | 22.30 | 17.05 | 11.07 | 10.26 | 4.72 | 7.11 | 11.57 | 9.49 | 8.88 | 27.36 | 11.45 | 27.36 | |
| YEAR OF OCCURRENCE | 1990 | 1979 | 1980 | 1971 | 1965 | 1997 | 1982 | 1991 | 1994 | 1951 | 2000 | 1987 | NOV 2000 | ||
| NORMAL NO. DAYS WITH: | |||||||||||||||
| PRECIPITATION 0.01 | 30 | 16.4 | 16.6 | 23.1 | 25.1 | 25.5 | 24.3 | 27.2 | 25.9 | 23.4 | 23.6 | 22.4 | 19.8 | 273.3 | |
| PRECIPITATION 1.00 | 30 | 2.6 | 2.6 | 3.7 | 3.7 | 2.2 | 1.0 | 1.7 | 1.4 | 2.2 | 2.2 | 3.9 | 3.1 | 30.3 | |
| SNOWFALL | NORMAL (IN) | 30 | 0.0 | 0.0 | 0.0 | 0.0 | 0.0 | 0.0 | 0.0 | 0.0 | 0.0 | 0.0 | 0.0 | 0.0 | 0.0 |
| MAXIMUM MONTHLY (IN) | 1 | 0.0 | 0.0 | 0.0 | 0.0 | 0.0 | 0.0 | 0.0 | 0.0 | 0.0 | 0.0 | 0.0 | 0.0 | 0.0 | |
| YEAR OF OCCURRENCE | |||||||||||||||
| MAXIMUM IN 24 HOURS (IN) | 55 | 0.0 | 0.0 | 0.0 | 0.0 | 0.0 | 0.0 | 0.0 | 0.0 | 0.0 | 0.0 | 0.0 | 0.0 | 0.0 | |
| YEAR OF OCCURRENCE | |||||||||||||||
| MAXIMUM SNOW DEPTH (IN) | 47 | 0 | 0 | 0 | 0 | 0 | 0 | 0 | 0 | 0 | 0 | 0 | 0 | 0 | |
| YEAR OF OCCURRENCE | |||||||||||||||
| NORMAL NO. DAYS WITH: | |||||||||||||||
| SNOWFALL 1.0 | 30 | 0.0 | 0.0 | 0.0 | 0.0 | 0.0 | 0.0 | 0.0 | 0.0 | 0.0 | 0.0 | 0.0 | 0.0 | 0.0 |
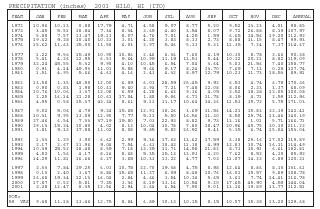
| PRECIPITATION (inches) 2001 HILO, HI (ITO) | |||||||||||||
| YEAR | JAN | FEB | MAR | APR | MAY | JUN | JUL | AUG | SEP | OCT | NOV | DEC | ANNUAL |
| 1972 | 10.96 | 10.13 | 0.88 | 17.79 | 4.71 | 4.58 | 9.07 | 8.77 | 5.20 | 9.52 | 13.23 | 4.01 | 98.85 |
| 1973 | 3.45 | 5.51 | 18.84 | 7.34 | 8.34 | 3.69 | 4.40 | 3.54 | 8.07 | 9.72 | 26.88 | 8.19 | 107.97 |
| 1974 | 5.88 | 7.57 | 13.47 | 19.11 | 8.07 | 4.76 | 7.81 | 4.25 | 1.59 | 6.65 | 14.56 | 19.20 | 112.92 |
| 1975 | 19.62 | 9.28 | 10.40 | 10.23 | 3.01 | 4.20 | 3.83 | 8.13 | 2.73 | 8.88 | 11.15 | 8.47 | 99.93 |
| 1976 | 15.62 | 11.63 | 25.00 | 11.58 | 6.01 | 2.97 | 5.46 | 5.13 | 5.31 | 11.35 | 7.24 | 7.37 | 114.67 |
| 1977 | 1.22 | 9.56 | 15.49 | 10.90 | 10.86 | 2.46 | 6.36 | 7.60 | 4.19 | 10.30 | 8.78 | 2.66 | 90.38 |
| 1978 | 5.41 | 4.26 | 12.95 | 6.53 | 9.64 | 10.99 | 11.19 | 13.53 | 5.44 | 10.12 | 20.21 | 8.82 | 119.09 |
| 1979 | 32.24 | 45.55 | 5.32 | 9.90 | 4.10 | 10.45 | 6.54 | 7.04 | 3.64 | 5.03 | 21.56 | 7.40 | 158.77 |
| 1980 | 0.91 | 4.14 | 49.93 | 11.01 | 5.88 | 9.66 | 9.17 | 8.24 | 13.70 | 7.69 | 7.13 | 0.28 | 127.74 |
| 1981 | 1.51 | 4.95 | 5.66 | 4.63 | 4.16 | 2.43 | 4.32 | 8.97 | 12.79 | 10.23 | 11.73 | 18.53 | 89.91 |
| 1982 | 13.58 | 1.35 | 48.50 | 12.00 | 6.89 | 6.03 | 28.59 | 25.45 | 9.92 | 6.53 | 4.74 | 6.78 | 170.36 |
| 1983 | 0.90 | 0.83 | 1.98 | 10.31 | 9.60 | 3.94 | 7.21 | 7.48 | 12.08 | 8.06 | 2.33 | 3.37 | 68.09 |
| 1984 | 10.76 | 10.06 | 3.37 | 12.08 | 6.59 | 4.28 | 6.63 | 9.36 | 4.05 | 2.52 | 18.38 | 12.00 | 100.08 |
| 1985 | 2.25 | 16.14 | 21.28 | 10.61 | 17.04 | 1.80 | 9.86 | 6.71 | 11.78 | 8.19 | 4.71 | 2.59 | 112.96 |
| 1986 | 4.95 | 0.58 | 15.37 | 43.24 | 8.61 | 9.11 | 11.17 | 10.64 | 14.36 | 11.53 | 35.72 | 5.75 | 171.03 |
| 1987 | 9.02 | 5.06 | 4.79 | 9.24 | 15.65 | 12.91 | 18.26 | 3.69 | 11.56 | 14.21 | 15.83 | 22.19 | 142.41 |
| 1988 | 10.31 | 9.95 | 13.09 | 12.90 | 7.77 | 5.11 | 5.50 | 16.56 | 11.30 | 8.50 | 25.74 | 13.46 | 140.19 |
| 1989 | 27.46 | 6.54 | 7.33 | 37.19 | 19.80 | 7.03 | 22.93 | 8.82 | 9.73 | 13.16 | 1.01 | 5.71 | 166.71 |
| 1990 | 29.13 | 15.24 | 10.80 | 4.02 | 8.13 | 10.04 | 10.78 | 7.80 | 18.47 | 20.96 | 45.75 | 30.10 | 211.22 |
| 1991 | 3.81 | 9.32 | 37.88 | 11.02 | 8.08 | 9.85 | 9.82 | 26.92 | 9.41 | 5.15 | 6.74 | 15.04 | 153.04 |
| 1992 | 1.33 | 1.29 | 3.90 | 6.62 | 2.99 | 9.36 | 17.63 | 13.62 | 17.59 | 3.38 | 25.16 | 17.02 | 119.89 |
| 1993 | 2.17 | 2.67 | 11.96 | 9.04 | 7.54 | 6.63 | 18.43 | 11.38 | 4.99 | 12.83 | 10.74 | 16.11 | 114.49 |
| 1994 | 10.39 | 25.52 | 18.48 | 8.59 | 7.18 | 13.29 | 11.71 | 14.58 | 21.82 | 8.73 | 35.91 | 6.61 | 182.81 |
| 1995 | 4.52 | 1.56 | 4.17 | 8.14 | 8.68 | 5.35 | 15.13 | 13.93 | 4.20 | 7.62 | 8.52 | 4.10 | 85.92 |
| 1996 | 14.29 | 11.81 | 16.66 | 6.27 | 3.65 | 10.33 | 13.22 | 4.77 | 7.03 | 11.07 | 14.22 | 6.89 | 120.21 |
| 1997 | 2.33 | 7.84 | 19.25 | 6.03 | 10.75 | 22.70 | 19.38 | 4.75 | 8.98 | 12.64 | 8.86 | 8.10 | 131.61 |
| 1998 | 0.13 | 2.40 | 3.67 | 8.86 | 15.65 | 11.27 | 6.09 | 8.48 | 10.76 | 16.01 | 15.57 | 9.89 | 108.78 |
| 1999 | 16.68 | 19.34 | 12.13 | 16.04 | 2.84 | 4.66 | 3.54 | 10.14 | 5.65 | 3.61 | 7.74 | 14.41 | 116.78 |
| 2000 | 17.87 | 0.52 | 5.81 | 7.25 | 3.36 | 8.19 | 13.16 | 10.54 | 9.20 | 17.65 | 45.90 | 4.59 | 144.04 |
| 2001 | 2.28 | 12.47 | 8.35 | 12.56 | 2.94 | 3.64 | 6.54 | 7.90 | 9.01 | 13.16 | 19.89 | 13.77 | 112.51 |
| POR=59 YRS | 9.48 | 11.18 | 13.46 | 12.75 | 8.84 | 6.89 | 10.13 | 10.15 | 8.15 | 10.07 | 15.38 | 13.20 | 129.68 |
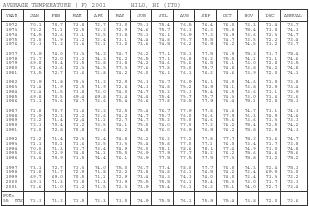
| AVERAGE TEMPERATURE (F) HILO, HI (ITO) | |||||||||||||
| YEAR | JAN | FEB | MAR | APR | MAY | JUN | JUL | AUG | SEP | OCT | NOV | DEC | ANNUAL |
| 1972 | 70.1 | 70.7 | 73.8 | 72.7 | 73.0 | 75.3 | 75.4 | 76.5 | 76.4 | 76.0 | 73.3 | 71.4 | 73.7 |
| 1973 | 72.2 | 71.1 | 72.5 | 72.2 | 72.9 | 74.6 | 75.7 | 76.3 | 76.3 | 75.8 | 75.4 | 73.8 | 74.1 |
| 1974 | 74.5 | 72.6 | 73.1 | 73.5 | 73.8 | 75.3 | 76.1 | 76.9 | 77.3 | 76.9 | 73.6 | 72.3 | 74.7 |
| 1975 | 71.0 | 71.9 | 71.2 | 72.4 | 73.1 | 74.4 | 74.8 | 75.7 | 75.5 | 74.7 | 73.5 | 72.2 | 73.4 |
| 1976 | 71.3 | 71.2 | 71.6 | 72.1 | 73.0 | 73.6 | 74.5 | 76.2 | 76.9 | 76.2 | 74.5 | 73.2 | 73.7 |
| 1977 | 73.9 | 74.0 | 73.3 | 74.2 | 74.7 | 76.2 | 77.1 | 78.1 | 77.5 | 76.9 | 75.2 | 73.7 | 75.4 |
| 1978 | 71.7 | 72.0 | 73.2 | 74.2 | 76.2 | 76.5 | 77.1 | 76.8 | 76.2 | 75.5 | 74.1 | 71.1 | 74.6 |
| 1979 | 69.8 | 70.4 | 71.5 | 73.8 | 73.8 | 74.2 | 74.6 | 75.6 | 76.5 | 76.1 | 73.0 | 72.8 | 73.5 |
| 1980 | 71.6 | 72.6 | 72.3 | 74.5 | 77.3 | 77.6 | 77.8 | 75.0 | 75.7 | 74.8 | 73.8 | 74.2 | 74.8 |
| 1981 | 73.5 | 72.7 | 71.6 | 72.8 | 74.2 | 76.0 | 76.1 | 76.1 | 76.2 | 74.6 | 73.9 | 72.0 | 74.1 |
| 1982 | 71.9 | 71.8 | 70.3 | 71.2 | 72.9 | 76.3 | 76.7 | 76.9 | 76.1 | 74.9 | 74.6 | 71.8 | 73.8 |
| 1983 | 71.4 | 71.9 | 72.5 | 71.9 | 72.6 | 74.3 | 74.8 | 75.2 | 74.9 | 74.1 | 73.8 | 72.9 | 73.4 |
| 1984 | 72.4 | 71.5 | 73.8 | 73.0 | 74.0 | 74.7 | 75.2 | 75.3 | 75.4 | 76.5 | 73.6 | 71.1 | 73.9 |
| 1985 | 69.8 | 70.5 | 69.4 | 69.8 | 71.4 | 74.4 | 75.4 | 75.7 | 75.7 | 74.3 | 73.0 | 71.6 | 72.6 |
| 1986 | 71.1 | 73.6 | 74.7 | 73.6 | 75.4 | 76.6 | 77.8 | 78.5 | 77.9 | 76.4 | 75.1 | 72.8 | 75.3 |
| 1987 | 71.8 | 70.7 | 71.6 | 72.2 | 72.5 | 75.4 | 76.7 | 77.9 | 77.8 | 76.6 | 74.7 | 73.1 | 74.3 |
| 1988 | 71.9 | 72.3 | 72.2 | 72.6 | 74.2 | 74.7 | 75.7 | 76.0 | 76.6 | 77.9 | 76.3 | 74.9 | 74.6 |
| 1989 | 72.2 | 71.4 | 72.4 | 71.1 | 72.7 | 74.7 | 75.2 | 75.0 | 74.6 | 75.6 | 73.6 | 71.3 | 73.3 |
| 1990 | 72.1 | 70.4 | 71.2 | 73.5 | 74.1 | 75.0 | 76.0 | 77.0 | 77.2 | 76.2 | 75.4 | 72.5 | 74.2 |
| 1991 | 72.0 | 72.8 | 70.8 | 72.6 | 74.2 | 74.8 | 76.0 | 76.9 | 76.9 | 76.2 | 75.8 | 72.9 | 74.3 |
| 1992 | 71.2 | 71.4 | 72.3 | 72.4 | 74.8 | 76.2 | 76.2 | 77.2 | 77.8 | 77.7 | 75.2 | 73.6 | 74.7 |
| 1993 | 71.1 | 70.1 | 71.6 | 73.5 | 73.3 | 75.4 | 75.8 | 77.0 | 77.1 | 76.0 | 73.4 | 71.7 | 73.8 |
| 1994 | 70.0 | 71.3 | 71.7 | 73.4 | 74.9 | 76.0 | 78.1 | 78.6 | 78.1 | 77.4 | 74.9 | 73.0 | 74.8 |
| 1995 | 72.6 | 72.9 | 74.8 | 74.1 | 75.5 | 76.9 | 77.9 | 77.7 | 78.2 | 76.2 | 75.6 | 74.6 | 75.6 |
| 1996 | 73.4 | 70.9 | 71.5 | 74.4 | 76.1 | 76.9 | 77.5 | 77.5 | 77.5 | 77.3 | 75.8 | 73.2 | 75.2 |
| 1997 | 73.1 | 72.7 | 73.3 | 74.0 | 75.0 | 76.7 | 77.4 | 78.0 | 77.7 | 76.8 | 74.3 | 72.4 | 75.1 |
| 1998 | 71.8 | 71.7 | 72.9 | 71.8 | 72.2 | 73.8 | 74.8 | 76.1 | 74.5 | 74.2 | 72.4 | 69.9 | 73.0 |
| 1999 | 69.7 | 69.0 | 70.5 | 71.1 | 72.9 | 73.4 | 74.3 | 74.3 | 74.0 | 74.0 | 72.4 | 71.3 | 72.2 |
| 2000 | 69.1 | 71.3 | 71.8 | 71.3 | 73.9 | 75.5 | 75.5 | 76.1 | 75.4 | 75.3 | 73.0 | 71.7 | 73.3 |
| 2001 | 71.6 | 71.0 | 71.2 | 71.5 | 72.3 | 73.9 | 75.4 | 76.1 | 76.2 | 75.1 | 74.0 | 72.7 | 73.4 |
| POR=55 YRS | 71.3 | 71.2 | 71.5 | 72.3 | 73.5 | 74.9 | 75.5 | 76.1 | 75.9 | 75.4 | 73.8 | 72.0 | 73.6 |
REFERENCE NOTES:
PAGE 1:
THE TEMPERATURE GRAPH SHOWS NORMAL MAXIMUM AND NORMAL MINIMUM DAILY TEMPERATURES (SOLID CURVES) AND THE ACTUAL DAILY HIGH AND LOW TEMPERATURES (VERTICAL BARS).
PAGE 2 AND 3:
H/C INDICATES HEATING AND COOLING DEGREE DAYS.
RH INDICATES RELATIVE HUMIDITY
W/O INDICATES WEATHER AND OBSTRUCTIONS
S INDICATES SUNSHINE.
PR INDICATES PRESSURE.
CLOUDINESS ON PAGE 3 IS THE SUM OF THE CEILOMETER AND SATELLITE DATA NOT TO EXCEED EIGHT EIGHTHS (OKTAS).
GENERAL:
T INDICATES TRACE PRECIPITATION, AN AMOUNT GREATER THAN ZERO BUT LESS THAN THE LOWEST REPORTABLE VALUE.
+ INDICATES THE VALUE ALSO OCCURS ON EARLIER DATES.
BLANK ENTRIES DENOTE MISSING OR UNREPORTED DATA.
NORMALS ARE 30–YEAR AVERAGES (1961–1990).
ASOS INDICATES AUTOMATED SURFACE OBSERVING SYSTEM.
PM INDICATES THE LAST DAY OF THE PREVIOUS MONTH.
POR (PERIOD OF RECORD) BEGINS WITH THE JANUARY DATA MONTH AND IS THE NUMBER OF YEARS USED TO COMPUTE THE MEAN. INDIVIDUAL MONTHS WITHIN THE POR MAY BE MISSING.
WHEN THE POR FOR A NORMAL IS LESS THAN 30 YEARS, THE NORMAL IS PROVISIONAL AND IS BASED ON THE NUMBER OF YEARS INDICATED.
0.* OR * INDICATES THE VALUE OR MEAN–DAYS–WITH IS BETWEEN 0.00 AND 0.05.
CLOUDINESS FOR ASOS STATIONS DIFFERS FROM THE NON–ASOS OBSERVATION TAKEN BY A HUMAN OBSERVER. ASOS STATION CLOUDINESS IS BASED ON TIME–AVERAGED CEILOMETER DATA FOR CLOUDS AT OR BELOW 12,000 FEET AND ON SATELLITE DATA FOR CLOUDS ABOVE 12,000 FEET.
THE NUMBER OF DAYS WITH CLEAR, PARTLY CLOUDY, AND CLOUDY CONDITIONS FOR ASOS STATIONS IS THE SUM OF THE CEILOMETER AND SATELLITE DATA FOR THE SUNRISE TO SUNSET PERIOD.
GENERAL CONTINUED:
CLEAR INDICATES 0–2 OKTAS, PARTLY CLOUDY INDICATES 3–6 OKTAS, AND CLOUDY INDICATES 7 OR 8 OKTAS. WHEN AT LEAST ONE OF THE ELEMENTS (CEILOMETER OR SATELLITE) IS MISSING, THE DAILY CLOUDINESS IS NOT COMPUTED.
WIND DIRECTION IS RECORDED IN TENS OF DEGREES (2 DIGITS) CLOCKWISE FROM TRUE NORTH. "00" INDICATES CALM. "36" INDICATES TRUE NORTH.
RESULTANT WIND IS THE VECTOR AVERAGE OF THE SPEED AND DIRECTION.
AVERAGE TEMPERATURE IS THE SUM OF THE MEAN DAILY MAXIMUM AND MINIMUM TEMPERATURE DIVIDED BY 2.
SNOWFALL DATA COMPRISE ALL FORMS OF FROZEN PRECIPITATION, INCLUDING HAIL.
A HEATING (COOLING) DEGREE DAY IS THE DIFFERENCE BETWEEN THE AVERAGE DAILY TEMPERATURE AND 65 F.
DRY BULB IS THE TEMPERATURE OF THE AMBIENT AIR.
DEW POINT IS THE TEMPERATURE TO WHICH THE AIR MUST BE COOLED TO ACHIEVE 100 PERCENT RELATIVE HUMIDITY.
WET BULB IS THE TEMPERATURE THE AIR WOULD HAVE IF THE MOISTURE CONTENT WAS INCREASED TO 100 PERCENT RELATIVE HUMIDITY.
ON JULY 1, 1996, THE NATIONAL WEATHER SERVICE BEGAN USING THE "METAR" OBSERVATION CODE THAT WAS ALREADY EMPLOYED BY MOST OTHER NATIONS OF THE WORLD. THE MOST NOTICEABLE DIFFERENCE IN THIS ANNUAL PUBLICATION WILL BE THE CHANGE IN UNITS FROM TENTHS TO EIGHTS (OKTAS) FOR REPORTING THE AMOUNT OF SKY COVER.
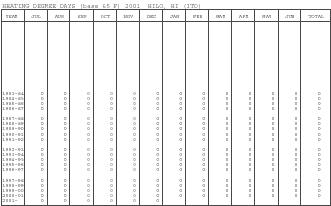
| HEATING DEGREE DAYS (base 65 F) 2001 HILO, HI (ITO) | |||||||||||||
| YEAR | JUL | AUG | SEP | OCT | NOV | DEC | JAN | FEB | MAR | APR | MAY | JUN | TOTAL |
| 1983-84 | 0 | 0 | 0 | 0 | 0 | 0 | 0 | 0 | 0 | 0 | 0 | 0 | 0 |
| 1984-85 | 0 | 0 | 0 | 0 | 0 | 0 | 0 | 0 | 0 | 0 | 0 | 0 | 0 |
| 1985-86 | 0 | 0 | 0 | 0 | 0 | 0 | 0 | 0 | 0 | 0 | 0 | 0 | 0 |
| 1986-87 | 0 | 0 | 0 | 0 | 0 | 0 | 0 | 0 | 0 | 0 | 0 | 0 | 0 |
| 1987-88 | 0 | 0 | 0 | 0 | 0 | 0 | 0 | 0 | 0 | 0 | 0 | 0 | 0 |
| 1988-89 | 0 | 0 | 0 | 0 | 0 | 0 | 0 | 0 | 0 | 0 | 0 | 0 | 0 |
| 1989-90 | 0 | 0 | 0 | 0 | 0 | 0 | 0 | 0 | 0 | 0 | 0 | 0 | 0 |
| 1990-91 | 0 | 0 | 0 | 0 | 0 | 0 | 0 | 0 | 0 | 0 | 0 | 0 | 0 |
| 1991-92 | 0 | 0 | 0 | 0 | 0 | 0 | 0 | 0 | 0 | 0 | 0 | 0 | 0 |
| 1992-93 | 0 | 0 | 0 | 0 | 0 | 0 | 0 | 0 | 0 | 0 | 0 | 0 | 0 |
| 1993-94 | 0 | 0 | 0 | 0 | 0 | 0 | 0 | 0 | 0 | 0 | 0 | 0 | 0 |
| 1994-95 | 0 | 0 | 0 | 0 | 0 | 0 | 0 | 0 | 0 | 0 | 0 | 0 | 0 |
| 1995-96 | 0 | 0 | 0 | 0 | 0 | 0 | 0 | 0 | 0 | 0 | 0 | 0 | 0 |
| 1996-97 | 0 | 0 | 0 | 0 | 0 | 0 | 0 | 0 | 0 | 0 | 0 | 0 | 0 |
| 1997-98 | 0 | 0 | 0 | 0 | 0 | 0 | 0 | 0 | 0 | 0 | 0 | 0 | 0 |
| 1998-99 | 0 | 0 | 0 | 0 | 0 | 0 | 0 | 0 | 0 | 0 | 0 | 0 | 0 |
| 1999-00 | 0 | 0 | 0 | 0 | 0 | 0 | 0 | 0 | 0 | 0 | 0 | 0 | 0 |
| 2000-01 | 0 | 0 | 0 | 0 | 0 | 0 | 0 | 0 | 0 | 0 | 0 | 0 | 0 |
| 2001- | 0 | 0 | 0 | 0 | |||||||||
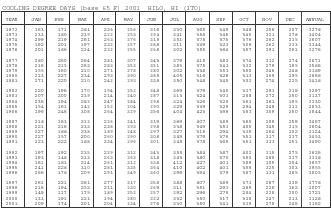
| COOLING DEGREE DAYS (base 65 F) 2001 HILO, HI (ITO) | |||||||||||||
| YEAR | JAN | FEB | MAR | APR | MAY | JUN | JUL | AUG | SEP | OCT | NOV | DEC | ANNUAL |
| 1972 | 163 | 171 | 281 | 236 | 256 | 316 | 330 | 365 | 349 | 348 | 256 | 207 | 3278 |
| 1973 | 233 | 180 | 239 | 222 | 253 | 294 | 341 | 358 | 345 | 340 | 321 | 278 | 3404 |
| 1974 | 299 | 219 | 261 | 263 | 276 | 315 | 351 | 375 | 375 | 376 | 262 | 235 | 3607 |
| 1975 | 192 | 201 | 197 | 232 | 257 | 288 | 311 | 339 | 323 | 309 | 262 | 233 | 3144 |
| 1976 | 201 | 186 | 214 | 222 | 255 | 268 | 302 | 355 | 364 | 357 | 291 | 261 | 3276 |
| 1977 | 280 | 260 | 264 | 281 | 307 | 343 | 379 | 415 | 382 | 374 | 312 | 274 | 3871 |
| 1978 | 216 | 215 | 263 | 283 | 353 | 351 | 383 | 375 | 341 | 332 | 279 | 195 | 3586 |
| 1979 | 155 | 160 | 210 | 271 | 278 | 280 | 302 | 338 | 351 | 350 | 246 | 248 | 3189 |
| 1980 | 213 | 227 | 234 | 293 | 390 | 385 | 405 | 316 | 328 | 313 | 269 | 295 | 3668 |
| 1981 | 271 | 220 | 210 | 242 | 293 | 338 | 350 | 348 | 345 | 302 | 274 | 225 | 3418 |
| 1982 | 220 | 196 | 170 | 194 | 252 | 348 | 369 | 379 | 340 | 317 | 293 | 219 | 3297 |
| 1983 | 207 | 200 | 239 | 214 | 240 | 287 | 313 | 324 | 303 | 288 | 272 | 250 | 3137 |
| 1984 | 236 | 194 | 282 | 247 | 284 | 298 | 324 | 326 | 320 | 363 | 261 | 195 | 3330 |
| 1985 | 154 | 161 | 142 | 152 | 204 | 290 | 329 | 339 | 329 | 294 | 248 | 211 | 2853 |
| 1986 | 196 | 246 | 308 | 264 | 329 | 356 | 404 | 423 | 396 | 363 | 309 | 250 | 3844 |
| 1987 | 218 | 163 | 212 | 226 | 241 | 319 | 369 | 407 | 389 | 365 | 299 | 259 | 3467 |
| 1988 | 221 | 216 | 233 | 238 | 293 | 298 | 338 | 349 | 353 | 405 | 345 | 315 | 3604 |
| 1989 | 227 | 188 | 238 | 189 | 248 | 297 | 327 | 315 | 294 | 335 | 264 | 202 | 3124 |
| 1990 | 227 | 157 | 200 | 260 | 290 | 308 | 349 | 379 | 376 | 353 | 317 | 237 | 3453 |
| 1991 | 223 | 222 | 188 | 234 | 296 | 301 | 348 | 378 | 365 | 351 | 333 | 251 | 3490 |
| 1992 | 197 | 192 | 235 | 229 | 312 | 343 | 355 | 384 | 387 | 402 | 315 | 275 | 3626 |
| 1993 | 193 | 148 | 213 | 263 | 263 | 318 | 343 | 380 | 370 | 350 | 260 | 217 | 3318 |
| 1994 | 161 | 183 | 214 | 261 | 312 | 338 | 412 | 427 | 401 | 389 | 305 | 254 | 3657 |
| 1995 | 241 | 228 | 310 | 281 | 335 | 364 | 410 | 402 | 401 | 355 | 325 | 303 | 3955 |
| 1996 | 266 | 178 | 209 | 291 | 349 | 360 | 396 | 394 | 379 | 387 | 331 | 265 | 3805 |
| 1997 | 261 | 221 | 261 | 277 | 317 | 358 | 388 | 407 | 389 | 373 | 287 | 239 | 3778 |
| 1998 | 216 | 194 | 253 | 211 | 230 | 269 | 311 | 351 | 293 | 289 | 228 | 162 | 3007 |
| 1999 | 149 | 117 | 179 | 189 | 252 | 257 | 292 | 296 | 278 | 284 | 228 | 200 | 2721 |
| 2000 | 133 | 191 | 221 | 194 | 280 | 322 | 332 | 350 | 317 | 328 | 247 | 213 | 3128 |
| 2001 | 209 | 174 | 201 | 204 | 234 | 276 | 330 | 350 | 341 | 319 | 278 | 246 | 3162 |
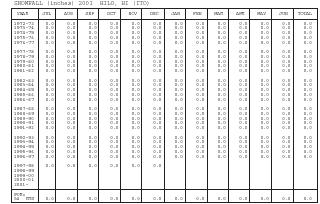
| SNOWFALL (inches) 2001 HILO, HI (ITO) | |||||||||||||
| YEAR | JUL | AUG | SEP | OCT | NOV | DEC | JAN | FEB | MAR | APR | MAY | JUN | TOTAL |
| 1972-73 | 0.0 | 0.0 | 0.0 | 0.0 | 0.0 | 0.0 | 0.0 | 0.0 | 0.0 | 0.0 | 0.0 | 0.0 | 0.0 |
| 1973-74 | 0.0 | 0.0 | 0.0 | 0.0 | 0.0 | 0.0 | 0.0 | 0.0 | 0.0 | 0.0 | 0.0 | 0.0 | 0.0 |
| 1974-75 | 0.0 | 0.0 | 0.0 | 0.0 | 0.0 | 0.0 | 0.0 | 0.0 | 0.0 | 0.0 | 0.0 | 0.0 | 0.0 |
| 1975-76 | 0.0 | 0.0 | 0.0 | 0.0 | 0.0 | 0.0 | 0.0 | 0.0 | 0.0 | 0.0 | 0.0 | 0.0 | 0.0 |
| 1976-77 | 0.0 | 0.0 | 0.0 | 0.0 | 0.0 | 0.0 | 0.0 | 0.0 | 0.0 | 0.0 | 0.0 | 0.0 | 0.0 |
| 1977-78 | 0.0 | 0.0 | 0.0 | 0.0 | 0.0 | 0.0 | 0.0 | 0.0 | 0.0 | 0.0 | 0.0 | 0.0 | 0.0 |
| 1978-79 | 0.0 | 0.0 | 0.0 | 0.0 | 0.0 | 0.0 | 0.0 | 0.0 | 0.0 | 0.0 | 0.0 | 0.0 | 0.0 |
| 1979-80 | 0.0 | 0.0 | 0.0 | 0.0 | 0.0 | 0.0 | 0.0 | 0.0 | 0.0 | 0.0 | 0.0 | 0.0 | 0.0 |
| 1980-81 | 0.0 | 0.0 | 0.0 | 0.0 | 0.0 | 0.0 | 0.0 | 0.0 | 0.0 | 0.0 | 0.0 | 0.0 | 0.0 |
| 1981-82 | 0.0 | 0.0 | 0.0 | 0.0 | 0.0 | 0.0 | 0.0 | 0.0 | 0.0 | 0.0 | 0.0 | 0.0 | 0.0 |
| 1982-83 | 0.0 | 0.0 | 0.0 | 0.0 | 0.0 | 0.0 | 0.0 | 0.0 | 0.0 | 0.0 | 0.0 | 0.0 | 0.0 |
| 1983-84 | 0.0 | 0.0 | 0.0 | 0.0 | 0.0 | 0.0 | 0.0 | 0.0 | 0.0 | 0.0 | 0.0 | 0.0 | 0.0 |
| 1984-85 | 0.0 | 0.0 | 0.0 | 0.0 | 0.0 | 0.0 | 0.0 | 0.0 | 0.0 | 0.0 | 0.0 | 0.0 | 0.0 |
| 1985-86 | 0.0 | 0.0 | 0.0 | 0.0 | 0.0 | 0.0 | 0.0 | 0.0 | 0.0 | 0.0 | 0.0 | 0.0 | 0.0 |
| 1986-87 | 0.0 | 0.0 | 0.0 | 0.0 | 0.0 | 0.0 | 0.0 | 0.0 | 0.0 | 0.0 | 0.0 | 0.0 | 0.0 |
| 1987-88 | 0.0 | 0.0 | 0.0 | 0.0 | 0.0 | 0.0 | 0.0 | 0.0 | 0.0 | 0.0 | 0.0 | 0.0 | 0.0 |
| 1988-89 | 0.0 | 0.0 | 0.0 | 0.0 | 0.0 | 0.0 | 0.0 | 0.0 | 0.0 | 0.0 | 0.0 | 0.0 | 0.0 |
| 1989-90 | 0.0 | 0.0 | 0.0 | 0.0 | 0.0 | 0.0 | 0.0 | 0.0 | 0.0 | 0.0 | 0.0 | 0.0 | 0.0 |
| 1990-91 | 0.0 | 0.0 | 0.0 | 0.0 | 0.0 | 0.0 | 0.0 | 0.0 | 0.0 | 0.0 | 0.0 | 0.0 | 0.0 |
| 1991-92 | 0.0 | 0.0 | 0.0 | 0.0 | 0.0 | 0.0 | 0.0 | 0.0 | 0.0 | 0.0 | 0.0 | 0.0 | 0.0 |
| 1992-93 | 0.0 | 0.0 | 0.0 | 0.0 | 0.0 | 0.0 | 0.0 | 0.0 | 0.0 | 0.0 | 0.0 | 0.0 | 0.0 |
| 1993-94 | 0.0 | 0.0 | 0.0 | 0.0 | 0.0 | 0.0 | 0.0 | 0.0 | 0.0 | 0.0 | 0.0 | 0.0 | 0.0 |
| 1994-95 | 0.0 | 0.0 | 0.0 | 0.0 | 0.0 | 0.0 | 0.0 | 0.0 | 0.0 | 0.0 | 0.0 | 0.0 | 0.0 |
| 1995-96 | 0.0 | 0.0 | 0.0 | 0.0 | 0.0 | 0.0 | 0.0 | 0.0 | 0.0 | 0.0 | 0.0 | 0.0 | 0.0 |
| 1996-97 | 0.0 | 0.0 | 0.0 | 0.0 | 0.0 | 0.0 | 0.0 | 0.0 | 0.0 | 0.0 | 0.0 | 0.0 | 0.0 |
| 1997-98 | 0.0 | 0.0 | 0.0 | 0.0 | 0.0 | 0.0 | |||||||
| 1998-99 | |||||||||||||
| 1999-00 | |||||||||||||
| 2000-01 | |||||||||||||
| 2001- | |||||||||||||
| POR=54 YRS | 0.0 | 0.0 | 0.0 | 0.0 | 0.0 | 0.0 | 0.0 | 0.0 | 0.0 | 0.0 | 0.0 | 0.0 | 0.0 |