2001 JUNEAU, ALASKA (JNU)
Juneau lies well within the area of maritime influences which prevail over the coastal areas of southeastern Alaska, and is in the path of most storms that cross the Gulf of Alaska. Consequently, the area has little sunshine, generally moderate temperatures, and abundant precipitation. In contrast with the characteristic lack of sunshine there are greatly appreciated intervals, sometimes lasting for several days at a stretch, during which clear skies prevail. The rugged terrain exerts a fundamental influence upon local temperatures and the distribution of precipitation, creating considerable variations in both weather elements within relatively short distances.
Temperature variations, both daily and seasonal, are usually confined to relatively narrow limits by the dominant maritime influences. There are, however, periods of comparatively severe cold, which usually start with strong northerly winds, and are most often caused by the flow of cold air from northwestern Canada through nearby mountain passes and over the Juneau ice field. These are generally of brief duration. During such periods strong, gusty winds, known locally as Taku Winds, often occur especially in downtown Juneau, Douglas, and other local areas, but generally they are not felt in the Mendenhall Valley. At times these are strong enough to cause considerable damage. During periods of calm or light winds, temperature differences within short distances are frequently very pronounced. Variations in local sunlight and air drainage patterns produce wide differences in temperatures particularly between upland or sloping areas and areas of low, flat terrain. Juneau International Airport, located on low, flat terrain formed by the Mendenhall River delta, and in the path of drainage air from the Mendenhall Glacier, averages about 10 days a year with minimum readings below zero. Downtown Juneau, located on a sloping portion of a rugged mountain area, experiences on the average only about one day each year with minimum readings below zero. At the airport the growing season averages 146 days, from May 4 to September 28, while the downtown average is 181 days, from April 22 to October 21.
The months of February to June mark the period of lightest precipitation, with monthly averages of about 3 inches. After June the monthly amounts increase gradually, reaching an average of 7.71 inches in October. Due to the rugged topography, precipitation throughout the year tends to vary greatly within short distances. At the Juneau Airport, yearly precipitation is 53 inches while downtown, only 8 miles away, it is 93 inches. The maximum yearly amount received in the city is almost double the maximum received at the airport.
Although a trace of snow has fallen as early as September 9, first falls usually occur in the latter part of October, and sometimes not until the first part of December. On the average there is very little accumulation on the ground at low levels until the last of November, although at higher elevations, and particularly on mountain tops, a cover is usually established in early October. Snow accumulation usually reaches its greatest depth during the middle of February. Individual storms may produce heavy falls as late as the first half of May. However, snow cover is usually gone before the middle of April. Ice accumulations due to alternating thawing and freezing of snow or due to freezing precipitation are frequent problems in the Juneau area during the winter months.
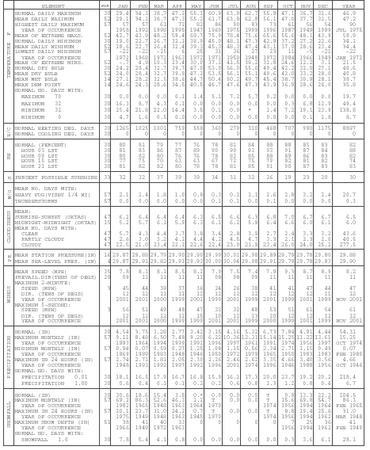
NORMALS, MEANS, AND EXTREMES
JUNEAU, AK (JNU)
LATITUDE: LONGITUDE: ELEVATION (FT): TIME ZONE: WBAN: 25309
58 21′ 18″ N 134 34′ 30″ W GRND: 37 BARO: 40 ALASKA (UTC + 9)
| ELEMENT | POR | JAN | FEB | MAR | APR | MAY | JUN | JUL | AUG | SEP | OCT | NOV | DEC | YEAR | |
| TEMPERATURE F | NORMAL DAILY MAXIMUM | 30 | 29.4 | 34.1 | 38.7 | 47.2 | 55.1 | 60.9 | 63.9 | 62.7 | 55.9 | 47.1 | 36.7 | 31.6 | 46.9 |
| MEAN DAILY MAXIMUM | 52 | 29.1 | 34.1 | 38.7 | 47.3 | 55.2 | 61.7 | 63.8 | 62.8 | 56.1 | 47.0 | 37.7 | 32.5 | 47.2 | |
| HIGHEST DAILY MAXIMUM | 57 | 57 | 57 | 61 | 72 | 82 | 86 | 90 | 83 | 73 | 61 | 56 | 54 | 90 | |
| YEAR OF OCCURRENCE | 1958 | 1992 | 1998 | 1995 | 1947 | 1969 | 1975 | 1999 | 1996 | 1987 | 1949 | 1999 | JUL 1975 | ||
| MEAN OF EXTREME MAXS. | 52 | 42.7 | 43.9 | 48.2 | 59.4 | 69.7 | 75.9 | 78.4 | 75.6 | 65.6 | 55.6 | 48.1 | 43.9 | 58.9 | |
| NORMAL DAILY MINIMUM | 30 | 19.0 | 22.7 | 26.7 | 32.1 | 38.9 | 45.0 | 48.1 | 47.3 | 42.9 | 37.2 | 27.2 | 22.6 | 34.1 | |
| MEAN DAILY MINIMUM | 52 | 18.6 | 22.7 | 26.4 | 32.4 | 39.3 | 45.3 | 48.3 | 47.4 | 43.1 | 37.0 | 28.6 | 23.4 | 34.4 | |
| LOWEST DAILY MINIMUM | 57 | -22 | -22 | -15 | 6 | 25 | 31 | 36 | 27 | 23 | 11 | –5 | -21 | -22 | |
| YEAR OF OCCURRENCE | 1972 | 1968 | 1972 | 1963 | 1972 | 1971 | 1950 | 1948 | 1972 | 1984 | 1966 | 1949 | JAN 1972 | ||
| MEAN OF EXTREME MINS. | 52 | –.7 | 4.9 | 10.3 | 23.4 | 30.0 | 37.2 | 41.5 | 39.2 | 31.8 | 24.6 | 12.2 | 3.1 | 21.5 | |
| NORMAL DRY BULB | 30 | 24.2 | 28.4 | 32.7 | 39.7 | 47.0 | 53.0 | 56.0 | 55.0 | 49.4 | 42.2 | 32.0 | 27.1 | 40.6 | |
| MEAN DRY BULB | 52 | 24.0 | 28.4 | 32.7 | 39.9 | 47.2 | 53.5 | 56.1 | 55.1 | 49.6 | 42.0 | 33.2 | 28.0 | 40.8 | |
| MEAN WET BULB | 14 | 27.1 | 28.2 | 32.5 | 38.6 | 44.7 | 50.4 | 50.2 | 49.7 | 45.4 | 38.7 | 30.9 | 28.1 | 38.7 | |
| MEAN DEW POINT | 14 | 24.6 | 24.3 | 28.6 | 34.5 | 40.5 | 46.7 | 47.6 | 47.3 | 43.9 | 36.9 | 28.6 | 26.0 | 35.8 | |
| NORMAL NO. DAYS WITH: | |||||||||||||||
| MAXIMUM 70 | 30 | 0.0 | 0.0 | 0.0 | 0.1 | 1.4 | 5.1 | 7.2 | 5.7 | 0.2 | 0.0 | 0.0 | 0.0 | 19.7 | |
| MAXIMUM 32 | 30 | 16.3 | 8.7 | 4.3 | 0.1 | 0.0 | 0.0 | 0.0 | 0.0 | 0.0 | 0.3 | 6.8 | 12.9 | 49.4 | |
| MINIMUM 32 | 30 | 25.4 | 21.8 | 22.0 | 14.4 | 3.5 | 0.1 | 0.0 | * | 1.4 | 7.2 | 19.1 | 23.9 | 138.8 | |
| MINIMUM 0 | 30 | 4.7 | 1.6 | 0.5 | 0.0 | 0.0 | 0.0 | 0.0 | 0.0 | 0.0 | 0.0 | 0.1 | 1.8 | 8.7 | |
| H/C | NORMAL HEATING DEG. DAYS | 30 | 1265 | 1025 | 1001 | 759 | 558 | 360 | 279 | 310 | 468 | 707 | 990 | 1175 | 8897 |
| NORMAL COOLING DEG. DAYS | 30 | 0 | 0 | 0 | 0 | 0 | 0 | 0 | 0 | 0 | 0 | 0 | 0 | 0 | |
| RH | NORMAL (PERCENT) | 30 | 80 | 81 | 79 | 77 | 76 | 78 | 81 | 84 | 88 | 88 | 85 | 83 | 82 |
| HOUR 03 LST | 30 | 81 | 83 | 86 | 87 | 89 | 90 | 90 | 92 | 93 | 91 | 87 | 84 | 88 | |
| HOUR 09 LST | 30 | 80 | 82 | 80 | 76 | 76 | 78 | 82 | 85 | 88 | 89 | 86 | 83 | 82 | |
| HOUR 15 LST | 30 | 77 | 75 | 70 | 63 | 63 | 67 | 72 | 75 | 79 | 82 | 81 | 82 | 74 | |
| HOUR 21 LST | 30 | 81 | 82 | 82 | 80 | 78 | 78 | 81 | 85 | 91 | 90 | 87 | 83 | 83 | |
| S | PERCENT POSSIBLE SUNSHINE | 33 | 32 | 32 | 37 | 39 | 39 | 34 | 31 | 32 | 26 | 19 | 23 | 20 | 30 |
| W/O | MEAN NO. DAYS WITH: | ||||||||||||||
| HEAVY FOG (VISBY 1/4 MI) | 57 | 2.1 | 2.4 | 1.8 | 1.0 | 0.8 | 0.3 | 0.2 | 1.1 | 2.6 | 2.8 | 3.2 | 2.4 | 20.7 | |
| THUNDERSTORMS | 57 | 0.0 | 0.0 | 0.0 | 0.0 | 0.0 | 0.1 | 0.1 | 0.0 | 0.1 | 0.0 | 0.0 | 0.0 | 0.3 | |
| CLOUDINESS | MEAN: | ||||||||||||||
| SUNRISE–SUNSET (OKTAS) | 47 | 6.2 | 6.4 | 6.4 | 6.4 | 6.3 | 6.5 | 6.6 | 6.3 | 6.8 | 7.0 | 6.7 | 6.7 | 6.5 | |
| MIDNIGHT–MIDNIGHT (OKTAS) | 15 | 5.2 | 5.7 | 6.1 | 5.9 | 6.3 | 6.1 | 6.2 | 5.9 | 6.4 | 6.6 | 6.0 | 6.1 | 6.0 | |
| MEAN NO. DAYS WITH: | |||||||||||||||
| CLEAR | 47 | 5.7 | 4.3 | 4.4 | 3.7 | 3.8 | 3.4 | 2.8 | 3.9 | 2.7 | 2.4 | 3.3 | 3.2 | 43.6 | |
| PARTLY CLOUDY | 47 | 2.6 | 3.0 | 3.2 | 4.2 | 4.4 | 4.2 | 4.5 | 4.7 | 3.3 | 2.1 | 2.3 | 2.0 | 40.5 | |
| CLOUDY | 47 | 22.5 | 21.0 | 23.4 | 22.1 | 22.6 | 22.4 | 23.0 | 21.9 | 23.4 | 26.0 | 24.0 | 25.2 | 277.5 | |
| PR | MEAN STATION PRESSURE(IN) | 16 | 29.87 | 29.88 | 29.79 | 29.90 | 29.90 | 29.99 | 30.01 | 29.98 | 29.89 | 29.79 | 29.78 | 29.80 | 29.88 |
| MEAN SEA–LEVEL PRES. (IN) | 4 | 29.87 | 29.91 | 29.82 | 29.91 | 29.93 | 30.00 | 30.04 | 29.98 | 29.91 | 29.79 | 29.78 | 29.83 | 29.90 | |
| WINDS | MEAN SPEED (MPH) | 35 | 7.8 | 8.1 | 8.1 | 8.5 | 8.2 | 7.9 | 7.5 | 7.4 | 7.9 | 9.3 | 8.7 | 8.9 | 8.2 |
| PREVAIL. DIR (TENS OF DEGS) | 20 | 09 | 11 | 11 | 11 | 11 | 08 | 08 | 09 | 11 | 11 | 11 | 11 | 11 | |
| MAXIMUM 2–MINUTE: | |||||||||||||||
| SPEED (MPH) | 3 | 45 | 44 | 39 | 37 | 36 | 24 | 26 | 38 | 41 | 41 | 47 | 44 | 47 | |
| DIR. (TENS OF DEGS) | 12 | 12 | 11 | 11 | 12 | 12 | 12 | 12 | 12 | 12 | 12 | 11 | 12 | ||
| YEAR OF OCCURRENCE | 2001 | 2001 | 2000 | 1999 | 2001 | 1999 | 2001 | 1999 | 2001 | 1999 | 2001 | 1999 | NOV 2001 | ||
| MAXIMUM 5–SECOND: | |||||||||||||||
| SPEED (MPH) | 3 | 56 | 51 | 49 | 48 | 47 | 32 | 32 | 48 | 53 | 51 | 61 | 54 | 61 | |
| DIR. (TENS OF DEGS) | 12 | 12 | 12 | 12 | 15 | 10 | 12 | 13 | 20 | 12 | 12 | 12 | 12 | ||
| YEAR OF OCCURRENCE | 2001 | 2001 | 2000 | 1999 | 1999 | 2001 | 2001 | 1999 | 2000 | 1999 | 2001 | 1999 | NOV 2001 | ||
| PRECIPITATION | NORMAL (IN) | 30 | 4.54 | 3.75 | 3.28 | 2.77 | 3.42 | 3.15 | 4.16 | 5.32 | 6.73 | 7.84 | 4.91 | 4.44 | 54.31 |
| MAXIMUM MONTHLY (IN) | 57 | 9.11 | 8.48 | 6.50 | 7.48 | 9.20 | 6.22 | 10.36 | 12.31 | 15.14 | 15.25 | 11.22 | 13.61 | 15.25 | |
| YEAR OF OCCURRENCE | 1993 | 1964 | 1994 | 1999 | 1992 | 1996 | 1997 | 1961 | 1991 | 1974 | 1956 | 1997 | OCT 1974 | ||
| MINIMUM MONTHLY (IN) | 57 | 0.94 | 0.07 | 0.59 | 0.27 | 1.25 | 1.08 | 1.15 | 0.56 | 2.34 | 2.71 | 1.15 | 0.49 | 0.07 | |
| YEAR OF OCCURRENCE | 1969 | 1989 | 1983 | 1948 | 1946 | 1950 | 1972 | 1979 | 1965 | 1950 | 1983 | 1983 | FEB 1989 | ||
| MAXIMUM IN 24 HOURS (IN) | 57 | 2.74 | 2.71 | 1.81 | 2.05 | 2.30 | 2.26 | 2.46 | 2.62 | 3.35 | 4.66 | 3.40 | 3.56 | 4.66 | |
| YEAR OF OCCURRENCE | 1948 | 1993 | 1992 | 1997 | 1992 | 1996 | 2001 | 1974 | 1996 | 1946 | 1988 | 1956 | OCT 1946 | ||
| NORMAL NO. DAYS WITH: | |||||||||||||||
| PRECIPITATION 0.01 | 30 | 18.1 | 16.5 | 17.9 | 16.7 | 16.8 | 15.9 | 16.1 | 17.3 | 20.0 | 23.7 | 19.2 | 20.2 | 218.4 | |
| PRECIPITATION 1.00 | 30 | 0.6 | 0.4 | 0.1 | 0.1 | 0.2 | 0.2 | 0.6 | 0.8 | 1.3 | 1.2 | 0.8 | 0.4 | 6.7 | |
| SNOWFALL | NORMAL (IN) | 30 | 30.6 | 18.6 | 15.4 | 3.5 | 0.* | 0.0 | 0.0 | 0.0 | T | 0.9 | 13.3 | 22.2 | 104.5 |
| MAXIMUM MONTHLY (IN) | 57 | 69.2 | 86.3 | 52.6 | 46.3 | 1.2 | T | 0.0 | 0.0 | T | 15.6 | 69.8 | 54.7 | 86.3 | |
| YEAR OF OCCURRENCE | 1982 | 1965 | 1948 | 1963 | 1964 | 1970 | 1974 | 1956 | 1994 | 1964 | FEB 1965 | ||||
| MAXIMUM IN 24 HOURS (IN) | 57 | 20.1 | 23.7 | 31.0 | 24.2 | 0.7 | T | 0.0 | 0.0 | T | 8.8 | 19.4 | 25.6 | 31.0 | |
| YEAR OF OCCURRENCE | 1975 | 1949 | 1948 | 1963 | 1945 | 1970 | 1974 | 1956 | 1994 | 1962 | MAR 1948 | ||||
| MAXIMUM SNOW DEPTH (IN) | 51 | 38 | 41 | 40 | 33 | 0 | 0 | 0 | 0 | 0 | 7 | 25 | 36 | 41 | |
| YEAR OF OCCURRENCE | 1966 | 1949 | 1972 | 1963 | 1956 | 1994 | 1962 | FEB 1949 | |||||||
| NORMAL NO. DAYS WITH: | |||||||||||||||
| SNOWFALL 1.0 | 30 | 7.8 | 5.4 | 4.1 | 0.8 | 0.0 | 0.0 | 0.0 | 0.0 | 0.0 | 0.3 | 3.6 | 6.1 | 28.1 |
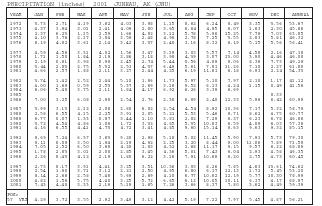
| PRECIPITATION (inches) 2001 JUNEAU, AK (JNU) | |||||||||||||
| YEAR | JAN | FEB | MAR | APR | MAY | JUN | JUL | AUG | SEP | OCT | NOV | DEC | ANNUAL |
| 1972 | 3.73 | 2.71 | 4.19 | 3.62 | 4.03 | 3.98 | 1.15 | 8.62 | 6.24 | 8.49 | 3.35 | 3.56 | 53.67 |
| 1973 | 4.37 | 3.94 | 3.01 | 2.41 | 4.09 | 2.80 | 3.65 | 6.64 | 4.95 | 6.07 | 1.63 | 2.30 | 45.86 |
| 1974 | 2.37 | 6.23 | 1.15 | 2.59 | 1.66 | 4.92 | 3.12 | 5.78 | 5.96 | 15.25 | 7.79 | 7.03 | 63.85 |
| 1975 | 4.10 | 3.76 | 2.17 | 3.04 | 3.59 | 2.48 | 4.96 | 2.78 | 7.25 | 3.55 | 2.83 | 5.81 | 46.32 |
| 1976 | 8.19 | 4.82 | 3.61 | 2.14 | 3.42 | 3.37 | 2.48 | 3.16 | 8.32 | 6.19 | 5.15 | 5.56 | 56.41 |
| 1977 | 4.59 | 4.56 | 3.31 | 4.02 | 1.56 | 3.47 | 3.19 | 3.03 | 5.57 | 7.14 | 4.58 | 2.16 | 47.18 |
| 1978 | 1.71 | 1.50 | 1.84 | 2.19 | 2.86 | 3.18 | 3.98 | 4.39 | 3.07 | 13.00 | 3.90 | 4.46 | 46.08 |
| 1979 | 2.19 | 0.91 | 3.98 | 0.98 | 2.45 | 2.74 | 5.44 | 0.56 | 4.89 | 9.06 | 8.36 | 7.73 | 49.29 |
| 1980 | 3.44 | 2.83 | 2.75 | 5.32 | 2.53 | 4.37 | 6.49 | 5.61 | 7.91 | 11.26 | 7.10 | 2.27 | 61.88 |
| 1981 | 4.66 | 2.57 | 1.88 | 2.11 | 3.27 | 2.44 | 4.25 | 6.19 | 11.61 | 6.18 | 6.93 | 2.24 | 54.33 |
| 1982 | 3.74 | 1.42 | 2.52 | 2.44 | 5.10 | 1.86 | 1.73 | 5.97 | 5.10 | 7.97 | 2.10 | 1.17 | 41.12 |
| 1983 | 4.00 | 1.69 | 0.59 | 2.53 | 5.37 | 2.69 | 3.16 | 9.52 | 6.13 | 4.24 | 1.15 | 0.49 | 41.56 |
| 1984 | 6.06 | 5.40 | 3.75 | 2.11 | 1.84 | 4.17 | 6.92 | 6.26 | 3.39 | 6.69 | |||
| 1985 | 8.33 | ||||||||||||
| 1986 | 7.00 | 3.25 | 6.08 | 2.98 | 2.54 | 2.76 | 2.38 | 6.89 | 2.40 | 12.33 | 5.96 | 6.42 | 60.99 |
| 1987 | 3.99 | 3.13 | 2.12 | 2.08 | 2.60 | 6.02 | 2.54 | 4.54 | 8.92 | 10.36 | 7.17 | 5.32 | 58.79 |
| 1988 | 2.58 | 6.55 | 4.15 | 2.25 | 3.91 | 2.05 | 5.21 | 5.53 | 5.46 | 9.71 | 8.62 | 4.75 | 60.77 |
| 1989 | 6.77 | 0.07 | 1.33 | 0.87 | 3.44 | 1.10 | 3.81 | 2.82 | 7.29 | 6.37 | 6.23 | 6.78 | 46.88 |
| 1990 | 3.72 | 4.54 | 4.86 | 1.06 | 1.72 | 3.32 | 4.65 | 5.35 | 10.63 | 6.59 | 4.89 | 6.03 | 57.36 |
| 1991 | 4.16 | 6.55 | 4.41 | 4.73 | 4.72 | 3.41 | 4.85 | 9.60 | 15.14 | 8.63 | 9.63 | 9.32 | 85.15 |
| 1992 | 8.69 | 7.24 | 6.37 | 3.63 | 9.20 | 2.98 | 5.18 | 5.02 | 11.45 | 5.90 | 7.91 | 5.73 | 79.30 |
| 1993 | 9.11 | 8.09 | 3.50 | 1.94 | 2.19 | 4.92 | 2.25 | 3.20 | 8.44 | 9.00 | 11.06 | 7.89 | 71.59 |
| 1994 | 7.05 | 2.52 | 6.50 | 3.68 | 4.20 | 1.83 | 4.32 | 2.68 | 11.17 | 9.15 | 9.57 | 6.22 | 68.89 |
| 1995 | 1.78 | 2.83 | 3.01 | 2.08 | 2.85 | 3.45 | 4.36 | 5.01 | 7.43 | 6.04 | 2.93 | 4.58 | 46.35 |
| 1996 | 2.26 | 8.43 | 4.12 | 2.19 | 1.80 | 6.22 | 3.16 | 7.91 | 10.68 | 6.20 | 2.75 | 4.73 | 60.45 |
| 1997 | 2.73 | 8.17 | 3.91 | 4.41 | 3.25 | 3.51 | 10.36 | 3.93 | 8.26 | 7.85 | 4.63 | 13.61 | 74.62 |
| 1998 | 2.54 | 1.90 | 3.71 | 3.12 | 2.21 | 2.50 | 4.95 | 6.80 | 6.17 | 12.13 | 1.72 | 5.45 | 53.20 |
| 1999 | 8.14 | 2.66 | 2.58 | 7.48 | 5.69 | 2.69 | 4.10 | 6.77 | 10.62 | 12.19 | 5.77 | 10.30 | 78.99 |
| 2000 | 4.82 | 1.56 | 5.75 | 4.40 | 3.25 | 5.72 | 6.65 | 6.12 | 10.05 | 10.11 | 6.37 | 4.17 | 68.97 |
| 2001 | 7.43 | 4.40 | 3.33 | 2.19 | 5.19 | 1.65 | 7.26 | 3.66 | 8.37 | 7.80 | 3.62 | 4.49 | 59.39 |
| POR=57 YRS | 4.29 | 3.72 | 3.55 | 2.92 | 3.49 | 3.12 | 4.42 | 5.19 | 7.22 | 7.97 | 5.45 | 4.87 | 56.21 |
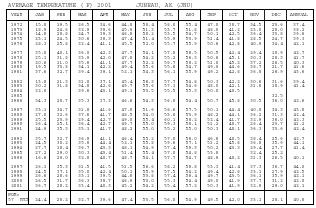
| AVERAGE TEMPERATURE (F) 2001 JUNEAU, AK (JNU) | |||||||||||||
| YEAR | JAN | FEB | MAR | APR | MAY | JUN | JUL | AUG | SEP | OCT | NOV | DEC | ANNUAL |
| 1972 | 15.8 | 19.5 | 26.5 | 34.6 | 44.8 | 50.4 | 58.0 | 55.4 | 47.0 | 38.7 | 34.5 | 23.6 | 37.4 |
| 1973 | 18.9 | 24.6 | 32.9 | 39.6 | 45.9 | 51.3 | 53.7 | 51.8 | 48.0 | 41.2 | 23.0 | 28.0 | 38.2 |
| 1974 | 14.8 | 28.8 | 24.7 | 39.3 | 46.8 | 50.2 | 53.5 | 54.7 | 50.1 | 42.5 | 36.4 | 33.8 | 39.6 |
| 1975 | 23.1 | 24.5 | 30.6 | 38.3 | 47.4 | 51.4 | 55.9 | 53.9 | 51.4 | 41.8 | 28.5 | 24.7 | 39.3 |
| 1976 | 28.3 | 25.8 | 32.4 | 41.1 | 45.5 | 52.0 | 55.7 | 55.9 | 50.6 | 42.8 | 40.9 | 34.4 | 42.1 |
| 1977 | 35.0 | 40.1 | 36.0 | 42.3 | 47.7 | 54.1 | 57.0 | 58.5 | 50.5 | 42.4 | 29.4 | 18.9 | 42.7 |
| 1978 | 25.1 | 31.8 | 33.9 | 42.0 | 47.8 | 54.2 | 55.2 | 56.3 | 50.6 | 45.1 | 30.3 | 28.3 | 41.7 |
| 1979 | 20.6 | 11.0 | 35.6 | 41.1 | 47.7 | 52.2 | 56.7 | 58.2 | 51.0 | 45.2 | 37.2 | 26.5 | 40.3 |
| 1980 | 19.5 | 33.8 | 34.1 | 42.2 | 49.4 | 55.6 | 55.6 | 54.7 | 49.0 | 44.6 | 38.7 | 21.7 | 41.6 |
| 1981 | 37.6 | 32.7 | 39.4 | 39.1 | 52.1 | 54.3 | 56.1 | 55.9 | 49.2 | 42.8 | 36.8 | 26.9 | 43.6 |
| 1982 | 13.8 | 21.3 | 31.8 | 37.1 | 45.4 | 56.3 | 57.7 | 54.8 | 50.3 | 42.2 | 30.6 | 31.6 | 39.4 |
| 1983 | 30.2 | 31.8 | 34.8 | 42.6 | 49.7 | 55.6 | 57.1 | 54.6 | 48.0 | 42.1 | 31.8 | 18.9 | 41.4 |
| 1984 | 32.0 | 39.6 | 43.1 | 49.1 | 53.5 | 55.5 | 55.3 | 50.0 | 40.5 | ||||
| 1985 | 32.5 | ||||||||||||
| 1986 | 34.3 | 28.7 | 35.3 | 37.3 | 46.6 | 54.3 | 56.8 | 54.4 | 50.7 | 45.8 | 30.5 | 36.0 | 42.6 |
| 1987 | 33.1 | 34.7 | 31.8 | 41.6 | 47.8 | 51.6 | 58.6 | 57.5 | 50.1 | 44.4 | 40.0 | 34.3 | 43.8 |
| 1988 | 27.0 | 32.6 | 37.6 | 41.7 | 48.5 | 54.0 | 53.8 | 53.9 | 48.2 | 44.1 | 36.2 | 31.3 | 42.4 |
| 1989 | 25.5 | 23.9 | 29.4 | 42.7 | 49.0 | 55.4 | 60.1 | 58.2 | 52.4 | 41.7 | 32.9 | 36.0 | 42.3 |
| 1990 | 26.4 | 25.1 | 36.4 | 42.7 | 49.7 | 55.0 | 59.3 | 58.1 | 51.2 | 40.7 | 26.4 | 23.7 | 41.2 |
| 1991 | 24.9 | 35.3 | 33.1 | 41.7 | 48.2 | 55.0 | 55.2 | 55.0 | 50.3 | 40.1 | 36.3 | 33.6 | 42.4 |
| 1992 | 35.7 | 32.7 | 36.9 | 41.1 | 46.4 | 55.2 | 57.0 | 56.0 | 46.8 | 40.5 | 38.4 | 25.6 | 42.7 |
| 1993 | 24.5 | 30.2 | 35.8 | 44.4 | 52.1 | 55.8 | 59.6 | 57.1 | 51.2 | 45.8 | 36.8 | 35.9 | 44.1 |
| 1994 | 27.7 | 18.4 | 36.7 | 43.3 | 48.1 | 54.9 | 57.4 | 59.3 | 50.2 | 43.3 | 29.4 | 27.7 | 41.4 |
| 1995 | 27.2 | 29.0 | 30.3 | 43.4 | 51.4 | 55.4 | 57.0 | 54.8 | 53.8 | 32.4 | 25.2 | ||
| 1996 | 16.6 | 29.0 | 32.8 | 40.7 | 48.7 | 54.1 | 57.7 | 54.7 | 48.9 | 40.2 | 31.3 | 26.5 | 40.1 |
| 1997 | 26.1 | 35.3 | 31.5 | 41.5 | 51.5 | 56.6 | 58.2 | 58.8 | 53.3 | 41.4 | 37.3 | 36.7 | 44.0 |
| 1998 | 24.5 | 37.1 | 35.0 | 42.4 | 50.1 | 55.9 | 57.5 | 54.2 | 49.4 | 42.8 | 33.1 | 27.9 | 42.5 |
| 1999 | 26.6 | 28.6 | 33.1 | 39.5 | 44.8 | 53.8 | 57.4 | 56.4 | 49.7 | 43.5 | 36.1 | 35.9 | 42.1 |
| 2000 | 26.5 | 31.7 | 36.3 | 39.7 | 46.9 | 53.0 | 55.3 | 54.4 | 49.0 | 41.9 | 37.7 | 31.2 | 42.0 |
| 2001 | 36.7 | 28.2 | 33.4 | 40.3 | 45.2 | 54.2 | 55.4 | 57.2 | 50.3 | 41.9 | 32.9 | 29.0 | 42.1 |
| POR=57 YRS | 24.4 | 28.2 | 32.7 | 39.6 | 47.4 | 53.5 | 56.0 | 54.9 | 49.5 | 42.0 | 33.1 | 28.1 | 40.8 |
REFERENCE NOTES:
PAGE 1:
THE TEMPERATURE GRAPH SHOWS NORMAL MAXIMUM AND NORMAL MINIMUM DAILY TEMPERATURES (SOLID CURVES) AND THE ACTUAL DAILY HIGH AND LOW TEMPERATURES (VERTICAL BARS).
PAGE 2 AND 3:
H/C INDICATES HEATING AND COOLING DEGREE DAYS.
RH INDICATES RELATIVE HUMIDITY
W/O INDICATES WEATHER AND OBSTRUCTIONS
S INDICATES SUNSHINE.
PR INDICATES PRESSURE.
CLOUDINESS ON PAGE 3 IS THE SUM OF THE CEILOMETER AND SATELLITE DATA NOT TO EXCEED EIGHT EIGHTHS (OKTAS).
GENERAL:
T INDICATES TRACE PRECIPITATION, AN AMOUNT GREATER THAN ZERO BUT LESS THAN THE LOWEST REPORTABLE VALUE.
+ INDICATES THE VALUE ALSO OCCURS ON EARLIER DATES.
BLANK ENTRIES DENOTE MISSING OR UNREPORTED DATA.
NORMALS ARE 30–YEAR AVERAGES (1961–1990).
ASOS INDICATES AUTOMATED SURFACE OBSERVING SYSTEM.
PM INDICATES THE LAST DAY OF THE PREVIOUS MONTH.
POR (PERIOD OF RECORD) BEGINS WITH THE JANUARY DATA MONTH AND IS THE NUMBER OF YEARS USED TO COMPUTE THE MEAN. INDIVIDUAL MONTHS WITHIN THE POR MAY BE MISSING.
WHEN THE POR FOR A NORMAL IS LESS THAN 30 YEARS, THE NORMAL IS PROVISIONAL AND IS BASED ON THE NUMBER OF YEARS INDICATED.
0.* OR * INDICATES THE VALUE OR MEAN–DAYS–WITH IS BETWEEN 0.00 AND 0.05.
CLOUDINESS FOR ASOS STATIONS DIFFERS FROM THE NON–ASOS OBSERVATION TAKEN BY A HUMAN OBSERVER. ASOS STATION CLOUDINESS IS BASED ON TIME–AVERAGED CEILOMETER DATA FOR CLOUDS AT OR BELOW 12,000 FEET AND ON SATELLITE DATA FOR CLOUDS ABOVE 12,000 FEET.
THE NUMBER OF DAYS WITH CLEAR, PARTLY CLOUDY, AND CLOUDY CONDITIONS FOR ASOS STATIONS IS THE SUM OF THE CEILOMETER AND SATELLITE DATA FOR THE SUNRISE TO SUNSET PERIOD.
GENERAL CONTINUED:
CLEAR INDICATES 0–2 OKTAS, PARTLY CLOUDY INDICATES 3–6 OKTAS, AND CLOUDY INDICATES 7 OR 8 OKTAS. WHEN AT LEAST ONE OF THE ELEMENTS (CEILOMETER OR SATELLITE) IS MISSING, THE DAILY CLOUDINESS IS NOT COMPUTED.
WIND DIRECTION IS RECORDED IN TENS OF DEGREES (2 DIGITS) CLOCKWISE FROM TRUE NORTH. "00" INDICATES CALM. "36" INDICATES TRUE NORTH.
RESULTANT WIND IS THE VECTOR AVERAGE OF THE SPEED AND DIRECTION.
AVERAGE TEMPERATURE IS THE SUM OF THE MEAN DAILY MAXIMUM AND MINIMUM TEMPERATURE DIVIDED BY 2.
SNOWFALL DATA COMPRISE ALL FORMS OF FROZEN PRECIPITATION, INCLUDING HAIL.
A HEATING (COOLING) DEGREE DAY IS THE DIFFERENCE BETWEEN THE AVERAGE DAILY TEMPERATURE AND 65 F.
DRY BULB IS THE TEMPERATURE OF THE AMBIENT AIR.
DEW POINT IS THE TEMPERATURE TO WHICH THE AIR MUST BE COOLED TO ACHIEVE 100 PERCENT RELATIVE HUMIDITY.
WET BULB IS THE TEMPERATURE THE AIR WOULD HAVE IF THE MOISTURE CONTENT WAS INCREASED TO 100 PERCENT RELATIVE HUMIDITY.
ON JULY 1, 1996, THE NATIONAL WEATHER SERVICE BEGAN USING THE "METAR" OBSERVATION CODE THAT WAS ALREADY EMPLOYED BY MOST OTHER NATIONS OF THE WORLD. THE MOST NOTICEABLE DIFFERENCE IN THIS ANNUAL PUBLICATION WILL BE THE CHANGE IN UNITS FROM TENTHS TO EIGHTS (OKTAS) FOR REPORTING THE AMOUNT OF SKY COVER.
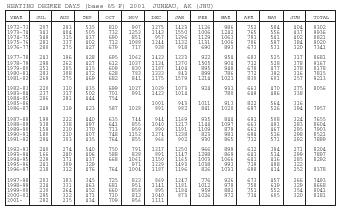
| HEATING DEGREE DAYS (base 65 F) 2001 JUNEAU, AK (JNU) | |||||||||||||
| YEAR | JUL | AUG | SEP | OCT | NOV | DEC | JAN | FEB | MAR | APR | MAY | JUN | TOTAL |
| 1972–73 | 207 | 293 | 535 | 810 | 907 | 1275 | 1423 | 1126 | 986 | 752 | 584 | 404 | 9302 |
| 1973–74 | 343 | 404 | 505 | 732 | 1253 | 1143 | 1550 | 1006 | 1242 | 765 | 556 | 437 | 9936 |
| 1974–75 | 349 | 315 | 437 | 690 | 851 | 957 | 1296 | 1129 | 1063 | 791 | 541 | 402 | 8821 |
| 1975–76 | 281 | 337 | 402 | 712 | 1088 | 1244 | 1132 | 1131 | 1006 | 706 | 597 | 384 | 9020 |
| 1976–77 | 280 | 275 | 427 | 679 | 717 | 938 | 918 | 690 | 893 | 673 | 531 | 320 | 7341 |
| 1977–78 | 243 | 196 | 428 | 695 | 1062 | 1423 | 1233 | 922 | 954 | 683 | 525 | 317 | 8681 |
| 1978–79 | 298 | 262 | 427 | 612 | 1037 | 1134 | 1370 | 1505 | 904 | 712 | 528 | 378 | 9167 |
| 1979–80 | 251 | 205 | 415 | 609 | 830 | 1187 | 1404 | 895 | 949 | 678 | 477 | 278 | 8178 |
| 1980–81 | 283 | 308 | 472 | 628 | 783 | 1333 | 843 | 899 | 786 | 772 | 392 | 316 | 7815 |
| 1981–82 | 269 | 275 | 469 | 682 | 841 | 1175 | 1579 | 1214 | 1021 | 830 | 601 | 257 | 9213 |
| 1982–83 | 220 | 310 | 435 | 699 | 1027 | 1029 | 1073 | 924 | 931 | 663 | 470 | 275 | 8056 |
| 1983–84 | 237 | 317 | 502 | 701 | 991 | 1423 | 1014 | 780 | 649 | 486 | 338 | ||
| 1984–85 | 286 | 291 | 444 | 754 | |||||||||
| 1985–86 | 1001 | 943 | 1011 | 913 | 822 | 564 | 316 | ||||||
| 1986–87 | 249 | 319 | 423 | 587 | 1028 | 891 | 982 | 841 | 1020 | 697 | 526 | 394 | 7957 |
| 1987–88 | 199 | 222 | 440 | 635 | 744 | 944 | 1169 | 935 | 844 | 691 | 508 | 324 | 7655 |
| 1988-89 | 338 | 338 | 497 | 641 | 855 | 1040 | 1217 | 1144 | 1097 | 663 | 491 | 283 | 8604 |
| 1989-90 | 159 | 210 | 370 | 713 | 959 | 890 | 1191 | 1109 | 879 | 661 | 467 | 295 | 7903 |
| 1990-91 | 180 | 210 | 407 | 748 | 1152 | 1274 | 1238 | 823 | 981 | 694 | 516 | 298 | 8521 |
| 1991–92 | 294 | 303 | 435 | 764 | 855 | 966 | 902 | 930 | 865 | 712 | 571 | 292 | 7889 |
| 1992-93 | 240 | 274 | 540 | 750 | 791 | 1217 | 1250 | 966 | 899 | 612 | 394 | 271 | 8204 |
| 1993–94 | 166 | 240 | 406 | 588 | 838 | 891 | 1147 | 1298 | 869 | 641 | 514 | 299 | 7897 |
| 1994–95 | 229 | 171 | 437 | 668 | 1061 | 1150 | 1165 | 1003 | 1066 | 641 | 416 | 285 | 8292 |
| 1995–96 | 241 | 309 | 329 | 971 | 1229 | 1493 | 1038 | 993 | 719 | 498 | 322 | ||
| 1996–97 | 218 | 312 | 476 | 764 | 1004 | 1187 | 1196 | 826 | 1031 | 698 | 414 | 252 | 8378 |
| 1997–98 | 203 | 183 | 345 | 725 | 823 | 869 | 1247 | 776 | 926 | 673 | 457 | 266 | 7493 |
| 1998–99 | 224 | 331 | 463 | 681 | 951 | 1141 | 1181 | 1012 | 978 | 758 | 619 | 329 | 8668 |
| 1999–00 | 230 | 264 | 452 | 660 | 858 | 895 | 1184 | 959 | 882 | 751 | 552 | 354 | 8041 |
| 2000–01 | 295 | 322 | 471 | 710 | 813 | 1040 | 873 | 1026 | 972 | 734 | 605 | 320 | 8181 |
| 2001– | 292 | 235 | 434 | 709 | 956 | 1111 | |||||||
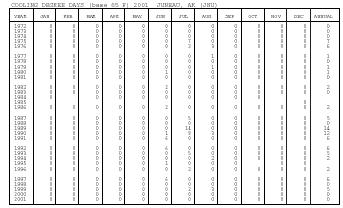
| COOLING DEGREE DAYS (base 65 F) 2001 JUNEAU, AK (JNU) | |||||||||||||
| YEAR | JAN | FEB | MAR | APR | MAY | JUN | JUL | AUG | SEP | OCT | NOV | DEC | ANNUAL |
| 1972 | 0 | 0 | 0 | 0 | 0 | 0 | 0 | 0 | 0 | 0 | 0 | 0 | 0 |
| 1973 | 0 | 0 | 0 | 0 | 0 | 0 | 0 | 0 | 0 | 0 | 0 | 0 | 0 |
| 1974 | 0 | 0 | 0 | 0 | 0 | 0 | 0 | 0 | 0 | 0 | 0 | 0 | 0 |
| 1975 | 0 | 0 | 0 | 0 | 0 | 0 | 7 | 0 | 0 | 0 | 0 | 0 | 7 |
| 1976 | 0 | 0 | 0 | 0 | 0 | 0 | 3 | 3 | 0 | 0 | 0 | 0 | 6 |
| 1977 | 0 | 0 | 0 | 0 | 0 | 0 | 0 | 1 | 0 | 0 | 0 | 0 | 1 |
| 1978 | 0 | 0 | 0 | 0 | 0 | 0 | 0 | 0 | 0 | 0 | 0 | 0 | 0 |
| 1979 | 0 | 0 | 0 | 0 | 0 | 0 | 0 | 1 | 0 | 0 | 0 | 0 | 1 |
| 1980 | 0 | 0 | 0 | 0 | 0 | 1 | 0 | 0 | 0 | 0 | 0 | 0 | 1 |
| 1981 | 0 | 0 | 0 | 0 | 0 | 0 | 0 | 0 | 0 | 0 | 0 | 0 | 0 |
| 1982 | 0 | 0 | 0 | 0 | 0 | 2 | 0 | 0 | 0 | 0 | 0 | 0 | 2 |
| 1983 | 0 | 0 | 0 | 0 | 0 | 0 | 0 | 0 | 0 | 0 | 0 | 0 | 0 |
| 1984 | 0 | 0 | 0 | 0 | 0 | 0 | 0 | 0 | 0 | ||||
| 1985 | 0 | ||||||||||||
| 1986 | 0 | 0 | 0 | 0 | 0 | 2 | 0 | 0 | 0 | 0 | 0 | 0 | 2 |
| 1987 | 0 | 0 | 0 | 0 | 0 | 0 | 5 | 0 | 0 | 0 | 0 | 0 | 5 |
| 1988 | 0 | 0 | 0 | 0 | 0 | 0 | 0 | 0 | 0 | 0 | 0 | 0 | 0 |
| 1989 | 0 | 0 | 0 | 0 | 0 | 0 | 14 | 0 | 0 | 0 | 0 | 0 | 14 |
| 1990 | 0 | 0 | 0 | 0 | 0 | 1 | 8 | 3 | 0 | 0 | 0 | 0 | 12 |
| 1991 | 0 | 0 | 0 | 0 | 0 | 6 | 0 | 0 | 0 | 0 | 0 | 0 | 6 |
| 1992 | 0 | 0 | 0 | 0 | 0 | 6 | 0 | 0 | 0 | 0 | 0 | 0 | 6 |
| 1993 | 0 | 0 | 0 | 0 | 0 | 0 | 5 | 0 | 0 | 0 | 0 | 0 | 5 |
| 1994 | 0 | 0 | 0 | 0 | 0 | 0 | 0 | 2 | 0 | 0 | 0 | 0 | 2 |
| 1995 | 0 | 0 | 0 | 0 | 0 | 1 | 0 | 0 | 0 | 0 | 0 | ||
| 1996 | 0 | 0 | 0 | 0 | 0 | 0 | 2 | 0 | 0 | 0 | 0 | 0 | 2 |
| 1997 | 0 | 0 | 0 | 0 | 0 | 6 | 0 | 0 | 0 | 0 | 0 | 0 | 6 |
| 1998 | 0 | 0 | 0 | 0 | 0 | 0 | 0 | 0 | 0 | 0 | 0 | 0 | 0 |
| 1999 | 0 | 0 | 0 | 0 | 0 | 0 | 2 | 3 | 0 | 0 | 0 | 0 | 5 |
| 2000 | 0 | 0 | 0 | 0 | 0 | 0 | 0 | 0 | 0 | 0 | 0 | 0 | 0 |
| 2001 | 0 | 0 | 0 | 0 | 0 | 0 | 0 | 0 | 0 | 0 | 0 | 0 | 0 |
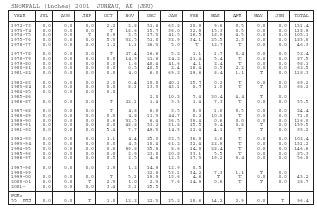
| SNOWFALL (inches) 2001 JUNEAU, AK (JNU) | |||||||||||||
| YEAR | JUL | AUG | SEP | OCT | NOV | DEC | JAN | FEB | MAR | APR | MAY | JUN | TOTAL |
| 1972–73 | 0.0 | 0.0 | 0.0 | 2.2 | 2.8 | 31.6 | 63.8 | 20.9 | 9.6 | 0.5 | 0.0 | 0.0 | 131.4 |
| 1973–74 | 0.0 | 0.0 | 0.0 | T | 18.6 | 15.7 | 36.0 | 32.8 | 15.3 | 0.5 | 0.0 | 0.0 | 118.9 |
| 1974–75 | 0.0 | 0.0 | T | 0.9 | 3.5 | 17.3 | 41.5 | 16.5 | 18.9 | 4.5 | 0.0 | 0.0 | 103.1 |
| 1975–76 | 0.0 | 0.0 | 0.0 | 5.3 | 32.5 | 51.0 | 32.9 | 34.1 | 25.5 | 2.3 | 0.0 | 0.0 | 183.6 |
| 1976–77 | 0.0 | 0.0 | 0.0 | 1.2 | 1.1 | 26.3 | 5.0 | T | 12.7 | T | 0.0 | 0.0 | 46.3 |
| 1977–78 | 0.0 | 0.0 | 0.0 | T | 27.4 | 16.6 | 5.2 | 1.1 | 1.7 | 0.4 | 0.0 | 0.0 | 52.4 |
| 1978–79 | 0.0 | 0.0 | 0.0 | 0.0 | 14.9 | 21.6 | 24.2 | 21.4 | 5.4 | T | 0.0 | 0.0 | 87.5 |
| 1979–80 | 0.0 | 0.0 | 0.0 | 0.0 | 1.6 | 48.4 | 41.6 | 4.1 | 2.4 | T | 0.0 | 0.0 | 98.1 |
| 1980–81 | 0.0 | 0.0 | 0.0 | 0.0 | 0.5 | 40.5 | 2.4 | 16.4 | 0.5 | 2.2 | 0.0 | 0.0 | 62.5 |
| 1981–82 | 0.0 | 0.0 | 0.0 | 0.0 | 4.0 | 6.0 | 69.2 | 29.6 | 8.4 | 1.1 | T | 0.0 | 118.3 |
| 1982–83 | 0.0 | 0.0 | 0.0 | 2.0 | 0.4 | 10.8 | 40.1 | 15.7 | 0.2 | T | 0.0 | 0.0 | 69.2 |
| 1983–84 | 0.0 | 0.0 | 0.0 | 0.0 | 8.1 | 13.3 | 43.1 | 0.7 | 1.0 | T | T | 0.0 | 66.2 |
| 1984–85 | 0.0 | 0.0 | 0.0 | 0.0 | |||||||||
| 1985–86 | 2.0 | 10.3 | 7.4 | 30.4 | 4.4 | T | 0.0 | ||||||
| 1986–87 | 0.0 | 0.0 | 0.0 | T | 22.1 | 1.4 | 3.3 | 1.4 | 7.3 | T | 0.0 | 0.0 | 35.5 |
| 1987–88 | 0.0 | 0.0 | 0.0 | T | 4.6 | 6.8 | 3.5 | 8.0 | 1.0 | 0.5 | 0.0 | 0.0 | 24.4 |
| 1988-89 | 0.0 | 0.0 | 0.0 | 0.0 | 4.8 | 11.3 | 44.7 | 0.2 | 10.0 | T | 0.0 | 0.0 | 71.0 |
| 1989-90 | 0.0 | 0.0 | 0.0 | 0.6 | 32.5 | 6.4 | 36.5 | 39.4 | 0.6 | 0.0 | 0.0 | 0.0 | 116.0 |
| 1990-91 | 0.0 | 0.0 | 0.0 | 0.0 | 48.8 | 33.2 | 31.8 | 15.5 | 9.4 | 0.8 | T | 0.0 | 139.5 |
| 1991–92 | 0.0 | 0.0 | 0.0 | 5.4 | 7.7 | 49.3 | 14.3 | 12.4 | 4.1 | T | T | 0.0 | 93.2 |
| 1992-93 | 0.0 | 0.0 | 0.0 | 1.1 | 4.4 | 25.0 | 32.5 | 36.8 | 2.6 | T | 0.0 | 0.0 | 102.4 |
| 1993–94 | 0.0 | 0.0 | 0.0 | 0.0 | 4.3 | 10.4 | 61.2 | 32.4 | 22.9 | T | 0.0 | 0.0 | 131.2 |
| 1994–95 | 0.0 | 0.0 | 0.0 | 0.0 | 69.8 | 25.8 | 8.6 | 14.0 | 28.4 | T | 0.0 | 0.0 | 146.6 |
| 1995–96 | 0.0 | 0.0 | 0.0 | 0.0 | 2.9 | 23.0 | 20.8 | 33.1 | 5.5 | T | 0.0 | 0.0 | 85.3 |
| 1996–97 | 0.0 | 0.0 | 0.0 | 0.5 | 2.5 | 4.6 | 12.3 | 17.3 | 19.2 | 0.4 | 0.0 | 0.0 | 56.8 |
| 1997–98 | 0.0 | 0.0 | 0.0 | 1.9 | 1.2 | 14.9 | 12.9 | 0.5 | |||||
| 1998–99 | 22.8 | 53.1 | 34.2 | 7.3 | 1.1 | T | 0.0 | ||||||
| 1999–00 | 0.0 | 0.0 | 0.0 | T | 5.1 | 19.9 | 13.6 | 4.6 | T | T | 0.0 | 0.0 | 43.2 |
| 2000–01 | 0.0 | 0.0 | T | 2.3 | 1.0 | 2.3 | 7.6 | 14.9 | 0.6 | T | T | 0.0 | 28.7 |
| 2001– | 0.0 | 0.0 | 0.0 | 3.4 | 3.1 | 25.5 | |||||||
| POR=55 YRS | 0.0 | 0.0 | T | 1.0 | 12.2 | 22.3 | 25.2 | 18.6 | 14.2 | 2.9 | 0.0 | T | 96.4 |