Weather Information & Communications
NATIONAL WEATHER SERVICE
The National Weather Service (NWS) continues full-scale redevelopment of its systems and its organization.
Applied research conducted in the National Oceanic and Atmospheric Administration's (NOAA) Environmental Research Laboratories and other federal laboratories has demonstrated that state-of-the-art laboratory techniques for analyzing and predicting severe weather and flood phenomena can be practicably applied to Weather Service operations. Because the scientific understanding of the atmosphere and the ability to forecast large- and small-scale weather phenomena has increased dramatically over the last two decades, the Department of Commerce has set an ambitious goal for NOAA's agency, the National Weather Service. The Service is to be modernized, to take full advantage of hundreds of new technological tools for upgrading weather forecasting.
In 1988, Public Law 100-685 was enacted and, in part, specifies conditions on the planning, reporting, and accomplishment of the modernization and associated restructuring of the NWS. This strategic plan was the first response to Congress required by Public Law 100-685.
Principles for the modernization and associated restructuring
Throughout the process of change, the NWS will continue to fulfill its mission, which is to provide weather and flood warnings, public forecasts, and advisories for all of the United States, its territories, adjacent waters, and ocean areas, primarily for the protection of life and property. NWS data and products will continue to be provided to private meteorologists for the provision of all specialized services. Certain principles are essential to meet the operational mission and will be continued during the modernization and associated restructuring transition period.
The need to implement new science and technology
The most deadly of our nation's weather events—tornadoes, severe thunderstorms, lightning, and flash floods—are also the most difficult to detect and forecast. The new systems being installed will enable earlier detection and permit the short-range prediction of destructive, violent local storms and floods. The new observational technologies implemented this decade will provide unprecedented amounts of complex data, thereby requiring that the operational forecasters have higher levels of analytical and interpretive skills. This will require training personnel and the deployment of proven, new observational information processing, and communications technologies.
New equipment, new methods
Until recently, the vintage technologies that composed part of earlier weather service infrastructure were in desperate need of replacement. As the equipment aged, it became costly to maintain. By replacing the equipment with more reliable technologies that support the new scientific capabilities, the nation can move into the future with strengthened confidence in its atmospheric prediction capabilities.
New technological systems are essential in providing the opportunity to improve warning and forecast services and for replacing obsolete and increasingly unreliable existing systems. Each of the new technologies to be installed plays a unique, but complementary role in the modernization process. New observational technologies will yield high-resolution, time-variant, three-dimensional representations of details on the state of the atmosphere.
At Weather Forecast Offices, new data processing systems aid the forecaster in the assimilation of changing data and numerical weather prediction outputs. The meteorologist and hydrologist are able to rapidly manipulate, display, and analyze information, thus enabling them to combine scientific principles and operational experience to produce more accurate and timely warning and forecast services for the nation. The new high-resolution data sets and derived information are an important input to business and economic decision making outside the NWS.
The NWS is joined in its acquisition of much of the major new technologies by the Department of Transportation's
National Weather Service Milestones
1891 Weather Bureau becomes responsible for issuing flood warnings.
1894 William Eddy, using kites, makes first temperatures observations aloft.
1895 First Washington daily weather map published. Expanded version, covering the nation, is still published weekly.
1898 President McKinley orders establishment of hurricane warning network in the West Indies.
1900 Cable exchange of weather warnings/information begins with Europe. Devastating Galveston Hurricane kills 6000 including wife of Official-In-Charge and one employee Hurricane was predicted 4 days in advance, but not the storm surge.
1901 Official three-day forecasts begin for the North Atlantic.
1904 Government begins using aircraft to conduct atmospheric research.
1905 The SS New York transmits first wireless weather report from a ship at sea.
1909 USWB begins free-rising balloon observations.
1910 USWB begins weekly agricultural planning forecasts and seasonal assessment of water availability for irrigation.
1912 First fire weather forecast issued.
1914 Aerological section established for aviation.
1917 Norwegian meteorologists begin air mass analysis techniques which will revolutionize meteorology.
1918 USWB begins forecasts for domestic military flights and new air mail routes.
1922 Histories of 500 river stations completed.
1927 West Coast prototype for an Airways Meteorological Service established. Lindbergh flys the Atlantic, ignoring a recommended Weather Bureau delay of 12 hours. The forecast was right on.
1928 Teletype replaces the telegraph. Telephone service becomes primary method of communicating weather information.
1931 Aircraft observations to 16,000 feet begin at Chicago, Cleveland, Dallas, and Omaha. The beginning of the end for "kite stations".
1933 A science advisory group apprises President Roosevelt that the work of the volunteer cooperative observer network is one of the most extraordinary services ever developed, netting the public more per dollar expended than any other government service in the world. By 1990 the 25 mile radius network encompasses nearly 10,000 stations.
1935 A hurricane warning service is established. The Smithsonian Institution begins making long-range weather forecasts based on solar cycles. Floating automatic weather instruments mounted on buoys begin collecting marine weather data.
1937 First official Weather Bureau radio meteorograph, or radiosonde sounding made at East Boston, Mass. This program spells the end for aircraft soundings. Twelve pilots die flying weather missions.
1939 USWB initiates automatic telephone weather service in New York City. Radiosondes replace all military and Weather Bureau aircraft observations.
1940 USWB transferred to Department of Commerce. Army and Navy establish weather centers. President Roosevelt orders Coast Guard to man ocean weather stations.
1942 A Central Analysis Center, forerunner of the National Meteorological Center (NMC), is created. Navy gives the USWB 25 surplus aircraft radars to be modified for ground meteorological use marking the start of the first weather radar system in the U.S.
1948 Air Force meteorologists issue first tornado warning from a military installation. Princeton's Institute for Advanced Studies begins research into use of a computer for weather forecasting. Chicago Weather Bureau office demonstrates use of facsimile for map transmission.
1950 30-day outlooks and "tornado alerts" begin.
1951 Forerunner of the National Severe Storms Forecast Center begins at Tinker AFB, OK. National Weather Records Center opens at Asheville.
1952 USWB organizes Severe Local Storms Forecasting Unit in Washington and begins issuing tornado forecasts.
1954 The USWB, Navy, Air Force, MIT, and University of Chicago form a Joint Numerical Prediction Unit at Suitland, using an IBM 701. First radar designed for meteorological use, AN/CPS-9 is unveiled by USAF.
1955 Scheduled operational computer forecasts begin by the Joint Numerical Forecast Unit. USWB becomes a pioneer in civilian user of computers along with Census Bureau. Development of Barotropic Model begins.
1957 USWB accepts Dr. James Brantly's proposal of Cornell Aeronautical Laboratories to modify surplus Navy Doppler radars for severe storm observation. First endeavor to use Doppler radar in meteorology.
1958 NMC is established.
1959 Feasibility of a weather satellite is demonstrated. First WSR-57 weather radar is installed at Miami Hurricane Forecast Center.
1960 World's first weather satellite, TIROS I, launched. First advisories on air pollution issued.
1961 National Severe Storms Forecast Center established in Kansas City. First official forecast of clear air turbulence issued.
1963 TIROS III launched with automatic picture transmission (APT) capability, eventually provides images to over 100 nations.
1964 National Severe Storms Laboratory established.
1965 ESSA created.
1966 NMC Introduces computer model capable of making sea-level predictions as accurate as those made manually.
1967 Fire weather forecasts extended to cover contiguous U. S.
1970 ESSA becomes NOAA.
1973 National Weather Service purchases its second generation radar (WSR-74).
1975 First Geostationary Operational Environmental Satellite (GOES) launched, for hurricane detection.
1976 Real-time operational forecasts and warnings using Doppler radar are evaluated by the Joint Doppler Operational Radar Project (JDOP), spawning third generation weather radar (WSR-88D).
1977 Success of weather satellites causes elimination of last U.S. weather observation ships. National centers have real-time access to satellite data.
1979 Nested Grid Model (NGM) becomes operational. Global Data Assimilation System (GDAS) developed Automation of Field Operations and Services (AFOS) computer system deployed. System is the most ambitious computer network system yet created, setting records of volume of data and entry points while supporting word processing and other capabilities.
1980 Weather satellites spot eruption of Mt. St. Helens, beginning a trend of increasing usage for volcanic eruption detection. Mr. Edward Stoll, cooperative observer since 1905 honored at the Whitehouse.
1984 First official Air Transportable Mobile Unit ((ATMU) a remote observing and forecasting unit)) dispatched to the Shasta-Trinity National Forest wildfire. Removal of teletypewriters begins.
1989 Eight year national plan for modernization of the NWS is announced.
1990 Cray Y-MP8 supercomputer installed at NMC. Contract option exercised with UNISYS for full-scale production of 165 WSR-88D radars and 300 display subsystems, installation begins immediately. Automatic Surface Observing System (ASOS) development and planning nears completion.
1991 ASOS contract awarded to AAI Corporation.
1992 First 10 Limited-Production WSR-88D/s are fully installed. Advanced Weather Information Processing System (AWIPS) Development Phase contract awarded to Planning Research Corporation (PRC). AWIPS is a UNIX-based communication and workstation replacement for AFOS.
1993 Two to three WSR-88D/s are installed per month as production ramps up. Practically each installation with a new or refurbished NWS office.
(Courtesy of National Oceanic and Atmospheric Administration (NOAA).)
Federal Aviation Administration (FAA) and the Department of Defense, which results in economies of scale and a reduction in purchase costs. Recently purchased geostationary meteorological satellites, newer radars, and automated surface observing systems provide data that are shared by all participating agencies.
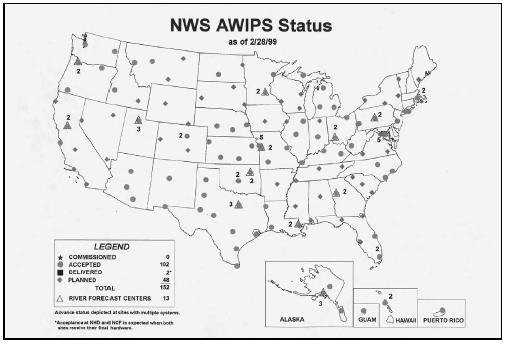
Automated Surface Observing Systems
Automated Surface Observing Systems (ASOSs) relieve staff personnel from the time-consuming duty of collecting surface observations manually. Nearly 850 ASOSs nationwide serve as the primary surface weather-observing network, significantly expanding the information available to forecasters and the aviation community. The system works non-stop, updating observations every minute, every day.
Getting up-to-the-minute data to forecasters is crucial. This type of information will increase the accuracy and timeliness of forecasts and warnings. This same data will also address and alleviate the safety concerns of the aviation community.
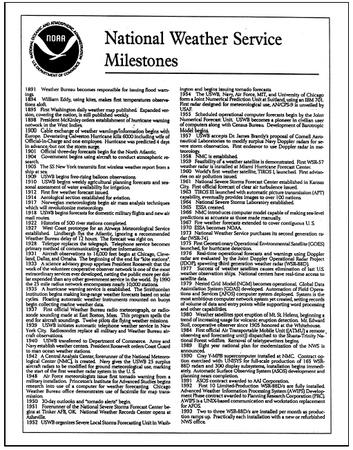
Next Generation Weather Radars
Next Generation Weather Radar (NEXRAD) is a large step forward in early warnings of tornado and severe thunderstorms. Utilizing Doppler radar technology, the NEXRAD system (also known as the Weather Surveillance Radar [WSR-88D]) observes the presence and calculates the speed and direction of motion of severe weather elements. The nearly 161 NEXRAD radars also provide quantitative area precipitation measurements so important in hydrologic forecasting of potential flooding. For example, at present, currently limited (obsolescent) radar systems and tornado warnings are usually issued only when sightings have been reported. The advent of NEXRAD will not only allow for an earlier detection of the precursors to tornadic activity, but will also provide data on the direction and speed of tornado cells once they form.
The national network of NEXRAD systems, when fully deployed, will sharply upgrade uniform coverage way beyond the capability of present-day radar network. The NWS will operate the majority of NEXRAD systems; the remainder will be at FAA and Department of Defense locations.
NOAA'S GEOSTATIONARY AND POLARORBITING WEATHER SATELLITES
Operating the country's system of environmental (weather) satellites is one of the major responsibilities of the National Oceanic and Atmospheric Administration's (NOAA's) National Environmental Satellite, Data, and Information Service (NESDIS). NESDIS operates the satellites and manages the processing and distribution of the millions of bits of data and images these satellites produce daily. The primary customer is NOAA's National Weather Service, which uses satellite data to create forecasts for the
public, television, radio, and weather advisory services. Satellite information is also shared with various Federal agencies, such as the Departments of Agriculture, Interior, Defense, and Transportation; with other countries, such as Japan, India, and Russia, and members of the European Space Agency (ESA) and the United Kingdom Meteorological Office; and with the private sector.
NOAA's operational weather satellite system is composed of two types of satellites: geostationary operational environmental satellites (GOES) for short-range warning and "now-casting," and polar-orbiting satellites for longer-term forecasting. Both types of satellite are necessary for providing a complete global weather monitoring system.
A new series of GOES and polar-orbiting satellites has been developed for NOAA by the National Aeronautics and Space Administration (NASA). The new GOES-I through M series provide higher spatial and temporal resolution images and full-time operational soundings (vertical temperature and moisture profiles of the atmosphere). The newest polarorbiting meteorological satellites (that began with NOAA-K in 1998) provide improved atmospheric temperature and moisture data in all weather situations. This new technology will help provide the National Weather Service with the most advanced weather forecast system in the world.
Geostationary Operational Environmental Satellites (GOES)
GOES satellites provide the kind of continuous monitoring necessary for intensive data analysis. They circle the Earth in a geosynchronous orbit, which means they orbit the equatorial plane of the Earth at a speed matching the Earth's rotation. This allows them to hover continuously over one position on the surface. The geosynchronous plane is about 22,300 miles above the Earth, high enough to allow the satellites a full-disc view of the Earth. Because they stay above a fixed spot on the surface, they provide a constant vigil for the atmospheric "triggers" for severe weather conditions such as tornadoes, flash floods, hail storms, and hurricanes. When these conditions develop the GOES satellites are able to monitor storm development and track their movements. GOES satellite imagery is also used to estimate rainfall during the thunderstorms and hurricanes (for flash flood warnings), as well as to estimate snowfall accumulations and the overall extent of snow cover. Such data help meteorologists issue winter storm warnings and spring snow melt advisories. Satellite sensors also detect ice fields and map the movements of sea and lake ice.
NASA launched the first GOES for NOAA in 1975 and followed it with another in 1977. Currently, the United States is operating GOES-8 and GOES-10. (GOES-9, which malfunctioned in 1998, is being stored in orbit as an emergency backup should either GOES-8 or GOES-10 fail.) GOES-11 was launched on May 3, 2000 and GOES-12 on July 23, 2001. Both are being stored in orbit as fully functioning replacements for GOES-8 or GOES-10 (should they fail).
GOES-8 and GOES-10
The United States normally operates two meteorological satellites in geostationary orbit over the equator. Each satellite views almost a third of the Earth's surface: one monitors North and South America and most of the Atlantic Ocean, the other North America and the Pacific Ocean basin. GOES-8 (or GOES-East) is positioned at 75° W longitude and the equator, while GOES-10 (or GOES-West) is positioned at 135° W longitude and the equator. The two operate together to produce a full-face picture of the Earth, day and night. Coverage extends approximately from 20° W longitude to 165° E longitude.
The main mission is carried out by the primary instruments, the Imager and the Sounder. The imager is a multi-channel instrument that senses radiant energy and reflected solar energy from the Earth's surface and atmosphere. The Sounder provides data to determine the vertical temperature and moisture profile of the atmosphere, surface and cloud top temperatures, and ozone distribution.
Other instruments on board the spacecraft are a Search- and-Rescue transponder, a data collection and relay system for ground-based data platforms, and a space environment monitor. The latter consists of a magnetometer, an X-ray sensor, a high energy proton and alpha detector, and an energetic particles sensor. All are used for monitoring the near-Earth space environment or solar "weather".
The United States reaps many benefits from the new series of GOES satellites as they aid forecasters in providing better advanced warnings of thunderstorms, flash floods, hurricanes, and other severe weather. The GOES-I series provides meteorologists and hydrologists with detailed weather measurements, more frequent imagery, and new types of atmospheric soundings. The data gathered by the GOES satellites, combined with that from new Doppler radars and sophisticated communications systems, make for improved forecasts and weather warnings that save lives, protect property, and benefit agricultural and a variety of commercial interests.
For users who establish their own direct readout receiving station, the GOES satellites transmit low-resolution imagery in the WEFAX service. WEFAX can be received with an inexpensive receiver. Highest resolution Imager and Sounder data is found in the GVAR primary data user service, which requires more complex receiving equipment.
Polar-Orbiting Satellites
Complementing the geostationary satellites are two polarorbiting satellites known as Advanced Television Infrared Observation Satellite (TIROS-N or ATN), constantly circling the Earth in an almost north-south orbit, passing close to both poles. The orbits are circular, with an altitude between 830 (morning orbit) and 870 (afternoon orbit) km, and are sun synchronous. One satellite crosses the equator at 7:30 a.m. local time, the other at 1:40 p.m. local time. The circular orbit permits uniform data acquisition by the satellite and efficient control of the satellite by the NOAA Command and Data Acquisition (CDA) stations located near Fairbanks, Alaska, and Wallops Island, Virginia. Operating as a pair, these satellites ensure that data for any region of the Earth are no more than six hours old.
A suite of instruments is able to measure many parameters of the Earth's atmosphere, its surface, cloud cover, incoming solar protons, positive ions, electron-flux density, and the energy spectrum at the satellite altitude. As a part of the mission, the satellites can receive, process, and retransmit data from Search-and-Rescue beacon transmitters and automatic data collection platforms on land, ocean buoys, or aboard free-floating balloons. The primary instrument aboard the satellite is the Advanced Very High Resolution Radiometer or AVHRR.
Data from all the satellite sensors is transmitted to the ground via a broadcast called the High Resolution Picture Transmission (HRPT). A second data transmission consists of only image data from two of the AVHRR channels, called Automatic Picture Transmission (APT). For users who want to establish their own direct readout receiving station, lowresolution imagery data in the APT service can be received with inexpensive equipment, while the highest resolution data transmitted in the HRPT service utilizes a more complex receiver.
The polar orbiters are able to monitor the entire Earth, tracking atmospheric variables and providing atmospheric data and cloud images. They track weather conditions that eventually affect the weather and climate of the United States. The satellites provide visible and infrared radiometer data that are used for imaging purposes, radiation measurements, and temperature profiles. The polar orbiters ultraviolet sensors also provide ozone levels in the atmosphere and are able to detect the "ozone hole" over Antarctica during mid-September to mid-November. These satellites send more than 16,000 global measurements daily via NOAA's CDA station to NOAA computers, adding valuable information for forecasting models, especially for remote ocean areas where conventional data are lacking.
Currently, NOAA is operating five polar orbiters: NOAA-14 (classified as a stand-by satellite), launched in December 1994, and a new series of polar orbiters with improved sensors, which began with the launch of NOAA-15 in May 1998 and NOAA-16 on September 21, 2000. The newest, NOAA-17, was launched June 24, 2002. NOAA-12 continues transmitting HRPT data as a stand-by satellite. NOAA-15 and NOAA-16 are classified as the "operational" satellites.
How satellites are named
NOAA assigns a letter to the satellite before it is launched, and a number once it has achieved orbit. For example, GOES-H, once in orbit, was designated GOES-7, GOES-G, which was lost at launch, was never assigned a number. The same system is used for polar orbiters; for example, NOAA-11, still in orbit, was designated NOAA-H before launch. NOAA-J became NOAA-14.
Upgrading satellites
For severe weather and flood warnings and short-range forecasts, cloud imagery and atmospheric sounding data from the geostationary meteorological satellites will continue to be a major data source. The new Geostationary Operational Environmental Satellite (GOES) I–M system includes separate instrumentation that allows simultaneous image and sounding data to be observed and transmitted to ground stations. The GOES I–M system also provides visible and infrared imagery data updates as frequently as every six minutes during severe weather warning situations over selected areas of the United States. To date, three of the program's five scheduled satellites orbit the earth, covering the United States' east and west coasts.
For longer-range forecasting, soundings from the polar orbiting satellites are a primary data input into the National Meteorological Center (NMC) numerical forecast models.
171 PEOPLE WERE RESCUED IN THE U.S. IN 2002 WITH HELP FROM NOAA SATELLITES
Thanks to environmental satellites with search-and-rescue tracking capability, the Commerce Department's National Oceanic and Atmospheric Administration (NOAA) helped save 171 lives in the United States in 2002.
The NOAA satellites, along with Russia's Cospas satellites, are part of an international Search-and-Rescue Satellite–Aided Tracking System known as Cospas-Sarsat. Together the systems use a constellation of satellites in geostationary and polar orbits to detect and locate emergency beacons on vessels and aircraft in distress and from hand-held Personal Locator Beacons (PLBs). India and the European Space Agency also provide geostationary satellites for the Cospas-Sarsat System.
Of the 171 rescues last year, 133 people were saved on the nation's coastal waters, 27 in the Alaskan wilderness, and 11 from downed aircraft in states around the country. Of the 69 separate Sarsat-rescue events, a variety took place out at sea.
Engine fires, flooding, and rough seas all caused emergencies resulting in distress calls and rescues. In Alaska, stranded snowmobilers and lost persons were among those rescued. Downed aircraft incidents included those making emergency landings. In one such incident, a Piper Supercub had flipped after landing near Glenallen, Alaska. Both the pilot and passenger were uninjured.
More than 15,000 lives have been saved worldwide since the system became operational in 1982, and nearly 4,500 lives have been saved in the United States alone. September 2002 marked the 20th anniversary of the first Sarsat rescue.
In one dramatic rescue, a father, his son, and their family dog were plucked from a life raft in the Gulf of Alaska about 90 miles south of Cordova, Alaska. They were in a dangerous predicament, their fishing vessel had struck an object and sustained uncontrollable flooding causing them to abandon their vessel. Yet, because there was an Emergency Position Indicating Radio Beacon, or EPIRB, on board (which was manually activated), a U.S. Coast Guard search-and-rescue helicopter was able to respond quickly once the alert information was received from the USMCC. On arrival the helicopter saw the situation unfolding and deployed a rescue swimmer to retrieve the three occupants and bring them to safety. This particular incident illustrates the importance of emergency beacon registration.
NOAA expects the number of worldwide rescues for 2002 will total about 1,500. The average number of distress alerts continues to rise internationally as more countries sign on to use the advantages and benefits of the Cospas-Sarsat system.
NOAA's Geostationary Operational Environmental Satellites (GOES) can instantly detect emergency distress signals. The polar-orbiting satellites in the system detect emergency signals as they circle the Earth from pole to pole. The signals are sent to the Mission Control Centers, then automatically sent to rescue forces around the world. There are 35 countries participating in the system as of 2002.
NOAA Satellites and Information is the nation's primary source of operational space-based meteorological and climate data. In addition to search and rescue, NOAA's environmental satellites are used for weather forecasting, climate monitoring, and other environmental applications such as volcanic eruptions, ozone monitoring, sea surface temperature measurements, and wild fire detection.
NOAA Satellites and Information also operates three data centers, which house global data bases in climatology, oceanography, solid-earth geophysics, marine geology and geophysics, solar-terrestrial physics, and paleoclimatology.
NOAA is dedicated to enhancing economic security and national safety through the prediction and research of weather and climate related events and providing environmental stewardship of our nation's coastal and marine resources.
National Center advanced computer systems
Warnings and forecasts prepared by NWS offices rely heavily on the basic analyses and advisories provided by the National Meteorological Center, especially for periods of 36 hours and beyond. These analyses and guidance products result from numerical models of the atmosphere run on high-speed computers. These increased demands require the acquisition of dedicated next-generation Class VII computer capabilities with a processing capability that is a full order of magnitude greater than the present Class VI computer.
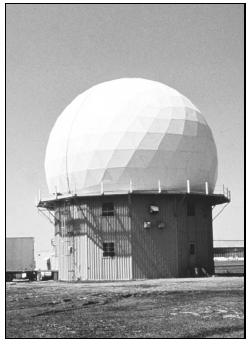
Advanced Weather Interactive Processing System
The revised system employed by the Advanced Weather Interactive Processing System (AWIPS) functions as the nerve center of the 118 National Meteorological Centers operations. AWIPS is the data integrator receiving the high-resolution data from the observation systems, the centrally collected data, and the centrally prepared analysis and guidance information developed by the National Meteorological Center. The integration of all of this data from multiple sources represents the information base from which all warning and forecast products will be prepared. The AWIPS system provides fast-response interactive analysis and display of the data to help support the meteorologists as they make rapid decisions, prepare warnings and forecasts, and disseminate information to users.
AWIPS includes the communications network that interconnects each Weather Forecast Office for exchange of locally generated data. NOAAPORT provides communications support for the operational distribution of the centrally collected data and centrally produced analysis and guidance products, as well as the satellite imagery and sounding data processed by the National Environmental Satellite, Data, and Information Service (NESDIS).
The continued restructuring involves changing the number and location of field offices, a gradual transformation of the workforce to emphasize more professionalism in its makeup, and a reallocation of operational responsibilities between field offices and the National Centers.
The need to restructure is twofold: first, the combination of new operational concepts, new data sets, and an evolving scientific understanding of the dynamic processes associated with the most dangerous weather phenomena requires an increase in the number of meteorologists. The percentage increase of meteorologists in the NWS workforce will improve warnings and forecasts by taking advantage of the capabilities of the new technologies. Second, productivity and efficiency gains will occur as a result of increased integration of the new technological observation, information processing, and communication systems with the staff. Key trade-offs in the restructuring process exist between human capabilities, costs, and programmatic, scientific, and technological opportunities.
The Weather Forecast Office
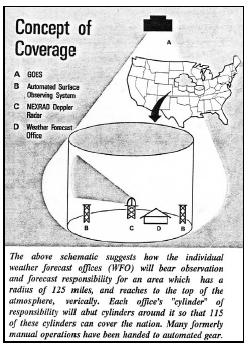
How does the new Weather Forecast Office (WFO) fit into the scheme? Consider this analogy: think of the surface of a map of the United States. Now, consider a uniform arrangement of 118 mutually adjacent cylinders, each with a radius of approximately 125 mi. The cylinders would each extend upward from the earth's surface. Each cylinder represents the "area" of operational responsibility associated with the WFO. A WFO is located in the center of the base of the cylinder. Each section of the country and the coastal ocean area is contained in one of these cylinders, thus the whole of the country is theoretically uniformly covered.
The Geostationary Operational Environmental Satellite (GOES) satellite positioned over the United States provides to each of these cylinders an Earth image. The regularly updated image represents uniform coverage with visible and infrared imagery of each of the "cylinders." It also provides remote soundings that penetrate each cylinder from above. Associated with each WFO is one or more NEXRAD radars that scan the atmosphere from near Earth's surface to a height sufficient to detect the majority of meteorological events.
Also serving the WFOs are 1,000 ASOS units. They are spread across the surface of the country and each measures surface weather parameters as fast as once every minute. All of these data within the cylinder are sent directly to the AWIPS system in each WFO. The WFO's AWIPS system also receives the centrally produced guidance products from the National Centers, generated from globally exchanged data. Subsets of these data are available for all other WFOs through the AWIPS communication network.
Integrated operations within the WFO
These operations allow forecasters to comprehensively address the air-sea environment in their assigned area. The
observation and analysis of current and expected weather conditions can be quickly and reliably completed, and critical decisions can be made and translated into immediate warnings and forecasts. This is contrasted to past operations where a number of meteorologists and technicians were required to individually evaluate a limited data base and separately derive the various warnings and forecasts.
The concept of the local data base is central to future operations. The high volume of data from the local NEXRAD and geostationary meteorological satellites combined with the high-frequency observations from ASOS will flow directly to the Weather Forecast Office. The most complete data sets will only be available to the local WFO. However, summarized data from all NEXRADs and ASOSs in the nation are made available to all field offices.
The new observing systems are designed to provide data sets which can be immediately integrated into three-dimensional depictions of the rapidly changing state of the environment. Each system will contribute a critical part, combining with and complementing data from all other systems to form a complete set of information about that particular cylinder of space from the earth's surface to the upper atmosphere comprising the particular WFO's area of responsibility.
AWIPS work stations allow the forecaster to quickly update, quality control, and analyze current processes and events detailed within the area of concern. New dedicated supercomputer capabilities and high-resolution models running at the National Centers provide a stream of detailed, frequently updated guidance to forecasters, assisting in the prediction of future conditions. This represents a new, highly integrated mode of operation which greatly increases the productivity of personnel, and also holds the promise of increased accuracy and greater timeliness of forecast services for the nation.
The new structure
The WFO is the weather office that will provide all warning and forecast services for its assigned area of responsibility. The forecast and warnings operations at the WFO are supported by guidance products issued from the National Centers and River Forecast Center (RFC).
Weather Forecast Offices (WFOs)
A total of 118 WFOs provide weather and hydrologic services in four major areas: (1) Watches and warnings for the general public for severe local storms; floods, flash floods and winter storms; local and zone public forecasts;
and fire weather forecasts; (2) local aviation watches and warnings, terminal forecasts, and domestic aviation enroute forecasts; (3) marine warnings and forecasts for coastal areas of the nation and the Great Lakes; and (4) hydrologic services that identify flash-flood-prone areas and the development of community supported surveillance systems.
The foundation for the more accurate and timely warnings and forecasts will be the guidance products from the National Centers and RFCs and the data from the new observing systems: ASOS, NEXRAD, and geostationary meteorological satellites.
The basic tool for more accurate and timely warnings and forecasts from the WFO is AWIPS. It assembles, processes, and displays the observational data and guidance from National Centers. AWIPS helps meteorologists with the warning and forecast decision process through an interactive workstation. It pre-formats warnings and forecast products and disseminates these products to the users in a timely manner.
River Forecast Center
River Forecast Centers (RFCs) provide hydrologic forecasts and guidance information in three major categories: (1) mainstem river and flood forecasts regarding about 3,000 locations; (2) flash-flood and headwater guidance to WFOs for warning services; and (3) long-term, seasonal forecasts providing estimates of snowmelt and water supply outlooks (from excess to drought) at approximately 1,000 locations for periods up to several months in advance.
The operations of RFCs are expected to change in several ways. Each of the 13 RFCs will be colocated with a WFO. This will result in a more effective utilization of hydrological and meteorological information facilitated by a Hydrologic Analysis and Support Group in each colocated facility.
National Meteorological Center
The National Meteorological Center (NMC) has the responsibility for national and international data collection. This database is first employed for global atmospheric and oceanic analysis. The resultant analyses are distributed to international and domestic users that include the NWS, other government agencies, and private sector meteorologists. The database is then used as initial input to global atmospheric numerical models. These models produce international aviation forecast products, high-seas forecast products, long-range national forecasts, and forecast guidance
for local WFOs and RFCs. New dedicated Class VII computer capabilities will enable increases in the resolution of the models, resulting in improved forecast products and guidance. Traditionally, the long-range national forecasts have begun at three days and beyond. The new computers will reduce this threshold to beyond 36 hours. This will allow local forecasters to devote their attention to short-term weather events that are not aided by the use of centralized computer models.
Climate Analysis Center
This center is a specialized facility that is part of the National Meteorological Center and is colocated with it to take advantage of the facilities available there. The center's responsibilities are national and international in scope—collecting, organizing, and disseminating climate information for diagnosis of short-term climate change; researching the physical cause of short-term climate change; and issuing forecasts of departures of average weather conditions from climatological means.
National Hurricane Center (Tropical Prediction Center)
This special facility will continue to be responsible for providing the nation with its strongest measure of security from tropical storms. It analyzes, predicts, and tracks tropical weather systems that often become hurricanes. The center provides leadership and coordination of storm-related preparedness. It uses geostationary meteorological satellites to track and monitor tropical storms 24 hours a day throughout the cycle of a storm. It will utilize coastal NEXRADs radar systems, which are becoming available to provide hurricane understanding well beyond that available at present. NMC's new Class VII computers will run new hurricane models which will greatly assist forecasters at the Hurricane Center. AWIPS at the National Hurricane Center will serve the center's mission as well as NMC's.
National Storm Prediction Center
The National Storm Prediction Center provides national severe weather guidance to WFOs and RFCs. It issues more timely and specific advisories necessary to support the severe weather and flood-warning activities of the WFOs.
National Data Buoy Center
The National Data Buoy Center will continue the operation of deep-sea, coastal buoys, and headland systems. Data from the buoys and these coastal systems are essential to marine warnings and forecasts, and numerical weather predictions.
Staffing
The new observing, data processing, and display systems provide forecasters with the opportunity to sample, observe, and analyze the environment to an extent never before possible. This means a better product, more efficiently produced. Field offices have a core staff of professional scientists at each WFO and RFC to take advantage of these new capabilities. These individuals will provide all warning and forecast services across their area of responsibility. They will have far better data with which to meet these tasks.
Taking a quantum leap such as this—improving product while using fewer people—places greater emphasis on a higher level of professional skills and on retraining many technicians. NWS has strategic, as well as tactical programs, to effect the implied transmutation.
For instance, each WFO operates 24 hours a day, and a certified meteorologist will be in charge at all times. Other such staffing upgrades will occur. The staffing level is determined by peak service demands and maximum weather activity, with reduced staff requirements at selected offices during hours of lower threat and service demands.
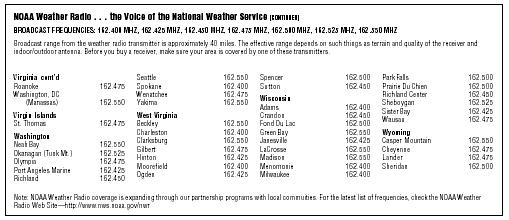
NOAA WEATHER RADIO
The NOAA provides the service known as Weather Radio . This service provides continuous broadcasts of the latest weather information directly from National Weather Service
offices. Taped weather messages are repeated every four to six minutes and are routinely revised every one to three hours, or more frequently if needed. Most of the stations operate 24 hours daily.
The broadcasts are tailored to weather information needs of people within the receiving area. For example, stations along the seacoasts and Great Lakes provide specialized weather information for boaters, fishers, and others engaged in marine activities, as well as general weather information.
During severe weather, National Weather Service forecasters can interrupt the routine weather broadcasts and substitute special warning messages. The forecasters can also activate specially designed warning receivers. Such receivers either sound an alarm indicating that an emergency exists, alerting the listener to turn the receiver up to an audible volume; or, when operated in a muted mode, are automatically turned on so that the warning message is heard. "Warning alarm" receivers are especially valuable for schools, hospitals, public-safety agencies, and news media offices.
Under a January, 1975, White House policy statement, NOAA Weather Radio was designated the sole government-operated radio system to provide direct warnings into private homes for both natural disasters and nuclear attack. This capability is to supplement warnings by sirens and by commercial radio and television.
NOAA Weather Radio broadcasts are made on highband FM frequencies. The 162.475 MHz frequency is used only in special cases where required to avoid channel interference. These frequencies are not found on the average home radio now in use. However, a number of radios manufacturers offer special weather radios to operate on these frequencies, with or without the emergency warning alarm. There are also many radios on the market that offer standard AM/FM frequencies plus the so-called "weather band" as an added feature.
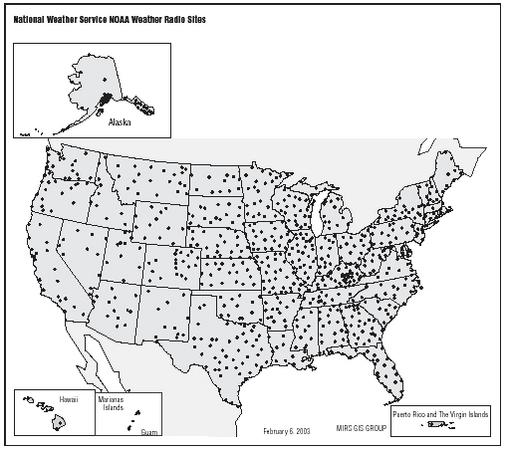
NOAA Weather Radio broadcasts can usually be heard as far as 40 mi from the antenna site, sometimes more. The effective range depends on many factors, particularly the height of the broadcasting antenna, terrain, quality of the receiver, and type of receiving antenna. As a general rule, listeners close to or perhaps beyond the 40-mi range should have a good quality receiver system if they expect reliable reception.
Marine weather
Few people are affected more by weather than the mariner. An unexpected change in winds, seas, or visibility can reduce the efficiency of marine operations and threaten
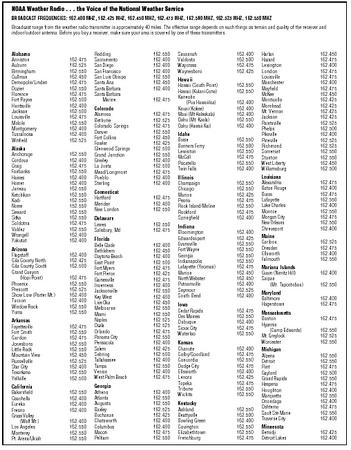
| NOAA Weather Radio . . . the Voice of the National Weather Service | |||||||||
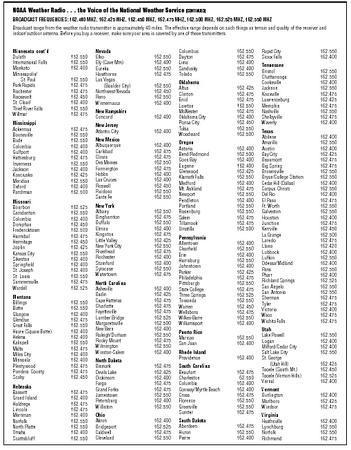
| BROADCAST FREQUENCIES: 162.400 MHZ, 162.425 MHZ, 162.450 MHZ, 162.475 MHZ, 162.500 MHZ, 162.525 MHZ, 162.550 MHZ | |||||||||
| Broadcast range from the weather radio transmitter is approximately 40 miles. The effective range depends on such things as terrain and quality of the receiver and indoor/outdoor antenna. Before you buy a receiver, make sure your area is covered by one of these transmitters. | |||||||||
| Alabama | Redding | 162.550 | Savannah | 162.400 | Harlan | 162.450 | |||
| Anniston | 162.475 | Sacramento | 162.400 | Valdosta | 162.500 | Hazard | 162.475 | ||
| Auburn | 162.525 | San Diego | 162.400 | Waycross | 162.475 | Lexington | 162.400 | ||
| Birmingham | 162.550 | San Francisco | 162.400 | Waynesboro | 162.425 | London | 162.475 | ||
| Cullman | 162.450 | San Luis Obispo | 162.550 | Hawaii | Louisville | 162.475 | |||
| Demopolis/Linden | 162.475 | Santa Ana | 162.450 | Hawaii (South Point) | 162.550 | Manchester | 162.400 | ||
| Dozier | 162.550 | Santa Barbara | 162.400 | Hawaii (Kulani Cone) | 162.550 | Mayfield | 162.475 | ||
| Florence | 162.475 | Santa Barbara | Kaneohe | McKee | 162.450 | ||||
| Fort Payne | 162.500 | Marine | 162.475 | (Puu Hawaiiloa) | 162.400 | Monticello | 162.425 | ||
| Huntsville | 162.400 | Colorado | Kauai (Kokee) | 162.400 | Morehead | 162.425 | |||
| Jackson | 162.500 | Alamosa | 162.475 | Maui (Mt Haleakala) | 162.400 | Mt. Vernon | 162.425 | ||
| Louisville | 162.475 | Bethune | 162.525 | Oahu (Mt. Kaala) | 162.550 | Jackson | 162.425 | ||
| Mobile | 162.550 | Colorado Springs | 162.475 | Oahu (Hawaii Kai) | 162.400 | Paintsville | 162.525 | ||
| Montgomery | 162.400 | Phelps | 162.500 | ||||||
| Tuscaloosa | 162.400 | Denver | 162.550 | Idaho | Pikeville | 162.400 | |||
| Winfield | 162.525 | Fort Collins | 162.450 | Boise | 162.550 | Pineville | 162.525 | ||
| Fowler | 162.425 | Bonners Ferry | 162.500 | Richmond | 162.525 | ||||
| Alaska | Glenwood Springs | 162.500 | Lewiston | 162.550 | Somerset | 162.550 | |||
| Anchorage | 162.550 | Grand Junction | 162.550 | McCall | 162.475 | Stanton | 162.550 | ||
| Cordova | 162.400 | Greeley | 162.400 | Pocatello | 162.550 | West Liberty | 162.450 | ||
| Craig | 162.475 | La Junta | 162.500 | Twin Falls | 162.400 | Williamsburg | 162.500 | ||
| Fairbanks | 162.550 | Mead/Longmont | 162.475 | ||||||
| Haines | 162.400 | Pueblo | 162.400 | Illinois | Louisiana | ||||
| Homer | 162.400 | Sterling | 162.400 | Champaign | 162.550 | Alexandria | 162.475 | ||
| Juneau | 162.550 | Chicago | 162.550 | Baton Rouge | 162.400 | ||||
| Ketchikan | 162.550 | Connecticut | Marion | 162.425 | Buras | 162.475 | |||
| Kodi | 162.550 | Hartford | 162.475 | Peoria | 162.475 | Lafayette | 162.550 | ||
| Nome | 152.550 | Meriden | 162.400 | Rock Island/Moline | 162.550 | Lake Charles | 162.400 | ||
| Seward | 162.550 | New London | 162.550 | Rockford | 162.475 | Monroe | 162.550 | ||
| Sitka | 162.550 | Delaware | Springfield | 162.400 | Morgan City | 162.475 | |||
| Soldotna | 162.475 | Lewes | 162.550 | Indiana | New Orleans | 162.550 | |||
| Valdez | 162.550 | Salisbury, Md | 162.475 | Bloomington | 162.400 | Shreveport | 162.400 | ||
| Wrangell | 162.400 | Edwardssport | 162.425 | Maine | |||||
| Yakutat | 162.400 | Florida | Evansville | 162.550 | Caribou | 162.525 | |||
| Belle Glade | 162.400 | Dresden | 162.475 | ||||||
| Arizona | Flagstaff | 162.400 | Bethlehem | 162.450 | Fort Wayne | 162.550 | Ellsworth | 162.400 | |
| Gila County North | 162.425 | Daytona Beach | 162.400 | Georgia | 162.550 | Falmouth | 162.550 | ||
| East Point | 162.500 | Indianapolis | 162.550 | ||||||
| Gila County South | 162.500 | Fort Myers | 162.475 | Lafayette (Yeoman) | 162.475 | Mariana Islands | |||
| Grand Canyon | Fort Pierce | 162.425 | Marion | 162.450 | Guam (Nimitz Hill) | 162.400 | |||
| (Hopi Point) | 162.475 | Gainesville | 162.475 | North Webster | 162.450 | Saipan | |||
| Phoenix | 162.550 | Inverness | 162.400 | Putnamville | 162.400 | (Mt. Tapoctobau) | 162.550 | ||
| Prescott | 162.525 | Jacksonville | 162.550 | Seymour | 162.525 | Maryland | |||
| Show Low (Porter Mt.) | 162.400 | Key West | 162.400 | South Bend | 162.400 | Baltimore | 162.400 | ||
| Tucson | 162.400 | Live Oka | 162.450 | Iowa | Hagerstown | 162.475 | |||
| Window Rock | 162.550 | Melbourne | 162.550 | Cedar Rapids | 162.475 | Massachusetts | |||
| Yuma | 162.550 | Miami | 162.550 | ||||||
| Arkansas | Naples | 162.525 | Des Moines | 162.550 | Boston | 162.475 | |||
| Fayetteville | 162.475 | Ocala | 162.525 | Dubuque | 162.400 | Hyannis | |||
| Fort Smith | 162.550 | Orlando | 162.475 | Sioux City | 162.475 | (Camp Edwards) | 162.550 | ||
| Gurdon | 162.475 | Panama City | 162.550 | Waterloo | 162.550 | Mt. Greylock | 162.525 | ||
| Jonesboro | 162.550 | Pensacola | 162.400 | Kansas | Worcester | 162.550 | |||
| Little Rock | 162.550 | Salem | 162.425 | Chanute | 162.400 | Michigan | |||
| Mountain View | 162.450 | Sebring | 162.500 | Colby/Goodland | 162.475 | Alpena | 162.550 | ||
| Russellville | 162.525 | Tallahassee | 162.400 | Concordia | 162.550 | Detroit | 162.550 | ||
| Star City | 162.400 | Tampa | 162.550 | Dodge City | 162.475 | Flint | 162.475 | ||
| Texarkana | 162.550 | Venice | 162.400 | Ellsworth | 162.400 | Gaylord | 162.500 | ||
| Yellville | 162.500 | West Palm Beach | 162.475 | Lenora | 162.425 | Grand Rapids | 162.550 | ||
| Topeka | 162.475 | Hesperia | 162.475 | ||||||
| California | Georgia | Tribune | 162.550 | Houghton | 162.400 | ||||
| Bakersfield | 162.550 | Athens | 162.400 | Wichita | 162.550 | Marquette | 162.550 | ||
| Coachella | 162.400 | Atlanta | 162.550 | ||||||
| Eureka | 162.400 | Augusta | 162.550 | Kentucky | Onondaga | 162.400 | |||
| Fresno | 162.400 | Baxley | 162.525 | Ashland | 162.550 | Oshtemo | 162.475 | ||
| Grass Valley | Buchanan | 162.425 | Beattyville | 162.500 | Sault Ste Marie | 162.550 | |||
| (Wolf Mt.) | 162.400 | Chatsworth | 162.400 | Bowling Green | 162.400 | Traverse City | 162.400 | ||
| Los Angeles | 162.550 | Columbus | 162.400 | Covington | 162.550 | Minnesota | |||
| Monterey | 162.550 | Macon | 162.475 | Elizabethtown | 162.550 | Bemidji | 162.425 | ||
| Pt. Arena/Ukiah | 162.550 | Pelham | 162.550 | Frenchburg | 162.475 | Detroit Lakes | 162.400 | ||
| NOAA Weather Radio . . . the Voice of the National Weather Service [CONTINUED] | |||||||
| BROADCAST FREQUENCIES: 162.400 MHZ, 162.425 MHZ, 162.450 MHZ, 162.475 MHZ, 162.500 MHZ, 162.525 MHZ, 162.550 MHZ | |||||||
| Broadcast range from the weather radio transmitter is approximately 40 miles. The effective range depends on such things as terrain and quality of the receiver and indoor/outdoor antenna. Before you buy a receiver, make sure your area is covered by one of these transmitters. | |||||||
| Minnesota cont'd | Nevada | Columbus | 162.550 | Rapid City | 162.550 | ||
| Duluth | 152.550 | Elko | 162.550 | Dayton | 162.475 | Sioux Falls | 162.400 |
| International Falls | 162.550 | Ely (Cave Mtn) | 162.400 | Lima | 162.400 | Tennessee | |
| Mankato | 162.400 | Eureka | 162.550 | Sandusky | 162.400 | Bristol | 162.550 |
| Minneapolis/ | Hawthorne | 162.475 | Toledo | 162.550 | Chattanooga | 162.550 | |
| St. Paul | 162.550 | Las Vegas | Oklahoma | Cookeville | 162.400 | ||
| Park Rapids | 162.475 | (Boulder City) | 162.550 | Altus | 162.425 | Jackson | 162.550 |
| Rochester | 162.475 | Northwest Nevada | 162.450 | Clinton | 162.475 | Knoxville | 162.475 |
| Roosevelt | 162.450 | Reno | 162.550 | Enid | 162.475 | Lawrenceburg | 162.425 |
| St. Cloud | 162.400 | Winnemucca | 162.400 | Lawton | 162.550 | Memphis | 162.475 |
| Thief River Falls | 162.550 | New Hampshire | McAlester | 162.475 | Nashville | 162.550 | |
| Willmar | 162.475 | Concord | 162.400 | Oklahoma City | 162.400 | Shelbyville | 162.475 |
| Mississippi | New Jersey | Ponca City | 162.450 | Waverly | 162.400 | ||
| Ackerman | 162.475 | Atlantic City | 162.400 | Tulsa | 162.550 | Texas | |
| Booneville | 162.550 | Woodward | 162.500 | Abilene | 162.400 | ||
| Bude | 162.550 | New Mexico | Oregon | Amarillo | 162.550 | ||
| Columbia | 162.400 | Albuquerque | 162.400 | Astoria | 162.400 | Austin | 162.400 |
| Gulfport | 162.400 | Carlsbad | 162.475 | Bend/Redmond | 162.500 | Bay City | 162.425 |
| Hattiesburg | 162.475 | Clovis | 162.475 | Coos Bay | 162.400 | Beaumont | 162.475 |
| Inverness | 162.550 | Des Moines | 162.550 | Eugene | 162.400 | Big Spring | 162.475 |
| Jackson | 162.400 | Farmington | 162.475 | Glenwood | 162.425 | Brownsville | 162.550 |
| Kosciusko | 162.425 | Hobbs | 162.400 | Klamath Falls | 162.550 | Bryan/College Station | 162.550 |
| Meridian | 162.550 | Las Cruces | 162.400 | Medford | 162.400 | Cedar Hill (Dallas) | 162.400 |
| Oxford | 162.400 | Roswell | 162.450 | Mt. Ashland | 162.475 | Corpus Christi | 162.550 |
| Parchman | 162.500 | Ruidoso | 162.550 | Newport | 162.550 | Del Rio | 162.400 |
| Missouri | Sante Fe | 162.550 | Pendleton | 162.400 | El Paso | 162.475 | |
| Bourbon | 162.525 | New York | Portland | 162.550 | Ft. Worth | 162.550 | |
| Camdenton | 162.550 | Albany | 162.550 | Rosenburg | 162.550 | Galveston | 162.550 |
| Columbia | 162.400 | Binghamton | 162.475 | Salem | 162.475 | Houston | 162.400 |
| Doniphan | 162.450 | Buffalo | 162.550 | Tillamook | 162.475 | Junction | 162.475 |
| Fredericktown | 162.500 | Elmira | 162.400 | Umatilla | 162.500 | Kerrville | 162.450 |
| Hannibal | 162.475 | Kingston | 162.475 | Pennsylvania | La Grange | 162.500 | |
| Hermitage | 162.450 | Little Valley | 162.425 | Allentown | 162.400 | Laredo | 162.475 |
| Joplin | 162.425 | New York City | 162.550 | Clearfield | 162.550 | Llano | 162.420 |
| Kansas City | 162.550 | Riverhead | 162.475 | Erie | 162.400 | Lubbock | 162.400 |
| Sikeston | 162.400 | Rochester | 162.400 | Harrisburg | 162.550 | Lufkin | 162.550 |
| Springfield | 162.400 | Stamford | 162.400 | Johnstown | 162.400 | Odessa/Midland | 162.400 |
| St. Joseph | 162.400 | Syracuse | 162.550 | Parker | 162.425 | Paris | 162.550 |
| St. Louis | 162.550 | Watertown | 162.475 | Philadelphia | 162.475 | Pharr | 162.400 |
| Summersville | 162.475 | North Carolina | Pittsburgh | 162.550 | Richland Springs | 162.525 | |
| Wardell | 162.525 | Asheville | 162.400 | State College | 162.475 | San Angelo | 162.550 |
| San Antonio | 162.550 | ||||||
| Montana | Badin | 162.425 | Three Springs | 162.525 | Sherman | 162.475 | |
| Billings | 162.550 | Cape Hatteras | 162.475 | Towanda | 162.550 | Tyler | 162.475 |
| Butte | 162.550 | Charlotte | 162.475 | Warren | 162.450 | Victoria | 162.400 |
| Glasgow | 162.400 | Fayetteville | 162.475 | Wellsboro | 162.475 | Waco | 162.475 |
| Glendive | 162.475 | Lumber Bridge | 162.525 | Wilkes-Barre | 162.550 | Wichita Falls | 162.475 |
| Great Falls | 162.550 | Margaretsville | 162.500 | Williamsport | 162.400 | ||
| Havre (Squaw Butte) | 162.400 | New Bern | 162.400 | Puerto Rico | Utah | ||
| Helena | 162.400 | Raleigh/Durham | 162.550 | Maricao | 162.550 | Lake Powell | 162.550 |
| Kalispell | 162.550 | Rocky Mount | 162.475 | San Juan | 162.400 | Logan | 162.400 |
| Malta | 162.475 | Wilmington | 162.550 | Milford/Cedar City | 162.400 | ||
| Miles City | 162.400 | Winston-Salem | 162.400 | Rhode Island | Salt Lake City | 162.550 | |
| Missoula | 162.400 | North Dakota | Providence | 162.400 | St. George | ||
| Plentywood | 162.475 | Bismark | 162.475 | South Carolina | (Utah Hill) | 162.425 | |
| Pondera County | 162.475 | Devils Lake | 162.425 | Beaufort | 162.475 | Tooele (South Mt.) | 162.450 |
| Scoby | 162.450 | Dickinson | 162.400 | Charleston | 62.550 | Tooele (Vernon Hills) | 162.525 |
| Nebraska | Fargo | 162.475 | Columbia | 162.400 | Vernal | 162.400 | |
| Bassett | 162.475 | Grand Forks | 162.475 | Conway/Myrtle Beach | 162.400 | Vermont | |
| Grand Island | 162.400 | Jamestown | 162.550 | Cross | 162.475 | Burlington | 162.400 |
| Holdrege | 162.475 | Petersburg | 162.400 | Florence | 162.550 | Marlboro | 162.425 |
| Lincoln | 162.475 | Williston | 162.550 | Greenville | 162.550 | Windsor | 162.475 |
| Merriman | 162.400 | Ohio | Sumter | 162.475 | Virginia | ||
| Norfolk | 162.550 | Akron | 162.400 | South Dakota | Heathsville | 162.400 | |
| North Platte | 162.550 | Bridgeport | 162.525 | Aberdeen | 162.475 | Lynchburg | 162.550 |
| Omaha | 162.400 | Caldwell | 162.475 | Huron | 162.550 | Norfolk | 162.550 |
| Scottsbluff | 162.550 | Cleveland | 162.550 | Pierre | 162.400 | Richmond | 162.475 |
| NOAA Weather Radio . . . the Voice of the National Weather Service [CONTINUED] | |||||||
| BROADCAST FREQUENCIES: 162.400 MHZ, 162.425 MHZ, 162.450 MHZ, 162.475 MHZ, 162.500 MHZ, 162.525 MHZ, 162.550 MHZ | |||||||
| Broadcast range from the weather radio transmitter is approximately 40 miles. The effective range depends on such things as terrain and quality of the receiver and indoor/outdoor antenna. Before you buy a receiver, make sure your area is covered by one of these transmitters. | |||||||
| Note: NOAA Weather Radio coverage is expanding through our partnership programs with local commuities. For the latest list of frequencies, check the NOAA Weather Radio Web Site— http://www.nws.noaa.gov/nwr | |||||||
| Virginia cont'd | Seattle | 162.550 | Spencer | 162.500 | Park Falls | 162.500 | |
| Roanoke | 162.475 | Spokane | 162.400 | Sutton | 162.450 | Prairie Du Chien | 162.500 |
| Washington, DC | Wenatchee | 162.475 | Wisconsin | Richland Center | 162.450 | ||
| (Manassas) | 162.550 | Yakima | 162.550 | Adams | 162.400 | Sheboygan | 162.525 |
| Sister Bay | 162.425 | Wausau | 162.475 | ||||
| Virgin Islands | West Virginia | Crandon | 162.450 | ||||
| St. Thomas | 162.475 | Beckley | 162.550 | Fond Du Lac | 162.500 | Wyoming | |
| Washington | Charleston | 162.400 | Green Bay | 162.550 | Casper Mountain | 162.550 | |
| Neah Bay | 162.550 | Clarksburg | 162.550 | Janesville | 162.425 | Cheyenne | 162.475 |
| Okanagan (Tunk Mt.) | 162.525 | Gilbert | 162.475 | LaCrosse | 162.550 | Lander | 162.475 |
| Olympia | 162.475 | Hinton | 162.425 | Madison | 162.550 | Sheridan | 162.500 |
| Port Angeles Marine | 162.425 | Moorefield | 162.400 | Menomonie | 162.400 | ||
| Richland | 162.450 | Ogden | 162.425 | Milwaukee | 162.400 | ||
the very safety of a vessel and its crew. The National Weather Service provides marine warnings and forecasts to serve all who sail for livelihood or recreation.
Aviation weather
Fewer than 15 years after the Wright brothers' historic flights of December 1903, the National Weather Service, then the Signal Corps' Weather Bureau, issued the first official aviation forecast—to help deliver the mail. Now, 80 years later, the agency issues thousands of aviation forecasts, advisories, and warnings to make flying safe and efficient.
On December 1, 1918, Weather Bureau forecasters combined ground observations with data collected by instrumented kites and tethered balloons to provide a forecast for the "Aerial Mail Service" route from New York to Chicago. The reporting network for that historic forecast consisted of 18 kite stations; six were operated by the Weather Bureau and the rest by the military.
Since 1918, the NWS has made quantum leaps in aviation weather forecasting. Geostationary and polar-orbiting satellites enable the organization to cover the globe in its entirety. State-of-the-art computers facilitate fast and accurate analysis of the incredible amounts of collected data to provide forecasts of developing weather phenomena.
Growing from that fledgling, single forecast for a handful of aircraft in 1918, forecasters at the Aviation Weather Center, NWS Weather Forecast Offices, and Center Weather Service Units working in Federal Aviation Administration Air Route Traffic Control Centers issue thousands of forecasts every day. With the improved services, the commercial and general aviation industries are able to save on fuel costs and select routes that avoid hazardous weather.
The Aviation Weather Center, one of nine units in the National Centers for Environmental Prediction, was formed in 1995. More that 40 meteorologists at the center work closely with aviation weather research centers, the FAA, and the U.S. Air Force. The AWC issues en route warnings and forecasts over the continental United States. At Weather Forecast Offices, terminal and route forecasts are issued and updated continuously throughout the day. Aviation meteorologists at the Center Weather Services Units provide forecasts and consultation to FAA traffic managers at the FAA Air Route Traffic Control Centers. NWS offices in Anchorage, Alaska; Honolulu, Hawaii; and Guam provide special aviation products for their respective areas.
Marine Advisories and Warnings
These advisories and warnings are "headlined" in marine forecasts. Small Craft Advisories can be issued up to 12 hours and warnings up to 24 hours prior to onset of adverse conditions.
Small Craft Advisory: Forecast winds of 18–33 knots. Small Craft Advisories may also be issued for hazardous sea conditions or lower wind speeds that may affect small craft operations.
Gale Warning: Forecast winds of 34–47 knots.
Storm Warning: Forecast winds of 48 knots or greater.
Tropical Storm Warning: Forecast winds of 34–63 knots associated with a tropical storm.
Hurricane Warning: Forecast winds of 64 knots or higher associated with a hurricane.
Data for pilots
The NWS, in cooperation with NOAA, also provides pilots with numerous weather briefings to prepare them for, or assist them with, their flights.
Meteorological and aeronautical information is provided by continuous recorded Transcribed Weather Broadcasts (TWEB), the Pilot's Automatic Telephone Weather Answering Service (PATWAS), and the Telephone Information Briefing Service (TIBS). Complete weather information is available by phoning or visiting the nearest FAA Flight Service Station (FSS) or designated NOAA Weather Service Office. Information is also available from private commercial vendors. During periods of marginal weather, briefers are busy and telephone delays may occur. Pilots may get necessary information from TWEB, PATWAS, or TIBS, but it is recommended pilots wait to hear a briefer's information personally. The latest hourly aviation weather observation from distant stations are normally available by five minutes past each hour.
After providing briefers with necessary background information, pilots will receive either a standard, abbreviated, or outlook briefing.
Standard briefings automatically provide pilots with data on adverse conditions, synopsis of prevailing weather systems, current conditions, winds aloft, etc., and any other information the pilot has requested.
Abbreviated briefings are requested when the pilot has used prerecorded or mass-media weather information to make a go/no-go decision and only selected additional information is required.
Outlook briefing is requested for a long-range flight plan.
Marine Beaufort Scale
The Beaufort Scale was originally developed in 1805 by Sir Francis Beaufort as a system for estimating wind strengths without the use of instruments. It is currently still in use for this same purpose as well as to tie together various components of weather (wind strength, sea state, observable effects) into a unified picture.
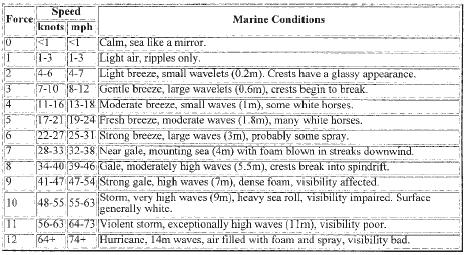
| Force | Speed | Marine Conditions | |
| knots | mph | ||
| 0 | <1 | <1 | Calm, sea like a mirror. |
| 1 | 1-3 | 1-3 | Light air, ripples only. |
| 2 | 4-6 | 4-7 | Light breeze, small wavelets (0.2m). Crests have a glassy appearance. |
| 3 | 7-10 | 8-12 | Gentle breeze, large wavelets (0.6m), crests begin to break. |
| 4 | 11-16 | 13-18 | Moderate breeze, small waves (1m), some white horses. |
| 5 | 17-21 | 19-24 | Fresh breeze, moderate waves (1.8m), many white horses. |
| 6 | 22-27 | 25-31 | Strong breeze, large waves (3m), probably some spray. |
| 7 | 28-33 | 32-38 | Near gale, mounting sea (4m) with foam blown in streaks downwind. |
| 8 | 34-40 | 39-46 | Gale, moderately high waves (5.5m), crests break into spindrift. |
| 9 | 41-47 | 47-54 | Strong gale, high waves (7m), dense foam, visibility affected. |
| 10 | 48-55 | 55-63 | Storm, very high waves (9m), heavy sea roll, visibility impaired. Surface generally white. |
| 11 | 56-63 | 64-73 | Violent storm, exceptionally high waves (11m), visibility poor. |
| 12 | 64+ | 74+ | Hurricane, 14m waves, air filled with foam and spray, visibility bad. |
(Courtesy of National Climatic Data Center/NOAA.)
Land Beaufort Scale
The Beaufort Scale was originally developed in 1805 by Sir Francis Beaufort as a system for estimating wind strengths without the use of instruments. It is currently still in use for this same purpose as well as to tie together various components of weather (wind strength, sea state, observable effects) into a unified picture.
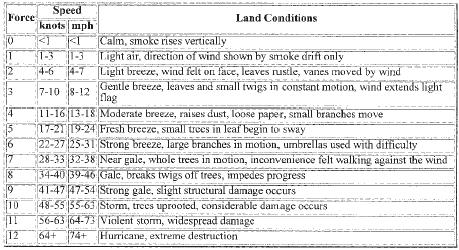
| Force | Speed | Land Conditions | |
| knots | mph | ||
| 0 | <1 | <1 | Calm, smoke rises vertically |
| 1 | 1-3 | 1-3 | Light air, direction of wind shown by smoke drift only |
| 2 | 4-6 | 4-7 | Light breeze, wind felt on face, leaves rustle, vanes moved by wind |
| 3 | 7-10 | 8-12 | Gentle breeze, leaves and small twigs in constant motion, wind extends light flag |
| 4 | 11-16 | 13-18 | Moderate breeze, raises dust, loose paper, small branches move |
| 5 | 17-21 | 19-24 | Fresh breeze, small trees in leaf begin to sway |
| 6 | 22-27 | 25-31 | Strong breeze, large branches in motion, umbrellas used with difficulty |
| 7 | 28-33 | 32-38 | Near gale, whole trees in motion, inconvenience felt walking against the wind |
| 8 | 34-40 | 39-46 | Gale, breaks twigs off trees, impedes progress |
| 9 | 41-47 | 47-54 | Strong gale, slight structural damage occurs |
| 10 | 48-55 | 55-63 | Storm, trees uprooted, considerable damage occurs |
| 11 | 56-63 | 64-73 | Violent storm, widespread damage |
| 12 | 64+ | 74+ | Hurricane, extreme destruction |
(Courtesy of National Climatic Data Center/NOAA.)
I need the values of world average daytime surface temperature for different longitude and latitude.
I am doing research in world renewable Energy Harvesting. please let me know where can I get more reliable source?
It will be helpful me to analize and predict energy Harvesting data.
Regards
-Blenson Paul
Technical University Dresden, Germany.
Organic & Molecular Electronics (OME) Department.
I wanted to let you know that you're offering a great service and I appreciate your business.