Weather & Climate of the Millennium
WEATHER, CLIMATE, AND PALEOCLIMATOLOGY
What is weather?
Weather is the state of atmospheric conditions (i.e., hot/cold, wet/dry, calm/windy, sunny/cloudy) that exists over relatively short periods of time (hours to a couple of days). Weather includes the passing of a thunderstorm, hurricane, or blizzard, and the persistence of a heat wave, or a cold snap. Weather variability and extreme events may be an unpredictable response to climate change.
What is climate?
Climate is the weather we expect over the period of a month, a season, a decade, or a century. More technically, climate is defined as the weather conditions resulting from the mean state of the atmosphere-ocean-land system, often described in terms of "climate normals" or average weather conditions. Climate change is a departure from the expected average weather or climate normals.
What is paleoclimatology?
Paleoclimatology is the study of past climate. The word is derived from the Greek root paleo- , which means "ancient," and the term "climate." Paleoclimate is that which existed before humans began collecting instrumental measurements of weather (e.g., temperature from a thermometer, precipitation from a rain gauge, sea level pressure from a barometer, wind speed and direction from an anemometer). Instead of instrumental measurements of weather and climate, paleoclimatologists use natural environmental (or "proxy") records to infer past climate conditions.
How do scientists study paleoclimatology?
Paleoclimatology not only includes the collection of evidence of past climate conditions, but the investigation of the climate processes underlying these conditions.
Paleoclimatologists, people who study past climate, can learn about past climate by looking at human records such as sailing logs and diaries. Paleoclimatologists also study the natural record, such as tree rings and the evidence of glacial advancement and retreat, to determine what past climate was like. Evidence of ancient mammals living before the last ice age also indicate climate change.
The environment, including the atmosphere and water conditions, is reflected in the chemical and physical make up of the remains of plants and animals. In this way, past climate is locked in nature. By comparing today's climate conditions with past climatic conditions scientists can get an idea of the rate at which conditions have changed. Earth's average global temperature has risen and fallen many times due to astronomical and other influences. Earth has periods of cold climate—ice ages—and periods of warm climate, called interglacial periods. There have been times when the average global temperature on Earth has been warmer than our present average global temperature, which is around 53.6–55.4°F. Knowing the pattern of past climate change can help us predict how climate will change in the future.
There are several ways that scientists study how Earth's temperature is changing: satellites, instrumental records, and proxy data.
Some scientists look to satellites to reveal something about Earth's changing climate. However, the satellite record is very short (ca. 20 years) and hard to interpret due to changes in instruments and orbits.
The record of instrumental temperature measurements, extending back to the nineteenth century, provides data from thermometers, rain gauges, etc., since 1860.
Paleoclimatologists also find clues in natural records. Annual records of climate are preserved in tree-rings, locked in the skeletons of tropical coral reefs, frozen in glaciers and ice caps, and buried in the sediments of lakes and oceans. These natural recorders of climate are called proxy climate data—that is, they substitute for thermometers, rain gauges, and other modern instruments used to record climate. By analyzing records taken from trees, reefs, glaciers, sediments, and other proxy sources, scientists can extend our understanding far beyond the 140-year instrumental record provided by thermometers and rain gauges.
Recent changes in the natural record from environmental proxy data can be calibrated using the 140-year instrumental record of climate changes.
What do we know about the history of climate?
Good weather records extend back only about 125 years. In that time, the Earth's global average temperature has increased by approximately 0.9°F. Scientists are trying to determine if this warming is a natural fluctuation, or a result of greenhouse warming.
From paleo records, we know that the climate of the past million years has been dominated by the glacial cycle, a pattern of ice ages and glacial retreats lasting thousands of years. In the even more ancient past, changes in climate have been linked to the movement of continents and to the storage of vast amounts of carbon in oil and coal beds.
How is paleoclimatology important?
Climate variability, including changes in the frequency of climate extremes (like droughts, floods, and storms), has always had a large impact on humans. A particularly severe El Niño, or relatively short drought, can cost U.S. citizens billions of dollars. For this reason, scientists study past climate variability and change to gain clues that will help them anticipate future climate change. This scientific information then helps society plan for future climate change.
Unfortunately, records of past climate change from satellites and human measurements (thermometers, rain gauges) are too short, generally less than 150 years, to examine the full range of climate variability. For this reason, it is critical to examine climate change going back hundreds and thousands of years using paleoclimate records from trees, coral, sediments, glaciers, and other natural "proxy" sources.
The study of paleoclimates has been particularly helpful in the discovery that Earth's climate system can shift between dramatically different climate states in a matter of years and/or decades. Understanding "climate surprise" of the past is critical if we are to avoid being surprised in the future by abrupt climatic change.
The study of past climate change also helps us understand whether humans are affecting Earth's climate system. The study of climate change over the last thousand years clearly shows that global warming of this century is real; and that the recent record warm years are likely unprecedented in the last 1,200 years. The paleoclimate record also allows us to examine the causes of past climate change, and to help unravel the natural causes of such climate change (for example: volcanic eruptions and solar variability) that may explain twentieth century global warming.
Lastly, most state of the art climate prediction done in the world is accomplished using large sophisticated computer models of the climate system. There has been a great deal of research focused on ensuring that these models can simulate most aspects of the modern, present-day, climate. It is also important to know how these same models simulate climate change. This can only be accomplished by comparing modeled past climate change with changes that are observed using paleoclimate records. Thus, paleoclimatology helps us gain confidence that our computer model simulations of future climate are worth believing.
What can we predict about climate in the future?
Powerful computer models are used to try to predict the climate of the future. The 1995 best estimates of The Inter-governmental Panel on Climate Change (IPCC) are for global warming by 2.7–7.2°F by the end of the next century. It is also likely that there will be substantial climate variability over the next 100 years, quite possibly including shifts in the frequency of severe droughts, floods, and El Niño.
The paleoclimate perspective can help us answer many questions, including…
- Is the last century of climate change unprecedented relative to the last 500, 2,000, and 20,000 years?
- Do recent global temperatures represent new highs, or just part of a longer cycle of natural variability?
- Is the recent rate of climate change unique or commonplace in the past?
- Can we find evidence in the paleoclimate record for mechanisms or climate forcings that could be causing recent climate change?
GLOBAL WARMING
What is global warming?
The term global warming refers to the perception that the atmosphere near Earth's surface is warming, without any implications for the causes or magnitude. This warming is one of many kinds of climate change that Earth has gone through in the past and will continue to go through in the future.
Temperature increases will have significant impacts on human activities; where we can live, what food we can grow and how or where we can grow food, and where organisms we consider pests can thrive. To be prepared for the effects of these potential impacts we need to know how much the Earth is warming, for how long the Earth is warming, and the cause of the warming. Answers to these questions will provide us with a better basis for making decisions related to issues such as water resource management and agricultural planning.
What is the greenhouse effect? How is it related to greenhouse warming and global warming?
The greenhouse effect is a term that describes how carbon dioxide, water vapor, and other gases in the atmosphere help maintain the temperature at Earth's surface. The atmosphere approximates the function of a greenhouse by first letting sunlight (solar or short wave radiation) pass through to warm Earth, while absorbing much of the heat (thermal or long wave radiation) radiated up from the surface of Earth and reradiating back to the surface.
Life on Earth would be very different without the greenhouse effect. The greenhouse effect serves to keep the long term annual average of Earth approximately 57°F higher than Earth's temperature would be without the greenhouse effect. It is reasonable to expect that Earth should warm as concentrations of greenhouse gases in the atmosphere increase above natural levels, much like what happens when the windows of a greenhouse are closed on a warm, sunny day. The additional warming is commonly referred to as greenhouse warming.
Greenhouse warming is global warming due to increases in atmospheric greenhouse gases (e.g., carbon dioxide, methane, chlorofluorocarbons, etc.) whereas global warming refers only to the observation that Earth is warming, without any indication of what might be causing the warming.
Global warming is accepted as fact by most of the scientific community. However, greenhouse warming is more controversial because it implies that we know what is causing the Earth to warm. It is certain that atmospheric concentrations of greenhouse gases are rising dramatically due to human activity, but exactly how these increases in greenhouse gases factor in the observed changes of Earth's climate and global temperatures is unknown.
How is the ozone issue different?
The ozone issue and greenhouse warming are related yet distinct scientific issues. In the lower atmosphere (the troposphere), ozone does act as a greenhouse gas, trapping outgoing radiation that would otherwise escape into space. Compared to carbon dioxide, ozone is a minor greenhouse gas. The significance of tropospheric ozone may be increasing however, due to the burning of fossil fuel, which generates ozone (commonly recognized as a component of smog) into the lower atmosphere.
Ozone also plays a very important, natural role in the upper atmosphere (the stratosphere). In the upper atmosphere, ozone acts as a shield against harmful ultraviolet (UV) radiation from the Sun. Reductions in stratospheric ozone result in the increase of harmful UV radiation reaching Earth's surface. Ninety percent of the atmospheric ozone is concentrated 6.2–24.9 miles above Earth's surface. Ironically, the biggest destroyer of the ozone in the stratosphere is the set of human produced chemical compounds—chlorofluorocarbons, or CFCs—that act as greenhouse gases in the lower atmosphere. Extremely cold stratospheric temperatures over the North and South Poles, combined with solar radiation and atmospheric circulation, amplify the impact of ozone destroying chemical reactions, resulting in "ozone holes" over Antarctica and the Arctic.
How do we study global warming?
There are several ways that scientists study how Earth's temperature is changing. Although each method has some uncertainties, they all suggest a similar story—that Earth has warmed dramatically over the last 140 years and that Earth is now warmer than it has been in the last 600 years.
As mentioned before, some scientists look at satellites to reveal something about Earth's changing climate. Although the satellite record is very short (ca. 20 years) and hard to interpret due to changes in instruments and orbits, the latest satellite studies confirm the same story—the globe is warming.
The record of instrumental temperature measurements, extending back to the nineteenth century, provides one clear indication: that the mean annual surface air temperature of the earth has risen approximately 0.9°F since 1860.
Paleoclimatic data provides an independent confirmation of this recent warming, and also places the nineteenth to twentieth century (1860 to the present) warming in the context of the last several centuries to millennia. The paleoclimatic record not only allows us to look at global temperature fluctuations over the last several centuries, it also permits scientists to examine past climate even further back in time. This perspective is an important capability in our quest to understand the possible causes of the twentieth century global warming. We can look at hypothesized warm periods in the distant past (e.g., 1,000; 6,000; 125,000; and even 165,000,000 years ago) to see if they provide clues for natural processes that could be causing the global warming we are now experiencing. So far, paleoclimatologists have been unable to find any natural climatic explanations for our present-day warming.
THE INSTRUMENTAL RECORD OF PAST GLOBAL TEMPERATURES
Satellite-derived temperature records
Satellite measurements have been used to reconstruct global atmospheric temperatures for the past 21 years. Current calculations show the lower atmosphere to be warming at a rate of 0.12°F per decade—an amount that is less rapid than indicated by ground-based thermometer and paleoclimatic data. It is uncertain why this disagreement exists.
Thermometer-based temperature trends (global & hemispheric)
The earliest records of temperature measured by thermometers are from western Europe beginning in the late seventeenth and early eighteenth centuries. The network of temperature collection stations increased over time and by the early twentieth century, records were being collected in almost all regions, except for polar regions, where collection began in the 1940s and 1950s. A set of temperature records of over 7,000 stations around the world have been compiled by the NOAA National Climatic Data Center (NCDC). About 1,000 of these records extend back into the nineteenth century.
Three widely recognized research programs have used the available instrumental data to reconstruct global surface air temperature trends from the late 1800s through today. All use the same land-based thermometer measurement records, but the reconstructions contain some differences. These differences are due to different approaches to spatial averaging, the use of treatment of sea surface temperature data (from ship observations), and the handling of the influence of changes in land-cover (i.e., increases in urbanization). However, all three show the same basic trends over the last 100 years.
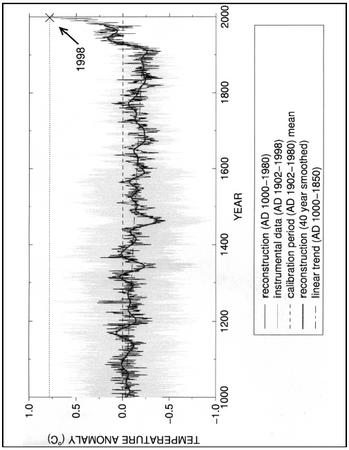
Paleoclimatic data of the last 1,000 years
Beginning in the 1970s, paleoclimatologists began constructing a blueprint of how Earth's temperature changed over the centuries before 1850 and the widespread use of thermometers. Out of this emerged a sketchy view of the past 1,000 years of climate, based on limited data from tree rings, historical documents, sediments, and other proxy data sources. Today, many more paleoclimate records are available from around the world, providing a much improved view of past changes in Earth's temperature.
In the last few years, there has been a major breakthrough in our understanding of global temperature change over the last 400–1,000 years. Although temperature reconstructions are different in various studies, they all show some similar patterns of temperature change over the last several centuries. Most striking is the fact that each record reveals that the twentieth century is the warmest of the entire record, and that warming was most dramatic after 1920.
The similar characteristics among the different paleoclimatic reconstructions provide greater confidence in concluding that there has been dramatic global warming since the nineteenth century and that the 1990s had the warmest temperatures on Earth in the last 1,000 years.
Paleoclimatic data before 1,000 years ago
To put the twentieth century in the perspective of the last 1,000 years, it is critical to look further back into Earth's history to see if previous periods of global warmth can provide clues about twentieth-century warming.
Several periods of warmth (listed below) are hypothesized to have occurred in the past. However, upon close examination of these periods, it becomes apparent that these periods of warmth are not similar to twentieth century warming for two specific reasons: (1) the periods of hypothesized past warming do not appear to be global in extent, or (2) the periods of warmth can be explained by known natural climatic forcing conditions that are uniquely different than those of the last 100 years.
Several commonly cited periods of warmth include:
- the so-called "Medieval Warm Period" (ca. ninth to fourteenth centuries)
- the so-called mid-Holocene "Warm Period" (ca. 6,000 years ago)
- the so-called penultimate interglacial period (ca. 125,000 years ago)
- the mid-Cretaceous Period (ca. 120–90 million years ago)
The latest paleoclimatic studies appear to confirm that the global warmth of the twentieth century may not necessarily be the warmest time in Earth's history. What is unique is that the warmth is global and cannot be explained by natural mechanisms.
What can paleoclimatology tell us about climate change relevant to society in the future?
To understand and predict changes in the climate system, we need a more complete understanding of seasonal to century scale climate variability than can be obtained from the instrumental climate record. The instrumental temperature record indicates that Earth has warmed by 0.9°F from 1860 to the present. However, this record is not long enough to determine if this warming should be expected under a naturally varying climate, or if it is unusual and perhaps due to human activities. Paleoclimatic proxy data can be used to extend climate records and provide a longer time frame (hundreds to tens of thousands of years) for evaluating the warming of the last 140 years.
The cause of global warming over the last century remains a heated debate with significant economic and societal implications. Many scientists attribute the current global warming to the greenhouse effect enhanced by human activities. Other scientists have suggested that other factors are responsible, such as natural changes in the number and size of volcanic eruptions or an increase in the Sun's output (such phenomena are referred to as climate forcings). A paleoclimate perspective provides information about long term changes in different climate forcings that may be the underlying cause of the observed climate change.
An analogy of how paleoclimatic data improves our understanding of climate can be explained in terms of the stock market. Stock market analyses use longer term trends (one, two, three, or six months) in the stock market indices (Dow Jones, NASDAQ, etc.) rather than depending on changes from one day to the next or over a week to predict what the market will do next (i.e., bull or bear market). In much the same way, the paleoclimate perspective allows us to evaluate climate change many decades and centuries into the past, in order to develop a more reliable estimate of how climate may change the future.
Paleoclimatology and global warming
Researchers have tried to highlight what paleoclimatic data are, where they come from, and what the data contribute to the global warming debate. When one reviews all the data, both from thermometers and paleotemperature proxies, it becomes clear that Earth has warmed significantly over the last 140 years; global warming is a reality. Multiple paleoclimatic studies indicate that the recent year, decade, and century are all the warmest, on a global basis, of the last 600, and most likely 1,200 years. It appears that the global warming of the last century is unprecedented in the last 1,200 years.
There are, however, questions remaining concerning global warming. For instance, what is causing all the warming and what are the implications for the future? The answers to these questions are not simple.
There is considerable debate centered on the cause of twentieth century climate change. Few people contest the idea that some of the recent climate changes are likely due to natural processes, such as volcanic eruptions, changes in solar luminosity, and variations generated by natural inter-actions between parts of the climate system (for example, oceans and the atmosphere). There were significant climate changes before humans were around and there will be non-human causes of climate change in the future.
Just the same, with each year, more and more climate scientists are coming to the conclusion that human activity is also causing the climate of Earth to change. First on the list of likely human influences is greenhouse warming due to human-caused increases in atmospheric trace-gases. Other human activities are thought to drive climate as well. There is no doubt that humans are causing the level of atmospheric trace-gases to increase dramatically—the measurements match the predictions. There is also no doubt that these gases will contribute to global warming (since they warmed Earth before humans). However, there is uncertainty about some issues. For example, these questions remain to be answered with complete confidence:
- How much warming has occurred due to anthropogenic increases in atmospheric trace-gas levels?
- How much warming will occur in the future?
- How fast will this warming take place?
- What other kinds of climatic change will be associated with future warming?
Paleoclimatolgy offers to help answer each of these questions. The best estimate is that about 50% of the observed global warming is now due to greenhouse gas increases. Although this number will continue to be refined, it indicates that the climate modeling community is on target with their estimates that the Earth may warm an additional 3–7°F in the next century.
What future global warming means to society is beyond the scope of this discussion. However, studies have indicated that unprecedented twentieth century warming has affected the Arctic environment, and the warming already seems to be causing unprecedented changes in glaciers, permafrost, lakes, ecosystems, and the oceans, and it is likely that future changes will be even more dramatic as the warming continues.
NORTH AMERICAN DROUGHT: A PALEO PERSPECTIVE
Droughts occur throughout North America, and in a given year, at least one region is experiencing drought conditions. The major drought of the twentieth century, in terms of duration and spatial extent, is considered to be the 1930s Dust Bowl drought, which lasted up to seven years in some areas of the Great Plains. The 1930s Dust Bowl drought, vividly portrayed in John Steinbeck's novel, The Grapes of Wrath , was so severe, widespread, and lengthy that it resulted in a mass migration of millions of people from the Great Plains to the western United States in search of jobs and better living conditions.
Just how unusual was the Dust Bowl drought? Was this a rare event or should we expect drought of similar magnitude to occur in the future? Rainfall records used to evaluate drought extend back 100 years, too short a time to answer these questions. However, these questions can be answered by analyzing records from tree rings, lake and dune sediments, archaeological remains, historical documents and other environmental indicators, which can extend our understanding of past climate far beyond the 100-year instrumental record.
What is drought?
The difficulty of recognizing the onset or end of a drought is compounded by the lack of any clear definition of drought. Drought can be defined by rainfall amounts, vegetation conditions, agricultural productivity, soil moisture, levels in reservoirs, stream flow, or economic impacts. In the most basic terms, a drought is simply a significant deficit in moisture availability due to lower than normal rainfall. However, even this simple definition is complicated when attempts are made to compare droughts in different regions. For example, a drought in New Jersey would make for wet conditions in the deserts of Arizona!
Drought, as measured by scientists, is defined by evaluating precipitation, temperature, and soil moisture data, for the present and past months. A number of different indices of drought have been developed to quantify drought, each with its own strengths and weaknesses. Two of the most commonly used are the Palmer Drought Severity Index (PDSI) and the Standard Precipitation Index (SPI). Drought conditions are monitored constantly using these and other indices to provide current information on drought-impacted regions.
Because of the elusive nature of drought, we do not think of droughts in the same way as other weather-related catastrophes, such as floods, tornadoes, and hurricanes. However, although droughts may be less spectacular, they are often more costly than other types of natural disasters, and no region in North America is immune to periodic droughts.
Why are we concerned about drought?
Although the major droughts of the twentieth century, the 1930s Dust Bowl and the 1950s droughts, had the most severe impact on the central United States, droughts occur all across North America. Florida suffered from the 1998 drought along with the states of Oklahoma and Texas. Extensive drought-induced fires burned over 475,000 acres in Florida and cost $500 million in damages. In the same year, Canada suffered its fifth-highest fire occurrence season in 25 years. Starting in 1998, three years of record low rainfall plagued northern Mexico. 1998 was declared the worst drought in 70 years. It became worse as 1999 spring rains were 93% below normal. The government of Mexico declared five northern states disaster zones in 1999, and nine in 2000. The U.S. West Coast experienced a six-year drought in the late 1980s and early 1990s, causing Californians to take aggressive water conservation measures. Even the typically humid northeastern U.S. experienced a five-year drought in the 1960s that drained reservoirs in New York City down to 25% of capacity. In fact, almost every year, some region of North America experiences drought.
Drought is a natural hazard that cumulatively has affected more people in North America than any other natural hazard. The cost of losses due to drought in the United States averages $6–8 billion every year, but range as high as $39 billion for the three years drought of 1987–1989, which was the most costly natural disaster documented in U.S. history. Continuing uncertainty in drought prediction contributes to crop insurance payoffs of over $175 million per year in western Canada.
Beyond the monetary costs, the impacts of drought on society, the economy, and the natural environment are tremendous. Although measures such as development of irrigation systems, financial aid programs, and interbasin water transfers have been undertaken to mitigate the impacts of drought in recent decades, some regions of the United States are becoming more vulnerable to the impacts of drought.
Although irrigation has made it possible to grow crops on land that was once considered barren, this practice has led to a reliance on groundwater and surface storage in reservoirs. Increasing demands on water supplies have resulted in the depletion of groundwater reserves in many areas, which can make the removal of additional water uneconomical if not impossible, especially during a drought. In many urban areas of the semi-arid and arid western United States, population growth, expansion into marginal areas, and the subsequent development is overtaxing water supplies and heightening vulnerability to drought. Along with this increased vulnerability, concern exists because some research suggests that drought in the future may be amplified in certain areas due to changes in climate variability and extremes resulting from global warming.
Scientists have much to learn about the characteristics of drought and the conditions that lead to the persistence of drought. Although some progress has been made, (for instance, droughts that are related to El Niño and the Southern Oscillation (ENSO) are now more predictable on a seasonal scale), scientists still cannot predict longer, multi-year droughts.
The two major droughts of the twentieth century, the 1930s Dust Bowl drought and the 1950s drought, lasted five to seven years and covered large areas of the continental United States. Complete scientific understanding of how and why these two drought episodes occurred remains elusive. From a societal perspective, the important question is, how unusual are these events? Most instrumental records (from thermometers and rain gauges) are only about 100 years long, so they are too short to answer this question. However, paleoclimatic proxy data are a valuable tool to investigate this question by providing a longer context within which to evaluate the reoccurrence of these major droughts over hundreds to thousands of years.
Twentieth century drought
The Dust Bowl
The Dust Bowl drought was a natural disaster that severely affected much of the United States during the 1930s. The drought came in three waves, 1934, 1936, and 1939–40, but some regions of the High Plains experienced drought conditions for as long as eight years. The "dust bowl" effect was caused by sustained drought conditions compounded by years of land management practices that left topsoil susceptible to the forces of the wind. The soil, depleted of moisture, was lifted by the wind into great clouds of dust and sand that were so thick they concealed the sun for several days at a time. They were referred to as "black blizzards."
The agricultural and economic damage devastated residents of the Great Plains. The Dust Bowl drought worsened the already severe economic crisis that many Great Plains farmers faced. In the early 1930s, many farmers were trying to recover from economic losses suffered during the Great Depression. To compensate for these losses, they began to increase their crop yields. High production drove prices down, forcing farmers to keep increasing their production to pay for both their equipment and their land. When the drought hit, farmers could no longer produce enough crops to pay off loans or even pay for essential needs. Even with the federal emergency aid, many Great Plains farmers could not withstand the economic crisis of the drought. Many farmers were forced off their land, with one in ten farms changing possession at the peak of the farm transfer.
In the aftermath of the Dust Bowl, it was clear that many factors contributed to the severe impact of this drought. A better understanding of the interactions between the natural elements (climate, plants, and soil) and human-related elements (agricultural practices, economics, and social conditions) of the Great Plains was needed. Lessons were learned and because of this drought, farmers adopted new cultivation methods to help control soil erosion in dry land ecosystems. Subsequent droughts in this region have had less impact due to these cultivation practices.
The 1950s drought
Fueled by post-war economic stability and technological advancement, the 1950s represented a time of growth and prosperity for many Americans. While much of the country celebrated resurgence of well being, many residents of the Great Plains and the southwestern United States withstood a five-year drought, and in three of these years, drought conditions stretched coast to coast. The drought was first felt in the southwestern United States in 1950 and spread to Oklahoma, Kansas, and Nebraska by 1953. By 1954, the drought encompassed a 10-state area reaching from the Midwest to the Great Plains, and southwest into New Mexico. The area from the Texas panhandle to central and eastern Colorado, western Kansas, and central Nebraska experienced severe drought conditions. The drought maintained a stronghold in the Great Plains, reaching a peak in 1956. The drought subsided in most areas with the spring rains of 1957.
The 1950s drought was characterized by both low rainfall amounts and excessively high temperatures. Texas rainfall dropped by 40% in 1949–1951 and by 1953, 75% of Texas recorded below normal rainfall amounts. Excessive temperatures heated up cities like Dallas where temperatures exceeded 100°F on 52 days in the summer of 1953. Kansas experienced severe drought conditions during much of the five-year period, and recorded a negative Palmer Drought Severity Index from 1952 until March 1957, reaching a record low in September of 1956.
A drought of this magnitude creates severe social and economic repercussions and this was definitely the case in the southern Great Plains region. The drought devastated the region's agriculture. Crop yields in some areas dropped as much as 50%. Excessive temperatures and low rainfall scorched grasslands typically used for grazing. With grass scarce, hay prices became too costly, forcing some ranchers to feed their cattle a mixture of prickly pear cactus and molasses. By the time the drought subsided in 1957, many counties across the region were declared federal drought disaster areas, including 244 of the 254 counties in Texas.
The 1987–1989 drought
The three-year drought of the late 1980s (1987–1989) covered 36% of the United States at its peak. Compared to the Dust Bowl drought, which covered 70% during its worst year, this does not seem significant. However, the 1980s drought was not only the costliest in U.S. history, but also the most expensive natural disaster of any kind to affect the United States. Combining the losses in energy, water, ecosystems, and agriculture, the total cost of the three-year drought was estimated at $39 billion. Drought-related losses in western Canada exceeded $1.8 billion dollars in 1988 alone.
The drought, beginning along the West Coast and extending into the northwestern United States, had its greatest impact in the northern Great Plains. By 1988, the drought intensified over the northern Great Plains and spread across much of the eastern half of the United States. The drought affected much of the nation's primary corn and soybean growing areas, where total precipitation for April through June of 1988 was even lower than during the Dust Bowl. The drought also encompassed the upper Mississippi River basin where low river levels caused major problems for barge navigation. The summer of 1988 is well known for the extensive forest fires that burned across western North America, including the catastrophic Yellowstone fire. In addition to dry conditions, heat waves during the summer of 1988 broke long-standing temperature records in many Midwestern and northeastern metropolitan areas.
The 1987–89 drought was the first widespread persistent drought since the 1950s and undoubtedly took people by surprise. Many had not experienced the 1950s drought and others had forgotten about the harsh realities of drought. The financial costs of this drought were an indication that many parts of the country are now more vulnerable to drought than ever before. This increased vulnerability was due in part to farming on marginally arable lands and pumping of ground water to the point of depletion. Although surplus grain and federal assistance programs offset the impacts of the 1987–89 drought, these types of assistance programs would be less feasible during a lengthier drought.
Another Dust Bowl?
What is the likelihood of another Dust Bowl-scale drought in the future? No one has yet been able to scientifically predict multi-year or decadal droughts, but the paleoclimatic record can tell us how frequently droughts such as the 1930s Dust Bowl occurred in the past or if droughts of this magnitude are indeed a rare event. If such droughts occurred with some regularity in the past, then we should expect them to occur in the future.
PALEOCLIMATOLOGY AND DROUGHT
How do we reconstruct drought from paleoclimatic data?
Records of rainfall (or other variables that reflect drought, such as changes in lake salinity, vegetation, or evidence of blowing sand) are preserved in tree-rings, buried in the sediments of sand dunes and lakes, contained within historical documents, and preserved in archaeological remains. By analyzing records taken from these proxy sources of paleodrought data, scientists can extend our records of drought far beyond the 100-year record provided by instruments.
To reconstruct drought or drought-related variables from environmental proxy data, the proxy data are calibrated with the instrumental record to determine how well the natural record estimates the climate record. The mathematical relationship between the proxy data and the climate record is defined, then used to produce a model. The model is then used to reconstruct the instrumental record from the proxy record for the length of the proxy.
Does paleoclimatic data help us understand drought?
Proxy records from tree rings, lake and dune sediments, historical records, and archaeological remains have all provided information about past droughts in the United States. Each record provides a piece of the puzzle, and together, they provide a more complete history than any one proxy would.
Historical records, such as diaries and newspaper accounts, can provide detailed information about droughts for the last 200 (Midwest and western U.S.) or 300 (eastern U.S.) years. Tree-ring records can extend back 300 years in most areas, and thousands of years in some regions. In trees that are sensitive to drought conditions, tree rings provide a record of drought for each year of the tree's growth. For records longer than those provided by trees and historical accounts (and for regions where we may not find trees and/or historical accounts), scientists turn to dune and lake sediments.
Lake sediments, if the core of the sediments is sampled at very frequent intervals, can provide information about variations occurring at frequencies less than a decade in length. Lake level fluctuations can be recorded as geologic bath tub rings as beach material sediments are deposited either high (further from the center under wetter conditions) or lower (closer to the center under drier conditions) within a basin as the water depth and thus lake level changes in response to drought. Droughts can increase the salinity of lakes, changing the species of small, lake-dwelling organisms that occur within a lake.
Pollen grains get washed or blown into lakes and accumulate in sediments. Different types of pollen in lake sediments reflect the vegetation around the lake and the climate conditions that are favorable for that vegetation. So, a change in the type of pollen found in sediments from, for example, an abundance of grass pollen to an abundance of sage pollen, can indicate a change from wet to dry conditions.
Records of more extreme environmental changes can be found by investigating the layers within sand dunes. The sand layers are interspersed among layers of soil material produced under wetter conditions, between the times when the sand dune was active. For a soil layer to develop, the climate needs to be wet for an extended period of time, so these layers reflect slower, longer-lasting changes.
Taken together, these different proxies record variations in drought conditions on the order of single seasons to decadal and century-scale changes, providing scientists with the information about both rapid and slow changes, and short and long periods of drought. These records are needed to put individual droughts in perspective, as well as to characterize droughts of the twentieth century.
The instrumental record
Instrumental records of drought (observed data measured by weather monitoring instruments) are a valuable resource that help detect the onset of drought. Although scientists have not yet refined drought prediction skills, these instrumental data provide us with information on current and developing droughts. The instrumental records also give us a picture of the short-term behavior (less than 100 years) and spatial patterns of drought, helping scientists learn more about the character of droughts. Actual observed data are important in paleoclimatic studies because they enable the calibration of the instrumental data with proxy data, a process needed to generate reconstructions of climate from proxy data, and also to allow researchers to determine how accurately different proxy records reconstruct climate.
Variations in the El Niño/Southern Oscillation (ENSO) in the equatorial Pacific are accomplished by changes in atmospheric flow and pressure systems in midlatitudes. These changes, in turn, affect climate across North America, especially in winter. Thus, certain phases of ENSO can increase the likelihood of more unusual and/or persistent weather conditions, such as drought, in some areas. For example, during El Niño, winters are wetter from California to the southeastern United States, while unusually warm conditions tend to persist from Alaska south through southwestern Canada and eastward to the Great Lakes. During La Niña, drought conditions are likely across the southwestern and southeastern U.S., while the northwestern United States can experience unusually wet winters, and cool conditions persist in a broad band from Alaska to western Canada and across the northern tier of the United States.
The last 500 years
A girded network of tree-ring reconstructions of Palmer Drought Severity Index (PDSI) for the last 300 years has been used to create a set of maps of the spatial pattern of PDSI for each year, back to A.D . 1700. This set of maps enables an assessment of the droughts of the twentieth century compared to droughts for the past 300 years. An inspection of the maps shows that droughts similar to the 1950s, in terms of duration and spatial extent, occurred once or twice a century for the three centuries (for example, during the 1860s, 1820, 1730s). However, there has not been another drought as extensive and prolonged as the 1930s drought in the past 300 years.
Longer records show strong evidence for a drought that appears to have been more severe in some areas of central North America than anything we have experienced in the twentieth century, including the 1930s drought. Tree-ring records from around North America document episodes of severe drought during the last half of the sixteenth century. Drought is reconstructed as far east as Jamestown, Virginia, where tree rings reflect several extended periods of drought that coincided with the disappearance of the Roanoke Island, North Carolina, colonists, and difficult times for the Jamestown colony. These droughts were extremely severe and lasted for three to six years, a long time for such severe drought conditions to persist in this region of North America.
Coincident droughts, or droughts during the same time, are apparent in tree-ring records from Mexico to British Columbia, and from California to the East Coast. Winter and spring drought conditions appear to have been particularly severe in the southwestern U.S., and northwestern Mexico, where this drought appears to have lasted several decades. In other areas, drought conditions were milder, suggesting drought impacts may have been tempered by seasonal variations.
The last 2,000 years
When records of drought for the last two millennia are examined, the major twentieth century droughts appear to be relatively mild in comparison with other droughts that occurred within this time frame. Even the sixteenth century drought appears to be fairly modest, when compared to some early periods of drought. Although there are still a few high resolution (offering data on annual to seasonal scales), precisely dated (to the calendar year), tree-ring records available that extend back 2,000 years, most of the paleodrought data that extends back this far are less precisely dated and more coarsely resolved. These records reflect periods of more frequent drought, or drier overall conditions rather than single drought events, so it is difficult to compare droughts in these records with twentieth century drought events. However, the twentieth century can still be evaluated in this context, and we can assess whether parts of the twentieth century as a whole were wetter or drier than in the past with these records.
Even longer records
Data from a variety of paleoclimate sources document drought conditions across North America over the past 10,000 years. These records, with decade to century resolution, document extended periods of extremely dry conditions in different regions of North America. These periods of drought were severe enough and of long enough duration to impact vegetation composition, fire frequency, and to mobilize sand dunes in the Great Plains.
Evidence for these dry periods comes from paleoclimate proxy data such as pollen, charcoal, minerals and other materials within lake sediments, and sand dune sediments. Fossil pollen data provide information about changes in vegetation composition, used to reconstruct past changes in precipitation and temperature. Relative changes in charcoal abundance, indicative of fire, are interpreted in terms of climatic conditions favorable to fire. Changes in the composition and the chemistry of sediments of lakes provide information on regional aridity and drought. Lake level records are a direct measurement of moisture balance providing information on long-term hydrologic variability. The interpretation and dating of ancient soils and wind-blown sand/silt deposits constrain the timing and magnitude of sand dune mobilization associated with large-scale droughts.
How is the paleoclimatic record of drought relevant for understanding or predicting drought today, or in the future?
The North American record of past drought allows researchers to determine what has been the range of natural variability of drought over hundreds if not thousands of years. This long-term perspective is important because although severe droughts have occurred in the twentieth century, a more long-term look at past droughts, when climate conditions appear to have been similar to today, indicates that twentieth century droughts do not represent the possible range of drought variability.
The paleoclimatic record of past droughts is a better guide than the instrumental record alone for estimating the magnitude and duration of future droughts. For example, paleoclimatic data suggest that droughts as severe as the 1950s drought have occurred in central North America several times a century over the past 300–400 years, and thus we should expect (and plan for) similar droughts in the future. The paleoclimatic record also indicates that drought of a much greater duration than any in the twentieth century has occurred in parts of North America as recently as 500 years ago. These data indicate that we should be aware of the possibility of such droughts occurring in the future as well. The occurrence of such sustained drought conditions today would be a natural disaster of a magnitude unprecedented in the twentieth century.
In addition to establishing a baseline of drought variability over the long term, the paleoclimatic record of drought provides information about drought under a range of naturally varying climate conditions, some of which are the same as the climate of today and some which are quite different. This paleoclimatic perspective can be used to learn about the underlying process and characteristics of drought under very different future climate conditions.
The impact of droughts over the last few decades have shown that some regions and sectors of the population are becoming increasingly vulnerable to drought. Compounding these vulnerabilities is the uncertainly of the effects of human activities and global warming on climate in general and on drought in particular. A number of climate model simulations for doubled CO 2 conditions suggest an increased frequency of drought in midcontinental regions whereas other model simulations and recent decadal trends in the instrumental record suggest wetter conditions, at least in the short term, due to an intensification of the hydrologic cycle associated with warmer sea surface temperatures. Better constrained answers to the question of the severity of future droughts require improved understanding and modeling of the processes underlying the drought behavior exhibited in both the instrumental and the paleoclimatic records.
What can we do to better understand past droughts and predict future droughts?
Our understanding of what causes drought conditions to persist for years and decades is far from complete. Much is needed to comprehensively understand drought and the causes of drought, and to improve drought prediction capabilities. Putting together the pieces of past droughts through the use of paleoclimatic data is a vital part of building this understanding and developing an improved capacity to anticipate droughts in the future.
Focused efforts are needed to bring together paleoclimatic records of past droughts with scientists working to better understand the workings of the climate system. Currently, scientists are working on this sort of focused effort for western Canada. In the Prairie Drought Paleolimnology Project, paleoclimatic reconstructions will be incorporated into novel models specifically developed for use with long-term climatic data. The models will be used to predict drought frequency, duration, and intensity over the next five to 50 years. More such efforts are needed to understand the drought across all of North America.
SUMMARY
In conclusion, paleoclimatology is an important tool in understanding the past and predicting future trends in Earth's climate. Paleoclimatology allows scientists to establish long-term norms and give current conditions a context for comparison. In this way scientists can determine whether or not humans are affecting Earth's climate, and if so, what the result of these effects might be. Some scientists note that a change of only a few degrees, of 6–8°F, in average global temperature can swing a moderate climate into an ice age or warm it up substantially. Swings of this magnitude have been occurring throughout Earth's history.
In addition, paleoclimatology lets scientists look at the past and determine how often a particular event, such as a drought, happens and plan accordingly. Paleoclimatology looks into the past to help explain the future.
Pascal