United States Weather in Atlas Format


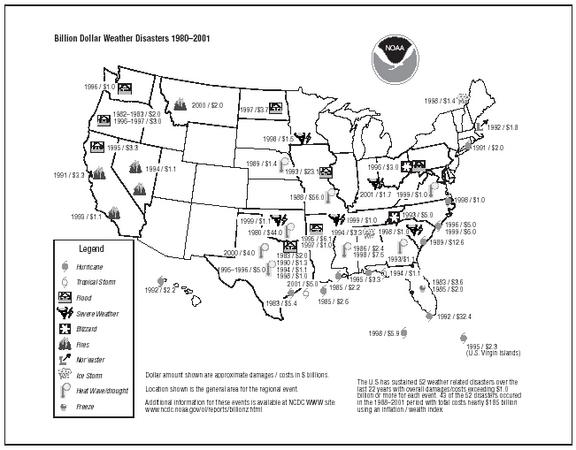
Billion Dollar U.S. Weather Disasters 1980 - 2000
National Climatic Data Center
Asheville, NC 12/21/2000

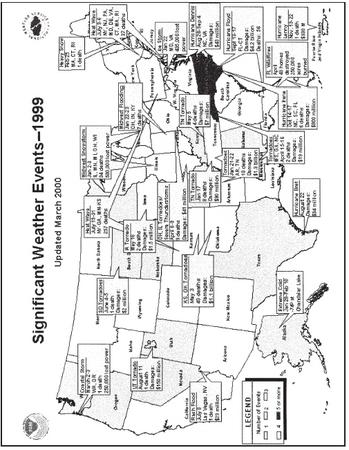
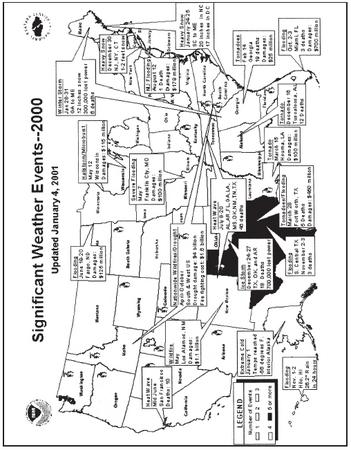
The U.S. has sustained 48 weather-related disasters over the past 21 years in which overall damages/costs reached or exceeded $1 billion, 41 of these disasters occurred during the 1988-2000 period with total damages/costs exceeding $180 billion. Seven occurred during 1998 alone—the most for any year on record, though other years have recorded higher damage totals. Events are listed below beginning with the most recent.
Two damage figures are given for events prior to 1996—the first figure represents actual dollar costs at the time of the event and is not adjusted for inflation. Therefore, event costs over time should not be compared using this value. The second value in parenthesis (if given) is the dollar costs normalized to 1998 dollars using a GNP inflation/wealth index. The total normalized losses for the 48 events are nearly $280 billion.
- Drought/Heat Wave Spring-Summer 2000. Severe drought and persistent heat over south central and southeastern states causing significant losses to agriculture and related industries; preliminary estimate of over $4.0 billion in damage/costs; estimated 140 deaths nationwide
-
Western Fire Season
Spring-Summer 2000. Severe fire season in western states due to
drought and frequent winds, with nearly 7 million acres burned;
estimate of over $2.0 billion in damage/costs (includes fire
suppression); no deaths reported.

- Hurricane Floyd September 1999. Large, category 2 hurricane makes landfall in eastern NC, causing 10-20 inch rains in 2 days, with severe flooding in NC and some flooding in SC, VA, MD, PA, NY, NJ, DE, RI, CI, MA, NH, and VT, estimate of at least $6.0 billion damage/costs; 77 deaths.
- Eastern Drought/Heat Wave Summer 1999 Very dry summer and high temperatures, mainly in eastern U.S., with extensive agricultural losses, over $1.0 billion damage/costs: estimated 502 deaths.
- Oklahoma-Kansas Tornadoes May 1999. Outbreak of F4-F5 tornadoes hit the states of Oklahoma and Kansas, along with Texas and Tennessee. Oklahoma City area hardest hit: over $1.1 billion damage/costs. 56 deaths.
- Arkansas-Tennessee Tornadoes January 1999. Two outbreaks of tornadoes in 6-day period stake Arkansas and Tennessee; approximately $1.3 billion damage/costs; 17 deaths.
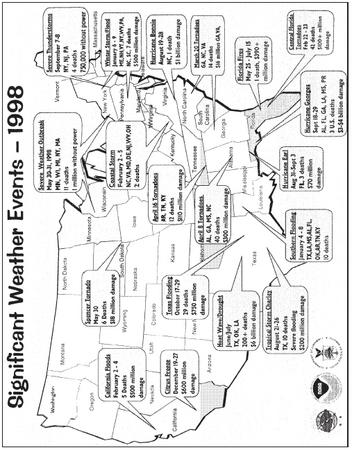
- Texas Flooding October November 1998. Severe flooding in southeast Texas from 2 heavy rain events, with 10-20 inch rainfall totals; approximately $1.0 billion damage/costs. 31 deaths.
- Hurricane Georges September 1998. Category 2 hurricane strikes Puerto Rico, Florida Keys, and Gulf coasts of Louisiana. Mississippi, Alabama, and Florida panhandle, 15-30 inch 2 day rain totals in parts of ALML estimated $5.9 billion damage/costs: 16 deaths.
- Hurricane Bonnie August 1998. Category 3 hurricane strikes eastern North Carolina and Virginia, extensive agricultural damage due to winds and flooding, with 10-inch rains in 2 days in some locations; approximately $1.0 billion damage/costs; 3 deaths.
- Southern Drought/Heat Wave Summer 1998. Severe drought and heat wave from Texas/Oklahoma eastward to the Carolinas. $6.0-$9.0 billion damage/costs to agriculture and ranching; at least 200 deaths.
- Minnesota Severe Storms/Hail May 1998. Very damaging severe thunderstorms with large hail over wide areas of Minnesota; over $1.5 billion damage/costs: 1 death.
- Southeast Severe Weather Winter-Spring 1998. Tornadoes and flooding related to El Nino in southeastern states: over $1.0 billion damage/costs; at least 132 deaths.
- Northeast Ice Storm January 1998. Intense ice storm hits Maine, New Hampshire, Vermont, and New York, with extensive forestry losses; over $1.4 billion damage/costs; 16 deaths.
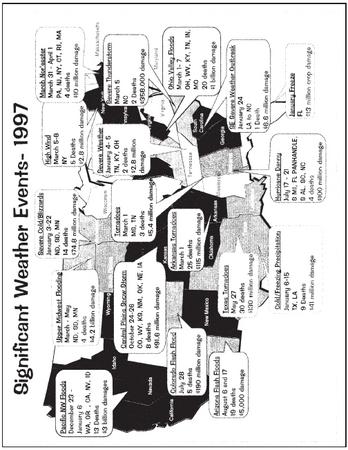
- Northern Plains Flooding April-May 1997. Severe flooding in Dakotas and Minnesota due to heavy spring snowmelt: approximately $3.7 billion damage/costs. 11 deaths.
- MS and OH Valleys Flooding & Tornadoes March 1997. Tornadoes and severe flooding hit the states of AR, MO, MS, TN, Q, IN, KY, OH, and WV, with over 10 inches of rain in 24 hours in Louisville: estimated $1.0 billion damage/costs; 67 deaths.
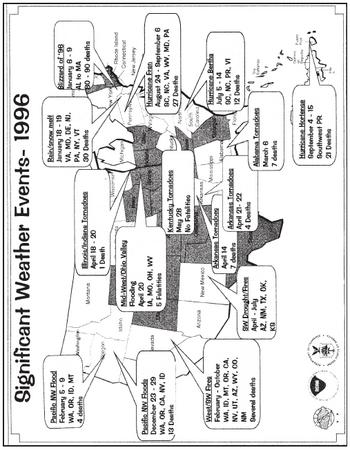
- West Coast Flooding December 1996-January 1997. Lorrential rains (10-40 inches in 2 weeks) and snowmelt produce severe flooding over portions of CA, WA, OR, IO, NV, and MT: approximately $3.0 billion damage/costs: 36 deaths.
-
Hurricane Fran
September 1996. Category 3 hurricane strikes North Carolina and
Virginia, over 10-inch 24-hour rains in some locations and extensive
agricultural and other losses, over $5.0 billion damage/costs; 37
deaths.

(Courtesy of National Climatic Data Center/NOAA. )
- Southern Plains Severe Drought Fall 1995 through Summer 1996. Severe drought in agricultural regions of southern plains-Texas and Oklahoma most severely affected; approximately $5.0 billion damage/costs; no deaths.
- Pacific Northwest Severe Flooding February 1996. Very heavy, persistent rains (10-30 inches) and melting snow over OR, WA, ID, and western MT; approximately $1.0 billion damage/costs; 9 deaths.
- Blizzard of '96 Followed by Flooding January 1996. Very heavy snowstorm (1-4 feet) over Appalachians, Mid-Atlantic, and Northeast; followed by severe flooding in parts of same area due to rain & snowmelt; approximately $3.0 billion damage/costs; 187 deaths.
- Hurricane Opal October 1995. Category 3 hurricane strikes Florida panhandle, Alabama, western Georgia, eastern Tennessee, and the western Carolinas, causing storm surge, wind, and flooding damage; over $3.0 (3.3) billion damage/costs; 27 deaths.
- Hurricane Marilyn September 1995. Category 2 hurricane devastates U.S. Virgin Islands; estimated $2.1 (2.3) billion damage/costs; 13 deaths
- Texas/Oklahoma/Louisiana/Mississippi Severe Weather and Flooding May 1995. Torrential rains, hail, and tornadoes across Texas - Oklahoma and southeast Louisiana - southern Mississippi, with Dallas and New Orleans areas (10-25 inch rains in 5 days) hardest hit; $5.0-$6.0 (5.5-6.6) billion damage/costs; 32 deaths.
- California Flooding January-March 1995. Frequent winter storms cause 20-70 inch rainfall and periodic flooding across much of California; over $3.0 (3.3) billion damage/costs; 27 deaths.
- Western Fire Season Summer-Fall 1994. Severe fire season in western states due to dry weather; approximately $1.0 (1.1) billion damage/costs; death toll undetermined.
- Texas Flooding October 1994. Torrential rain (10-25 inches in 5 days) and thunderstorms cause flooding across much of southeast Texas; approximately $1.0 (1.1) billion damage/costs; 19 deaths.
- Tropical Storm Alberto July 1994. Remnants of slow-moving Alberto bring torrential 10-25 inch rains in 3 days, widespread flooding and agricultural damage in parts of Georgia, Alabama, and panhandle of Florida; approximately $1.0 (1.1) billion damage/costs; 32 deaths.
- Southeast Ice Storm February 1994. Intense ice storm with extensive damage in portions of TX, OK, AR, LA, MS, AL, TN, GA, SC, NC, and VA; approximately $3.0 (3.3) billion damage/costs; 9 deaths.
- California Wildfires Fall 1993. Dry weather, high winds and wildfires in Southern California; approximately $1.0 (1.1) billion damage/costs; 4 deaths.
- Midwest Flooding Summer 1993. Severe, widespread flooding in central U.S. due to persistent heavy rains and thunderstorms; approximately $21.0 (23.1) billion damage/costs; 48 deaths.
- Drought/Heat Wave Summer 1993. Southeastern U.S.; about $1.0 (1.1) billion damage/costs to agriculture; at least 16 deaths.
- Storm/Blizzard March 1993. "Storm of the Century" hits entire eastern seaboard with tornadoes (FL), high winds, and heavy snows (2-4 feet); $3.0-$6.0 (3.3-6.6) billion damage/costs; approximately 270 deaths.
- Nor'easter of 1992 December 1992. Slow-moving storm batters northeast U.S. coast, New England hardest hit; $1.0-$2.0 (1.2-2.4) billion damage/costs; 19 deaths.
- Hurricane Iniki September 1992. Category 4 hurricane hits Hawaiian island of Kauai; about $1.8 (2.2) billion damage/costs; 7 deaths.
- Hurricane Andrew August 1992. Category 4 hurricane hits Florida and Louisiana, high winds damage or destroy over 125,000 homes; approximately $27.0 (32.4) billion damage/costs; 61 deaths.
- Oakland Firestorm October 1991. Oakland, California firestorm due to low humidities and high winds; approximately $2.5 (3.3) billion damage/costs; 25 deaths.
- Hurricane Bob August 1991. Category 2 hurricane-Mainly coastal North Carolina, Long Island, and New England; $1.5 (2.0) billion damage/costs; 18 deaths.
- Texas/Oklahoma/Louisiana/Arkansas Flooding May 1990. Torrential rains cause flooding along the Trinity, Red, and Arkansas Rivers in TX, OK, LA, and AR; over $1.0 (1.3) billion damage/costs; 13 deaths.
- Hurricane Hugo September 1989. Category 4 hurricane devastates South and North Carolina with - 20 foot storm surge and severe wind damage after hitting Puerto Rico and the U.S. Virgin Islands; over $9.0 (12.6) billion damage/costs (about $7.1 (9.9) billion in Carolinas); 86 deaths (57-U.S. mainland, 29-U.S. Islands).
- Northern Plains Drought Summer 1989. Severe summer drought over much of the northern plains with significant losses to agriculture; at least $1.0 (1.4) billion in damage/costs; no deaths reported.
- Drought/Heat Wave Summer 1988. 1988 drought in central and eastern U.S. with very severe losses to agriculture and related industries; estimated $40.0 (56.0) billion damage/costs; estimated 5,000 to 10,000 deaths (includes heat stress-related).
- Southeast Drought/Heat Wave Summer 1986. Severe summer drought in parts of the southeastern U.S. with severe losses to agriculture; $1.0-$1.5 (1.6-2.4) billion in damage/costs; estimated 100 deaths.
- Hurricane Juan October-November 1985. Category 1 hurricane-Louisiana and Southeast U.S.-severe flooding; $1.5 (2.6) billion damage/costs; 63 deaths.
- Hurricane Elena August-September 1985. Category 3 hurricane-Florida to Louisiana; $1.3 (2.2) billion damage/costs; 4 deaths.
- Florida Freeze January 1985. Severe freeze central/northern Florida; about $1.2 (2.0) billion damage to citrus industry; no deaths.
- Florida Freeze December 1983. Severe freeze central/northern Florida; about $2.0 (3.6) billion damage to citrus industry; no deaths.
- Hurricane Alicia August 1983. Category 3 hurricane-Texas; $3.0 (5.4) billion damage/costs; 21 deaths.
- Drought/Heat Wave June-September 1980. Central and eastern U.S.; estimated $20.0 (44.0) billion damage/costs to agriculture and related industries; estimated 10,000 deaths (includes heat stress-related).
These statistics were taken from a wide variety of sources and represent, to the best of our ability, the estimated total costs of these events—that is, the costs in terms of dollars and lives that would not have been incurred had the event not taken place. Insured and uninsured losses are included in damage estimates, and direct plus indirect deaths (i.e., related to the event, would not have occurred otherwise) are included in fatality totals. Economic costs are included for wide-scale, long-lasting events such as drought.
(Courtesy of National Climatic Data Center/NOAA. )
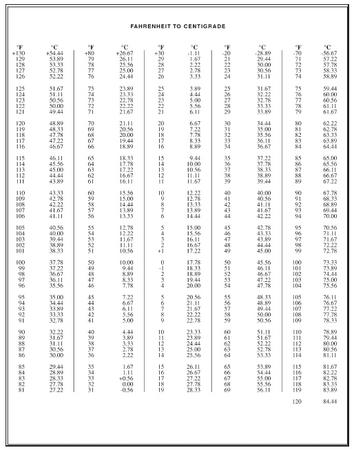
| FAHRENHEIT TO CENTIGRADE | |||||||||
| °F | °C | °F | °C | °F | °C | °F | °C | °F | °C |
| +130 | +54.44 | +80 | +26.67 | +30 | −1.11 | −20 | −28.89 | −70 | −56.67 |
| 129 | 53.89 | 79 | 26.11 | 29 | 1.67 | 21 | 29.44 | 71 | 57.22 |
| 128 | 53.33 | 78 | 25.56 | 28 | 2.22 | 22 | 30.00 | 72 | 57.78 |
| 127 | 52.78 | 77 | 25.00 | 27 | 2.78 | 23 | 30.56 | 73 | 58.33 |
| 126 | 52.22 | 76 | 24.44 | 26 | 3.33 | 24 | 31.11 | 74 | 58.89 |
| 125 | 51.67 | 75 | 23.89 | 25 | 3.89 | 25 | 31.67 | 75 | 59.44 |
| 124 | 51.11 | 74 | 23.33 | 24 | 4.44 | 26 | 32.22 | 76 | 60.00 |
| 123 | 50.56 | 73 | 22.78 | 23 | 5.00 | 27 | 32.78 | 77 | 60.56 |
| 122 | 50.00 | 72 | 22.22 | 22 | 5.56 | 28 | 33.33 | 78 | 61.11 |
| 121 | 49.44 | 71 | 21.67 | 21 | 6.11 | 29 | 33.89 | 79 | 61.67 |
| 120 | 48.89 | 70 | 21.11 | 20 | 6.67 | 30 | 34.44 | 80 | 62.22 |
| 119 | 48.33 | 69 | 20.56 | 19 | 7.22 | 31 | 35.00 | 81 | 62.78 |
| 118 | 47.78 | 68 | 20.00 | 18 | 7.78 | 32 | 35.56 | 82 | 63.33 |
| 117 | 47.22 | 67 | 19.44 | 17 | 8.33 | 33 | 36.11 | 83 | 63.89 |
| 116 | 46.67 | 66 | 18.89 | 16 | 8.89 | 34 | 36.67 | 84 | 64.44 |
| 115 | 46.11 | 65 | 18.33 | 15 | 9.44 | 35 | 37.22 | 85 | 65.00 |
| 114 | 45.56 | 64 | 17.78 | 14 | 10.00 | 36 | 37.78 | 86 | 65.56 |
| 113 | 45.00 | 63 | 17.22 | 13 | 10.56 | 37 | 38.33 | 87 | 66.11 |
| 112 | 44.44 | 62 | 16.67 | 12 | 11.11 | 38 | 38.89 | 88 | 66.67 |
| 111 | 43.89 | 61 | 16.11 | 11 | 11.67 | 39 | 39.44 | 89 | 67.22 |
| 110 | 43.33 | 60 | 15.56 | 10 | 12.22 | 40 | 40.00 | 90 | 67.78 |
| 109 | 42.78 | 59 | 15.00 | 9 | 12.78 | 41 | 40.56 | 91 | 68.33 |
| 108 | 42.22 | 58 | 14.44 | 8 | 13.33 | 42 | 41.11 | 92 | 68.89 |
| 107 | 41.67 | 57 | 13.89 | 7 | 13.89 | 43 | 41.67 | 93 | 69.44 |
| 106 | 41.11 | 56 | 13.33 | 6 | 14.44 | 44 | 42.22 | 94 | 70.00 |
| 105 | 40.56 | 55 | 12.78 | 5 | 15.00 | 45 | 42.78 | 95 | 70.56 |
| 104 | 40.00 | 54 | 12.22 | 4 | 15.56 | 46 | 43.33 | 96 | 71.11 |
| 103 | 39.44 | 53 | 11.67 | 3 | 16.11 | 47 | 43.89 | 97 | 71.67 |
| 102 | 38.89 | 52 | 11.11 | 2 | 16.67 | 48 | 44.44 | 98 | 72.22 |
| 101 | 38.33 | 51 | 10.56 | +1 | 17.22 | 49 | 45.00 | 99 | 72.78 |
| 100 | 37.78 | 50 | 10.00 | 0 | 17.78 | 50 | 45.56 | 100 | 73.33 |
| 99 | 37.22 | 49 | 9.44 | 1 | 18.33 | 51 | 46.11 | 101 | 73.89 |
| 98 | 36.67 | 48 | 8.89 | 2 | 18.89 | 52 | 46.67 | 102 | 74.44 |
| 97 | 36.11 | 47 | 8.33 | 3 | 19.44 | 53 | 47.22 | 103 | 75.00 |
| 96 | 35.56 | 46 | 7.78 | 4 | 20.00 | 54 | 47.78 | 104 | 75.56 |
| 95 | 35.00 | 45 | 7.22 | 5 | 20.56 | 55 | 48.33 | 105 | 76.11 |
| 94 | 34.44 | 44 | 6.67 | 6 | 21.11 | 56 | 48.89 | 106 | 76.67 |
| 93 | 33.89 | 43 | 6.11 | 7 | 21.67 | 57 | 49.44 | 107 | 77.22 |
| 92 | 33.33 | 42 | 5.56 | 8 | 22.22 | 58 | 50.00 | 108 | 77.78 |
| 91 | 32.78 | 41 | 5.00 | 9 | 22.78 | 59 | 50.56 | 109 | 78.33 |
| 90 | 32.22 | 40 | 4.44 | 10 | 23.33 | 60 | 51.11 | 110 | 78.89 |
| 89 | 31.67 | 39 | 3.89 | 11 | 23.89 | 61 | 51.67 | 111 | 79.44 |
| 88 | 31.11 | 38 | 3.33 | 12 | 24.44 | 62 | 52.22 | 112 | 80.00 |
| 87 | 30.56 | 37 | 2.78 | 13 | 25.00 | 63 | 52.78 | 113 | 80.56 |
| 86 | 30.00 | 36 | 2.22 | 14 | 25.56 | 64 | 53.33 | 114 | 81.11 |
| 85 | 29.44 | 35 | 1.67 | 15 | 26.11 | 65 | 53.89 | 115 | 81.67 |
| 84 | 28.89 | 34 | 1.11 | 16 | 26.67 | 66 | 54.44 | 116 | 82.22 |
| 83 | 28.33 | 33 | +0.56 | 17 | 27.22 | 67 | 55.00 | 117 | 82.78 |
| 82 | 27.78 | 32 | 0.00 | 18 | 27.78 | 68 | 55.56 | 118 | 83.33 |
| 81 | 27.22 | 31 | 0.56 | 19 | 28.33 | 69 | 56.11 | 119 | 83.89 |
| 120 | 84.44 | ||||||||

|
INCHES TO MILLIMETERS
1 inch - 25.4 millimeters |
|||||||||||||
| in | mm | in | mm | in | mm | in | mm | in | mm | in | mm | in | mm |
| 0.00 | 0.00 | 5.00 | 127.00 | 10.00 | 254.00 | 15.00 | 381.00 | 20.00 | 508.00 | 25.00 | 635.00 | 30.00 | 762.00 |
| 0.10 | 2.54 | 5.10 | 129.54 | 10.10 | 256.54 | 15.10 | 383.54 | 20.10 | 510.54 | 25.10 | 637.54 | 30.10 | 764.54 |
| 0.20 | 5.08 | 5.20 | 132.08 | 10.20 | 259.08 | 15.20 | 386.08 | 20.20 | 513.08 | 25.20 | 610.08 | 30.20 | 767.08 |
| 0.30 | 7.62 | 5.30 | 134.62 | 10.30 | 261.62 | 15.30 | 388.62 | 20.30 | 515.62 | 25.30 | 642.62 | 30.30 | 769.62 |
| 0.40 | 10.16 | 5.40 | 137.16 | 10.40 | 264.16 | 15.40 | 391.16 | 20.40 | 518.16 | 25.40 | 645.16 | 30.40 | 772.16 |
| 0.50 | 12.70 | 5.50 | 139.70 | 10.50 | 266.70 | 15.50 | 393.70 | 20.50 | 520.70 | 25.50 | 647.70 | 30.50 | 774.70 |
| 0.60 | 15.24 | 5.60 | 142.24 | 10.60 | 269.24 | 15.60 | 396.24 | 20.60 | 523.24 | 25.60 | 650.24 | 30.60 | 777.24 |
| 0.70 | 17.78 | 5.70 | 144.78 | 10.70 | 271.78 | 15.70 | 398.78 | 20.70 | 525.78 | 25.70 | 652.78 | 30.70 | 779.78 |
| 0.80 | 20.32 | 5.80 | 147.32 | 10.80 | 274.32 | 15.80 | 401.32 | 20.80 | 528.32 | 25.80 | 655.32 | 30.80 | 782.32 |
| 0.90 | 22.86 | 5.90 | 149.86 | 10.90 | 276.86 | 15.90 | 403.86 | 20.90 | 530.86 | 25.90 | 657.86 | 30.90 | 784.86 |
| 1.00 | 25.40 | 6.00 | 152.40 | 11.00 | 279.40 | 16.00 | 406.40 | 21.00 | 533.40 | 26.00 | 660.40 | 31.00 | 787.40 |
| 1.10 | 27.94 | 6.10 | 154.94 | 11.10 | 281.94 | 16.10 | 408.94 | 21.10 | 535.94 | 26.10 | 662.94 | 31.10 | 789.94 |
| 1.20 | 30.48 | 6.20 | 157.48 | 11.20 | 284.48 | 16.20 | 411.48 | 21.20 | 538.48 | 26.20 | 665.48 | 31.20 | 792.48 |
| 1.30 | 33.02 | 6.30 | 160.02 | 11.30 | 287.02 | 16.30 | 414.02 | 21.30 | 541.02 | 26.30 | 668.02 | 31.30 | 795.02 |
| 1.40 | 35.56 | 6.40 | 162.56 | 11.40 | 289.56 | 16.40 | 416.56 | 21.40 | 543.56 | 26.40 | 670.56 | 31.40 | 797.56 |
| 1.50 | 38.10 | 6.50 | 165.10 | 11.50 | 292.10 | 16.50 | 419.10 | 21.50 | 546.10 | 26.50 | 673.10 | 31.50 | 800.10 |
| 1.60 | 40.64 | 6.60 | 167.64 | 11.60 | 294.64 | 16.60 | 421.64 | 21.60 | 548.64 | 26.60 | 675.64 | 31.60 | 802.64 |
| 1.70 | 43.18 | 6.70 | 170.18 | 11.70 | 297.18 | 16.70 | 424.18 | 21.70 | 551.18 | 26.70 | 678.18 | 31.70 | 805.18 |
| 1.80 | 45.72 | 6.80 | 172.72 | 11.80 | 299.72 | 16.80 | 426.72 | 21.80 | 553.72 | 26.80 | 680.72 | 31.80 | 807.72 |
| 1.90 | 48.26 | 6.90 | 175.26 | 11.90 | 302.26 | 16.90 | 429.26 | 21.90 | 556.26 | 26.90 | 683.26 | 31.90 | 810.26 |
| 2.00 | 50.80 | 7.00 | 177.80 | 12.00 | 304.80 | 17.00 | 431.80 | 22.00 | 558.80 | 27.00 | 685.80 | ||
| 2.10 | 53.34 | 7.10 | 180.34 | 12.10 | 307.34 | 17.10 | 434.34 | 22.10 | 561.34 | 27.10 | 688.34 | ||
| 2.20 | 55.88 | 7.20 | 182.88 | 12.20 | 309.88 | 17.20 | 436.88 | 22.20 | 563.88 | 27.20 | 690.88 | ||
| 2.30 | 58.42 | 7.30 | 185.42 | 12.30 | 312.42 | 17.30 | 439.42 | 22.30 | 566.42 | 27.30 | 693.42 | ||
| 2.40 | 60.96 | 7.40 | 187.96 | 12.40 | 314.96 | 17.40 | 441.96 | 22.40 | 568.96 | 27.40 | 695.96 | ||
| 2.50 | 63.50 | 7.50 | 190.50 | 12.50 | 317.50 | 17.50 | 444.50 | 22.50 | 571.50 | 27.50 | 698.50 | ||
| 2.60 | 66.04 | 7.60 | 193.04 | 12.60 | 320.04 | 17.60 | 447.04 | 22.60 | 574.04 | 27.60 | 701.04 | ||
| 2.70 | 68.58 | 7.70 | 195.58 | 12.70 | 322.58 | 17.70 | 449.58 | 22.70 | 576.58 | 27.70 | 703.58 | ||
| 2.80 | 71.12 | 7.80 | 198.12 | 12.80 | 325.12 | 17.80 | 452.12 | 22.80 | 579.12 | 27.80 | 706.12 | ||
| 2.90 | 73.66 | 7.90 | 200.66 | 12.90 | 327.66 | 17.90 | 454.66 | 22.90 | 581.66 | 27.90 | 708.66 | ||
| 3.00 | 76.20 | 8.00 | 203.20 | 13.00 | 330.20 | 18.00 | 457.20 | 23.00 | 584.20 | 28.00 | 711.20 | ||
| 3.10 | 78.74 | 8.10 | 205.74 | 13.10 | 332.74 | 18.10 | 459.74 | 23.10 | 586.74 | 28.10 | 713.74 | ||
| 3.20 | 81.28 | 8.20 | 208.28 | 13.20 | 335.28 | 18.20 | 462.28 | 23.20 | 589.28 | 28.20 | 716.28 | ||
| 3.30 | 83.82 | 8.30 | 210.82 | 13.30 | 337.82 | 18.30 | 464.82 | 23.30 | 591.82 | 28.30 | 718.82 | ||
| 3.40 | 86.36 | 8.40 | 213.36 | 13.40 | 340.36 | 18.40 | 467.36 | 23.40 | 594.36 | 28.40 | 721.36 | ||
| 3.50 | 88.90 | 8.50 | 215.90 | 13.50 | 342.90 | 18.50 | 469.90 | 23.50 | 596.90 | 28.50 | 723.90 | ||
| 3.60 | 91.41 | 8.60 | 218.44 | 13.60 | 345.44 | 18.60 | 472.44 | 23.60 | 599.44 | 28.60 | 726.44 | ||
| 3.70 | 93.98 | 8.70 | 220.98 | 13.70 | 347.98 | 18.70 | 474.98 | 23.70 | 601.98 | 28.70 | 728.98 | ||
| 3.80 | 96.52 | 8.80 | 223.52 | 13.80 | 350.52 | 18.80 | 477.52 | 23.80 | 604.52 | 28.80 | 731.52 | ||
| 3.90 | 99.06 | 8.90 | 226.06 | 13.90 | 353.06 | 18.90 | 480.06 | 23.90 | 607.06 | 28.90 | 734.06 | ||
| 4.00 | 101.60 | 9.00 | 228.60 | 14.00 | 355.60 | 19.00 | 482.60 | 24.00 | 609.60 | 29.00 | 736.60 | ||
| 4.10 | 104.14 | 9.10 | 231.14 | 14.10 | 358.14 | 19.10 | 485.14 | 24.10 | 612.14 | 29.10 | 739.14 | ||
| 4.20 | 106.68 | 9.20 | 233.68 | 14.20 | 360.68 | 19.20 | 487.68 | 24.20 | 614.68 | 29.20 | 741.68 | ||
| 4.30 | 109.22 | 9.30 | 236.22 | 14.30 | 363.22 | 19.30 | 490.22 | 24.30 | 617.22 | 29.30 | 744.22 | ||
| 4.40 | 111.76 | 9.40 | 238.76 | 14.40 | 365.76 | 19.40 | 492.76 | 24.40 | 619.76 | 29.40 | 746.76 | ||
| 4.50 | 114.30 | 9.50 | 241.30 | 14.50 | 368.30 | 19.50 | 495.30 | 24.50 | 622.30 | 29.50 | 749.30 | ||
| 4.60 | 116.84 | 9.60 | 243.84 | 14.60 | 370.84 | 19.60 | 497.84 | 24.60 | 624.84 | 29.60 | 751.84 | ||
| 4.70 | 119.38 | 9.70 | 246.38 | 14.70 | 373.38 | 19.70 | 500.38 | 24.70 | 627.38 | 29.70 | 754.38 | ||
| 4.80 | 121.92 | 9.80 | 248.92 | 14.80 | 375.92 | 19.80 | 502.92 | 24.80 | 629.92 | 29.80 | 756.92 | ||
| 4.90 | 124.46 | 9.90 | 251.46 | 14.90 | 378.46 | 19.90 | 505.46 | 24.90 | 632.46 | 29.90 | 759.46 | ||
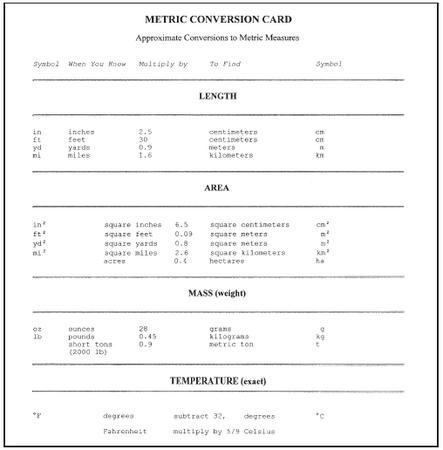
| METRIC CONVERSION CARD | ||||
| Approximate Conversions to Metric Measures | ||||
| Symbol | When You Know | Multiply by | To Find | Symbol |
| LENGTH | ||||
| in | inches | 2.5 | centimeters | cm |
| ft | feet | 30 | centimeters | cm |
| yd | yards | 3.9 | meters | m |
| mi | miles | 3.6 | kilometers | km |
| AREA | ||||
| in 2 | square inches | 6.5 | square centimeters | cm 2 |
| ft 2 | square feet | 0.09 | square meters | m 2 |
| yd 2 | square yards | 0.8 | square meters | m 2 |
| mi 2 | square miles | 2.6 | square kilometers | km 2 |
| acres | 0.4 | hectares | ha | |
| MASS (weight) | ||||
| oz | ounces | 26 | grams | g |
| lb | pounds | 0.45 | kilograms | kg |
| short tons (2000 lb) | 0.9 | metric ton | t | |
| TEMPERATURE (exact) | ||||
| °F | degrees | subtract 32, | degrees | °C |
| Fehrenheit | multiply by 6/9 | Celsius | ||
|
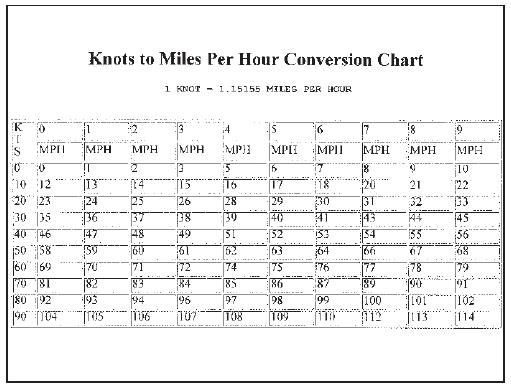
Knots to Miles Per Hour Conversion Chart
1 KNOT = 1.15155 MILES PER HOUR |
||||||||||
| KTS | 0 | 1 | 2 | 3 | 4 | 5 | 6 | 7 | 8 | 9 |
| MPH | MPH | MPH | MPH | MPH | MPH | MPH | MPH | MPH | MPH | |
| 0 | 0 | 1 | 2 | 3 | 5 | 6 | 7 | 8 | 9 | 10 |
| 10 | 12 | 13 | 14 | 15 | 16 | 17 | 18 | 20 | 21 | 22 |
| 20 | 23 | 24 | 25 | 26 | 28 | 29 | 30 | 31 | 32 | 33 |
| 30 | 35 | 36 | 37 | 38 | 39 | 40 | 41 | 43 | 44 | 45 |
| 40 | 46 | 47 | 48 | 49 | 51 | 52 | 53 | 54 | 55 | 56 |
| 50 | 58 | 59 | 60 | 61 | 62 | 63 | 64 | 66 | 67 | 68 |
| 60 | 69 | 70 | 71 | 72 | 74 | 75 | 76 | 77 | 78 | 79 |
| 70 | 81 | 82 | 83 | 84 | 85 | 86 | 87 | 89 | 90 | 91 |
| 80 | 92 | 93 | 94 | 96 | 97 | 98 | 99 | 100 | 101 | 102 |
| 90 | 104 | 105 | 106 | 107 | 108 | 109 | 110 | 112 | 113 | 114 |
Comment about this article, ask questions, or add new information about this topic: