Summary of 2002 Weather
REVIEW OF U.S. EVENTS FOR 2002
January 2002. Moderate to heavy snows hit parts of Georgia, the Carolinas, and Virginia during the first week of January. Also, on the southeastern periphery of the snow, sleet and freezing rain fell, resulting in over 60,000 power outages. The hardest hit areas were in eastern North Carolina where 14 inches of snow were reported in parts of Nash, Halifax, Montgomery, Vance, Granville, and Person counties.
Interior Maine received heavy snows on the 15th and 16th of the month as a storm system moved across the area. Maine received a wide range of snowfall totals with one inch in the Princeton area to as high as 17 inches in Bucksport. This followed an earlier storm that rapidly deepened off the coast around the 13th of the month bringing heavy rains to coastal areas and over a foot of snow to down east Maine.
On the 29th, record rainfall fell at several Hawaii recording stations and severe storms caused millions of dollars in flood damage. The Hilo airport shattered their January 24-hour rainfall record of 9.51 inches. The new record is 12.47 inches.
A powerful late-January storm brought ice and heavy snows across the Plains, Great Lakes, and into New England. Heavy snow and freezing rain stranded airline passengers, shut down schools, and left thousands without electricity across the Midwest. The storm had dumped about a foot of snow in parts of Iowa and northern Illinois including the Chicago area. In Oklahoma, entire cities were without power, as heavy ice toppled trees and downed power lines. More than a foot of snow fell across New Mexico's high country. At least 15 people died in traffic accidents that were blamed on the weather.
February 2002. Farther south, a winter storm brought snowfall to portions of Texas, east Arkansas, north Mississippi, and west Tennessee on the 5th and 6th. Searcy and Polk Counties in Arkansas reported up to seven inches of snow. During a storm in the northern Plains on the 9th, blowing snow cut visibility nearly to zero and shut down hundreds of miles of major highways. Up to two feet of snow fell in the Black Hills of eastern Wyoming.
For the month of February, Marquette, Michigan, set a new all-time monthly snowfall record of 91.9 inches. The previous record was 91.7 inches in January 1997. The new record far surpassed the old February record of 63.6 inches set in 1995.
March 2002. A snowstorm that swept from Texas to Michigan was responsible for 21 deaths, according to media reports. On the 2nd, sleet, snow, and freezing rain contributed to more than 500 traffic accidents and about 100 cancelled flights at Dallas–Fort Worth International Airport.
The National Guard was called in to help evacuate residents affected by a storm that damaged or destroyed at least 250 homes in the worst flooding to hit eastern Kentucky in 25 years. At least seven deaths in Tennessee were also blamed on the storm, which dumped as much as six to eight inches of rain.
Anchorage, Alaska, received 28.6 inches of snow on the 16th and 17th. This far surpasses the previous snowfall record—15.6 inches—set on December 29, 1955. The snow fell at a rate of up to two inches per hour for much of the 16th, and schools were closed and flights canceled as a result of the storm.
Snow continued to fall through the end of March in Marquette, Michigan, leading to a seasonal total of over 300 inches. This surpassed the old seasonal snowfall record by 28 inches. Warmer than normal water in the Great Lakes enabled lake-effect snows to persist through late winter.
April 2002. On the 15th, temperatures soared into the mid to upper 90s in Nebraska. Temperatures were above 90°F in Omaha and reached 97°F at McCook, Nebraska. Temperatures were also high in parts of Kansas, northwest Missouri, western Iowa, and southwest Minnesota. The temperature reached 91°F in the St. Paul/Minneapolis area, breaking the old daily record of 82°F set in 1915 (which was equaled in 1976). This was the earliest in April that 90°F or higher was recorded. At the beginning of April 2002, there were four to seven inches of snow on the ground.
A spring storm on the 28th in the Tennessee and Ohio Valleys caused tornadoes, high wind, and hail. The storm then moved eastward causing additional damage and spawning killer tornadoes. The tornadoes were part of powerful storms carrying heavy rain and snow. On the system's

northern edge, up to 20 inches of snow fell overnight in Wisconsin. More than 40,000 people were without power in northern Wisconsin on the 28th and wet snow contributed to four traffic deaths in Minnesota. In Maryland, a powerful tornado killed three people and leveled parts of La Plata, a small town 25 miles south of Washington, D.C. In Kentucky and Illinois, tornadoes caused one death in each state. In Tennessee, a tornado injured 18 people 30 miles southeast of Nashville, and a tornado touched down in Ohio and caused widespread damage.
May 2002. Tug Fork River, which separates West Virginia and Kentucky, crested at nearly 20ft above flood stage on Friday, May 3, and led to the deaths of at least six people. Heavy rains on Tuesday, May 7, in western Indiana caused riverbanks to burst and prompted evacuations. Flash flooding also led to evacuations in south-central Ohio. Storms battered central West Virginia, killing at least one person and stranding approximately two-dozen people at a campground. In Webster County, West Virginia, 2,000 structures were damaged and 197 homes destroyed. At least two people died in the floods in Virginia. Four counties in West Virginia (McDowell, Mercer, Mingo, and Wyoming) and two in Virginia (Buchanan and Tazewell) were declared disaster areas by President George W. Bush. Hundreds of homes and other structures were also damaged and destroyed in Kentucky and more than 1,000 residents were evacuated from Kentucky and western Virginia.
A tornado swept through Happy, Texas, on the night of May 5, 2002. The tornado killed at least two people and injured others. The tornado was one of at least six reported in the state on the 5th. Happy, Texas, is located about 30 miles (48 km) south of Amarillo.
Drought intensified in much of the eastern U.S. during the month of May 2002.
June 2002. Heavy rain and flooding occurred in the upper Midwest on the 9th and 10th. Rainfall totals during the 48 hours beginning in the early morning of June 9 exceeded six inches in a broad area of northern Minnesota. However, local totals far exceeded 12 inches (305 mm) in places such as Roseau, Lake of the Woods, and Koochiching counties. Additional rainfall later in the month compounded flood problems in northern Minnesota.
By the end of June, nearly 2.8 million acres had been burned by wildfires in the U.S. This is over two-and-half times the 10-year average. Fires in Arizona burned over 550,000 acres and destroyed at least 400 homes. Separate fires near Durango and Denver, Colorado, consumed 70,000 and 140,000 acres respectively by the end of June, destroying dozens of homes. The latter (the Hayman Fire) was the largest fire in Colorado's history and prompted President George W. Bush to declare the area south of Denver a disaster area.
July 2002. During the first week of July, major flooding occurred in parts of Texas due to region-wide accumulations of 5 to 15 inches of rainfall in the San Antonio/Austin area. San Antonio airport received over 9.5 inches of rain on the 1st and over 10 inches on the 2nd. Around two dozen counties were declared disaster areas and costs from the flooding were in the hundreds of millions of dollars. At least nine deaths were attributed to the disaster. Additional rain fell in the middle of the month across parts of Texas adding to flooding problems and preventing rivers from receding.
During July 6–14, a heat wave affected the western United States, where numerous all-time high temperature records were broken. On July 13, Death Valley, California, recorded a high temperature of 127°F with a low of 100°F(37.8°C), or a mean temperature of 113.5°F. This is the second-warmest mean temperature at Death Valley since records began at the current station in 1961. Drought conditions intensified across parts of the Southeast, the High Plains, and much of the West during July 2002.
August 2002. Monmouth County, New Jersey, declared a state of emergency after storms ripped through the area on the 2nd. High winds and lightning damaged homes and property and left emergency crews clearing debris from roads and restoring power to around 140,000 homes.
In North Carolina on the evening of the 25th, up to eight inches of rain fell in the area north and east of Raleigh. This led to flash flooding in several counties along with some road closures. Heavy rain continued across eastern North Carolina through the 26th and 27th.
On the 2nd, a tornado ripped through the town of Lady-smith, in northwestern Wisconsin. A few dozen injuries were reported and significant structural damage occurred in the town of 4,000 residents.
The remnants of Tropical Storm Fay dumped heavy rains and spawned tornadoes on the 7th, as the storm moved inland over Texas. Up to a foot of rain fell in Freeport and
West Columbia, in coastal Brazoria County and five to eight inches were reported in Matagorda and Wharton counties.
The remnants of tropical storm Hanna brought heavy rain to much of the eastern third of the United States on the 13th and 15th, stretching from the Gulf Coast to the mid-Atlantic. Rainfall spread from the Florida Panhandle northward across the Appalachians into the Ohio Valley and the Northeast, with flash flooding reported in scattered parts of Georgia, South Carolina, and Florida. This storm brought much needed rains to parts of the Southeast that had been suffering from extended drought conditions. Two- to five-inch rainfall amounts were common across portions of western Florida, Georgia, and the Carolinas.
Thunderstorms preceding a strong cold front brought severe weather and tornadoes on the 20th to areas of Ohio and Indiana. Of at least 50 homes that were destroyed in Indiana, 20 of those were in the town of Martinsville, where a tornado struck. According to the state emergency management agency, this was the worst outbreak of severe weather in Indiana since June 1990.
October 2002. On October 3, Hurricane Lili came ashore in western Louisiana bringing additional rain to areas already affected by Tropical Storm Isidore in September. More rainfall later in October made this the second-wettest October on record for Louisiana and Texas. Further details on flooding and rainfall in the Southeast and parts of the Gulf Coast are given on the Atlantic Hurricane Season summary page.
Severe weather occurred in south Texas on October 24, as thunderstorms produced tornadoes that caused one fatality and 14 injuries in the Corpus Christi area. Storm damage in the city was estimated as high as $100 million, and Texas Governor Rick Perry declared Nueces County a disaster area.
An intrusion of Arctic air produced record-low temperatures across parts of the upper Midwest during the last week of October. Williston, North Dakota, dropped to –9°F on October 30, which is the coldest low temperature ever recorded during the month of October at Williston.
It was the warmest October in Alaska since 1938, and only the 8th time on record that Anchorage had no snow during the month.
November 2002. A major outbreak of severe weather and tornadoes occurred across the Tennessee and Ohio valley region on the 10th and 11th, producing damage in 13 states. A total of 75 tornadoes touched down on the 10th, resulting in at least 36 deaths. A tornado rated as F-4 on the Fujita Scale struck Van Wert county in Ohio. In Tennessee, the community of Mossy Grove was nearly destroyed by a mile-wide tornado that claimed 12 lives.
Severe to exceptional drought continued throughout much of the western United States. Two months of above-average precipitation in the eastern U.S. brought significant relief to long-term drought conditions.
December 2002. A significant snow and ice storm affected much of the eastern half of the United States during the 3rd through the 5th. In the Carolinas, electric utilities provider Duke Power characterized the ice storm as the worst in the company's history, with 1.2 million customers or nearly half its entire customer base without power on the morning of the 5th. This surpassed electrical outages inflicted by Hurricane Hugo as it swept through the central Carolinas in September 1989.
A strong Pacific storm struck the west coast of the United States at the beginning of the third week of the month with very heavy rains and strong hurricane-force winds. As many as two million homes were without power in California. At least 13 people lost their lives during this storm, which may have been a portion of the Super Typhoon Pongsona that struck Guam on December 8, 2002; it arrived along the west coast of the United States a week later and produced tornadoes in the midwest several days later. It might be that the ex-typhoon got caught and absorbed by a large longitudinal trough that migrated to the west coast then to the south and southeast states. During a 120-hour period ending on December 18, rainfall topped 20 inches at a few locations in California's Shasta Mountains, including Clear Creek (21.04 inches) and Brandy Creek (20.76 inches). Sierra Nevada snowfall during the same 5-day period reached or exceeded 100 inches at Kirkwood and several other sites. Flagstaff, Arizona, noted a daily record amount of 7.2 inches of snow on December 18 en route to a storm-snowfall of 11.8 inches. Yuma, Arizona, received 0.03 inch of rain on December 20, 2002, their first measurable precipitation since December 4, 2001.
Atlantic Hurricanes. There were 12 named tropical storms in 2002, four of which became hurricanes with two reaching major hurricane strength (categories three to five on the Saffir-Simpson Scale). On average, 10 named storms form with six growing to hurricane strength and two developing into major hurricanes. While there were more tropical storms than average, there were fewer strong storms in 2002. The development of an El Niño in the Eastern Equatorial Pacific led to the suppression of strong storms in 2002, and overall activity is considered somewhat lower than average for the season. However, seven storms made landfall in the U.S., which is the most since 1998.
Snow Season. Overall, the North American snow season for 2001–2002 was below average. However, due to above average warmth over the Great Lakes during the winter, the lakes remained largely unfrozen and provided ample moisture to fuel lake effect snowfall. Marquette, on Michigan's Upper Peninsula, received record seasonal snowfall amounts, and in Buffalo, New York, the monthly snowfall record was broken when more than 80 inches of snow fell between the 24th and 28th of December 2001. Elsewhere, the snow pack was mostly light and the lack of spring melt water from the snow added to the water shortages in much of the western U.S.
Drought—2002
The incidence of drought in the United States has varied greatly over the past century. From the dust bowl years of the 1930s to the major droughts of 1988 and 2000, much of the U.S. has suffered from the effects of drought during the past century. While annual and seasonal precipitation totals have generally increased in the United States since 1900, severe drought episodes continue to occur.
The nation's most devastating drought occurred in the 1930s during what many refer to as the "Dust Bowl" years. The drought affected almost the entire Plains and covered more than 60% of the U.S. during its peak in July 1934. It had a devastating economic impact and caused the migration of millions of people from the Plains to other parts of the country, many to the western U.S. Although the nation has not since experienced a drought as severe as the drought of the 1930s, subsequent droughts (e.g., those of the 1950s, 1988, and 2000) have also had serious economic and societal consequences.
Although a variety of weather-related phenomena have the potential to cause great economic and personal losses, in the U.S. it is drought that has historically had the greatest impact on the largest number of people. Since 1980, 48 weather-related disasters have each caused at least 1 billion dollars in economic losses. Of these 48 disasters, the greatest losses have been attributed to drought. Economic losses exceeded 40 billion dollars in the droughts of 1980 and 1988, and the combination of drought and heat-related deaths totaled more than 5,000 in each event. The drought of 2000 resulted in losses of 4 billion dollars and 140 deaths.
Although not as widespread as the droughts of the 1930s and 1950s, persistent above-normal temperatures and below-normal precipitation across much of the western and southern U.S. in 1999 and 2000 brought drought to these regions by the summer of 2000. More than one third of the country suffered from severe to extreme drought by August, leading to heavy agricultural losses, water rationing for many, and one of the worst wildfire seasons in the last 50 years. While some parts of the nation have received drought-ending precipitation since that time, parts of the nation continue to suffer from severe precipitation deficits through the spring season of 2001.
Defining Drought
The wide variety of disciplines affected by drought, its diverse geographical and temporal distribution, and the many scales that it operates on make it difficult to develop both a definition to describe drought and an index to measure it. Common to all types of drought is the fact that they originate from a deficiency of precipitation resulting from an unusual weather pattern. If the weather pattern lasts a short time (e.g., a few weeks or a couple of months), the drought is considered short-term. But if the weather or atmospheric circulation pattern becomes entrenched and the precipitation deficits last for several months to several years, the drought is described as long-term.
Many quantitative measures of drought have been developed in the United States, depending on the discipline affected, the region being considered, and the particular application. The most frequently used indicators of drought are those developed by Wayne Palmer in the 1960s. These include the Palmer Drought Severity Index (PDSI), the Palmer Hydrological Drought Index (PHDI), the Palmer Z Index, and the Crop Moisture Index (CMI). These indices have been used in countless research studies as well as in operational drought monitoring during the past 35 years. The Palmer drought index has proven to provide one of the best indications of drought for much of the United States. It is superior to other drought indices in many respects because it accounts not only for precipitation totals but also for temperature, evapotranspiration, soil runoff, and soil recharge.
The Z Index measures short-term drought on a monthly scale. The CMI measures short-term agricultural drought on a weekly scale. The PDSI measures drought duration and the intensity of long-term drought-inducing circulation patterns; it responds fairly quickly to meteorological patterns that often change rapidly from one regime to another. A measure of the hydrological impacts of drought, the PHDI measures the long-term effects of drought on systems affected by long-term precipitation deficits. These effects, such as reservoir levels, groundwater levels, etc., take longer to develop, and more time is needed to recover from them. It is from this index, the PHDI, that we calculate the precipitation amounts and probabilities of ending or ameliorating drought.
The Amount of Precipitation Needed to End a Drought (Based on the PHDI)
Because of the far-reaching societal and economic impacts of drought, there is considerable interest in determining 1) how much precipitation is required to end a drought, and 2) the probability that a region will receive the necessary amount of precipitation. Ending a hydrological drought requires that the moisture needs associated with recharge, demand, and run off have been brought back to normal or above normal.
Many factors affect the quantity of precipitation required to end or ameliorate (reduce the severity of) a drought. Knowledge of the severity of the drought, as defined by the Palmer Hydrological Drought Index (PHDI), is the essential starting point for determining the needed precipitation. The typical conditions that a region experiences during each month and season of the year (i.e., that region's climatology) is also essential. Given droughts of equal magnitude in dry and wet climates, the wetter region requires more precipitation to end the drought.
The season in which the precipitation falls can also greatly influence the quantity of precipitation required to end a drought. During a typically moist month (such as those experienced in the winter and spring along the West Coast) more precipitation may be required to end a drought than during the typically dry months of the summer. Because soil moisture conditions are generally lower in the dry months, the precipitation needed to bring soil conditions back to normal may be less than that required to return soil moisture conditions to normal during a generally wetter season. Nevertheless, regardless of a region's climate, a long period of near-normal precipitation is often sufficient for ending a drought with moisture conditions gradually returning to normal.
However, the quantity of precipitation needed to end a drought says nothing about the probability that a region will actually receive that amount of precipitation. A region, such as the West Coast, that does not typically experience excessively heavy precipitation during the summer season, may be less likely to receive a quantity sufficient for ending a drought than a region that has a record of experiencing extreme precipitation events during the same season. The months that have the greatest probability of receiving substantially more precipitation than normal would be those with precipitation distributions with the largest positive skew (that is, those subject to more extreme precipitation events), not necessarily those months that normally receive the greatest amount of precipitation.
The technical details associated with the calculation of precipitation totals needed to end or ameliorate drought and the probability of receiving the required precipitation can be found in Drought Termination and Amelioration: Its Climatological Probability, by Tom Karl, et al. 1987.
Maps of Precipitation Totals and Probability
More than 2,000 maps of the contiguous U.S. are provided that show the precipitation totals needed to end or ameliorate drought from periods of one month to six months based on PHDI values from –2 to –6. These data were calculated for each month of the year and include precipitation values for each of the 344 contiguous U.S. climate divisions. The end of a drought is defined by a PHDI value of –0.5, while drought amelioration is achieved when a PHDI value of –2.0 is reached. Maps showing the probability of receiving the necessary amount of precipitation are also provided.
Maps of precipitation needed to end or ameliorate a drought for those divisions currently experiencing drought are also available. Values are provided in all divisions with a monthly PHDI less than –2.0. Precipitation needed over
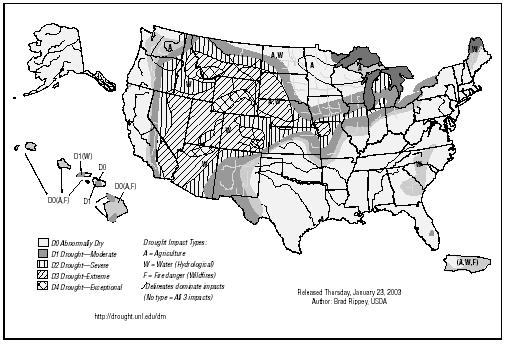
periods from one month to six months is included as well as the associated probability of receiving that quantity of precipitation. These maps are replaced on a monthly basis with the values reflecting conditions in the previous month. Maps are available from the National Climatic Data Center in Asheville, North Carolina.
A severe dry spell has its grasp on the Northwest
It has been five years since Portland has seen a late-year dry spell this severe. October and November, 2002, which mark the beginning of a 12-month cycle known as the water year, have been drier only three times in 64 years of record keeping.
The inland Northwest, much of it devoted to agriculture and ranching, also is parched. Precipitation in the two months across the Columbia River Basin east of the Dalles, a region making up much of Oregon, Washington, Idaho, and Montana, was about 50 percent below normal. That could hurt irrigators. 2001 posted a near-record drought and saw, as a result, huge rate increases for hydroelectric power sold by the Bonneville Power Administration, which sharply cut water availability to eastern Oregon farmers.
Of the 75 river-gauging stations in Oregon operated by U.S. Geological Survey, 67 percent are reporting below-normal flows. The low flows are delaying the migration of salmon. Portland's drinking-water reservoirs on Bull Run, typically full this time of year, were 62 percent below capacity recently. Portland has back-up wells, so the city's water managers said they expect no water restrictions next year.
WINTER STORMS
Southeastern U.S. Ice Storm of December 2002
Some million-and-a-half homes were without power several days after the December 4 and 5, 2002 storm that moved from the southwestern U.S. to the eastern seaboard in about 48 hours. An armada of cherry-pickers helped to restore power to nearly 1.5 million people in the ice-coasted Carolinas. Six to eight inches or more of snow coated the mid-Atlantic region from Washington, D.C., northeastward into New England.
TEMPERATURES—HEAT AND HUMIDITY
Global Temperatures for 2002
Global temperatures in 2002 were 1.01°F above the long-term (1880–2001) average, which will place 2002 as the second warmest year on record. The only warmer year was 1998 in which a strong El Niño contributed to higher global temperatures. Land temperatures were 1.57°F above average and ocean temperatures 0.76°F above the 1880–2001 mean. Both land and ocean temperature ranks as second warmest on record.
Neutral ENSO conditions at the beginning of 2002 gave way to a strengthening El Niño episode during late boreal summer and continuing into early winter. Moderate positive anomalies of equatorial Pacific sea surface temperatures (El Niño conditions) were expected to persist through the early part of 2003.
The Northern Hemisphere temperature averaged near record levels in 2002 at 1.13°F above the long-term average. The Southern Hemisphere also reflected the globally warmer conditions, with a positive anomaly near 0.83°F.
In 2002 warmer temperatures and shifts in atmospheric circulation patterns contributed to the greatest surface melt on the Greenland Ice Sheet in the 24-year satellite record. There was also a record low level of Arctic sea ice extant in September, the lowest since satellite monitoring began in 1978, according to the National Snow and Ice Data Center.
Annual anomalies in excess of 1.8°F were widespread across much of North America and Asia.
The 1880–2001 average combined land and ocean annual temperature is 56.9°F, the annually averaged land temperature for the same period is 47.3°F, and the long-term annually averaged sea surface temperature is 60.9°F.
TEMPERATURE TRENDS
During the past century, global surface temperatures have increased at a rate near 1.1°F per century, but this trend has dramatically increased to a rate approaching 3.6°F per century during the past 25 years. There have been two sustained periods of warming, one beginning around 1910 and ending around 1945, and the most recent beginning about 1976. Temperatures during the latter period of warming have increased at a rate comparable to the rates of warming projected to occur during the next century, with continued increases of anthropogenic greenhouse gases.
Data collected by NOAA's polar orbiting satellites and analyzed for NOAA by the University of Alabama in Huntsville (UAH) and Remote Sensing Systems (RSS, Santa Rosa, California) indicate that temperatures centered in the middle troposphere at altitudes from two to six miles make 2002 the second warmest year for the globe.
The average lower troposphere temperature (surface to about five miles) for 2002 was second warmest on record.
Analysis of the satellite record that began in 1979 shows that the global average temperature in the middle troposphere has increased, but the differing analysis techniques of the two teams result in different trends. The UAH team found an increase of 0.06°F per decade, while a trend of 0.21°F per decade was found by the RSS team. This compares to surface temperature increases approaching 0.3°F per decade during the same period.
While lower tropospheric temperatures as measured by the MSU indicate increasing temperatures over the last two decades, stratospheric (nine to 14 miles) temperatures have been decreasing. This is consistent with the depletion of ozone in the lower stratosphere. The large increase in 1982 was caused by the volcanic eruption of El Chichon, and the increase in 1991 was caused by the eruption of Mt. Pinatubo in the Philippines.
United States Temperatures for 2002
2002 ranked as the 14th warmest year on record for the U.S., with an estimated preliminary temperature of 53.9°F, which is 1.1°F above the long-term average. After beginning the year with much above average warmth, especially in the northeast, 2002 ended with cooler-than-normal to near-average temperatures across much of the nation.
The 2001–2002 winter season (December–February) was ninth warmest on record for the U.S., with much of the warmth occurring in the northeast, which had its warmest winter on record. Spring (March–May) was near normal nationally with a warmer than average April compensating for a cooler March and May. However, the summer season (June–August) was one of the warmest in 108 years of national records. Summer 2002 was tied (with 1988) for 3rd warmest behind only 1936 and 1934. The 2002 fall season was near average, though September was the 7th warmest such month on record, followed by a cool October and near-average November.
The last three 5-year periods (1998–2002, 1997–2001, 1996–2000), have been the warmest 5-year periods in the last 108 years of national records, and the last 6 (1997–2002), 7 (1996–2002), 8 (1995–2002), 9 (1994–2002) and 10-year (1993–2002) periods have been the warmest on record for the U.S., illustrating the near persistent warmth of the last decade.
A tenth or more of the country averaged very warm for 8 months of the year, with 2 months, April and July, each exceeding 30 percent above average. More than 10 percent of the country was very cold in March and May, and more than a third of the country was very cold in October. Very warm and very cold conditions are defined as the warmest and coldest ten percent of recorded temperatures, respectively.
2002 was fourth warmest on record for Delaware, Maryland, and New Jersey. Nine other states were much warmer than normal during 2002. No state in the contiguous U.S. has averaged below normal for the year.
Annual temperatures averaged across the state of Alaska reached record levels for 2002, with every season in Alaska averaging above normal. Fall 2002 was the warmest September–November on record for the state. Nine states in the northeast and midwest had their warmest winters on record, and the southwest region had its warmest summer on record. Three states (Colorado, Maryland, and Delaware) also broke summer warmth records.
Data collected by NOAA's TIROS-N polar-orbiting satellites (adjusted for time-dependent biases by NASA and the Global Hydrology and Climate Center at the University of Alabama in Huntsville) indicate that temperatures in the lower half of the atmosphere (the lowest 8 km) were above the 20-year (1979–1998) average for 2002 for the fifth consecutive year and ranked as the eighth warmest such period since 1979.
THUNDERSTORMS
Thunderstorms around the World and in the United States
Meteorologists estimate that, at any given moment, some 1,800 thunderstorms are in progress over Earth's surface, and about 18 million a year around the world. It is estimated that approximately 100,000 to 125,000 thunderstorms occur in the United States each year. Of that total anywhere from 10 to 20 percent may be severe. The National Weather Service considers a thunderstorm severe if it produces hail at least three-quarters of an inch in diameter, winds of 58 mph or stronger, or a tornado. From 1996 to 2001, a total of 134,005 severe thunderstorms were recorded (not associated with tornadoes), an average of 19,144 annually. The frequency with which these giant generators of local weather occur, along with the quantity of energy they release and the variety of forms this energy can take, make thunderstorms great destroyers of life and property.
TORNADOES
Tornadoes of 2002
A line of thunderstorms that extended a thousand miles produced an unofficial 70 tornadoes from southern Mississippi to northern Ohio; at least 35 people were killed and more than 200 were injured. These 35 fatalities were the most since the May 3, 1999, tornado outbreak in Oklahoma and Kansas. There were at least 16 deaths in Tennessee; 12 deaths in Alabama; 5 deaths in Ohio; and 1 death each in Mississippi and Pennsylvania. This outbreak occurred in November 2002.
There were 21 very strong to violent tornadoes (wind speeds in excess of 158 mph, category F3-F5) during the 2002 tornado season (March-August). This is well below 2002 tornado season (March-August). This is well below the long-term (1950-2001) mean of 38 and is the third consecutive season of much-below-normal activity. No trends have been observed since 1950 in very strong to violent tornadoes. Although the season was below average, there were several notable storm outbreaks in 2002, including the F4 that touched down in Maryland on April 28, the Corpus Christi (Texas) tornado in October, and the November outbreak in the Tennessee and Ohio valley region.
HURRICANES
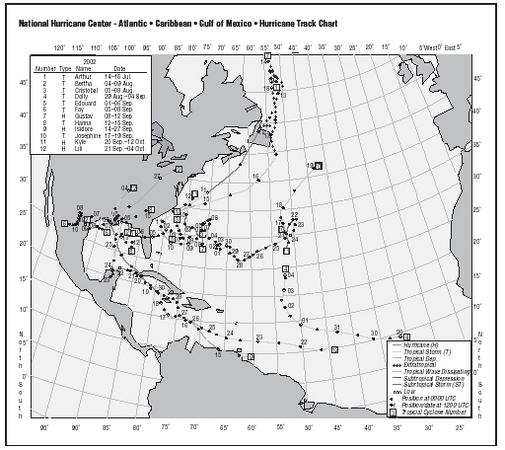
2002 Hurricane Season
The Atlantic hurricane season begins on June 1 and ends on November 30. The 2002 Atlantic hurricane season was again an active one, making it the fifth consecutive active season. There were 12 named storms, compared to a 1944-1996 annual average of 9.8. Four of those named storms became hurricanes, of which 2 were classified as major. This compares to an average of 5.8 hurricanes a year, 2.5 of which are major (based on a 53-year average). There were also 2 additional tropical depressions. So, there were more named tropical cyclones than the long-term mean, but fewer strong storms. The season was also slow to begin, extremely active in September, and less active than average at its end. Eight named systems developed in September as well as a tropical depression, making it the most active month of any month on record for tropical cyclone development in the Atlantic basin.
Seven tropical storms made landfall on the continental U.S. in 2002, the most since 1998 when seven was also the number of landfalling tropical systems for the U.S. Hurricane Lili was the first hurricane to hit the coast of the U.S. since Irene in October 1999.
Notable tropical systems of 2002 included Hurricanes Isidore and Lili in September, which were quite intense, and Hurricane Kyle, also in September, which had a fairly long life. Kyle was the third longest-lived tropical cyclone in the Atlantic basin after Ginger of 1971 and Inga of 1969. Kyle formed on September 20 and spent over three weeks in the North Atlantic before finally coming ashore in South Carolina on October 11. Isidore became a category 3 hurricane as it moved into the southeastern Gulf of Mexico and hit the Yucatan Peninsula on September 22 at category 3 strength. After weakening over the Yucatan Peninsula it never quite regained hurricane strength and came ashore in Louisiana as a tropical storm. Lili was the only hurricane to make landfall in the United States in 2002, and did so at category 2. Lili had been a category 4 hurricane shortly before landfall and quickly weakened before reaching the west Louisiana coastline on October 3.
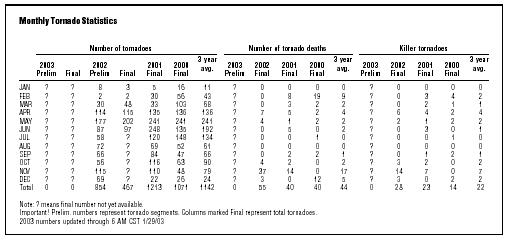
| Monthly Tornado Statistics | |||||||||||||||||
| Number of tornadoes | Number of tornado deaths | Killer tornadoes | |||||||||||||||
| 2003 Prelim | Final | 2002 Prelim | Final | 2001 Final | 2000 Final | 3 year avg. | 2003 prelim | 2002 Final | 2001 Final | 2000 Final | 3 year avg. | 2003 Prelim | 2002 Final | 2001 Final | 2000 Final | 3 year avg. | |
| Note: ? means final number not yet available. | |||||||||||||||||
| Important! Prelim. numbers represent tornado segments. Columns marked Final represent total tornadoes. | |||||||||||||||||
| 2003 numbers updated through 6 AM CST 1/29/03 | |||||||||||||||||
| JAN | ? | ? | 8 | 3 | 5 | 16 | 11 | ? | 0 | 0 | 0 | 0 | ? | 0 | 0 | 0 | 0 |
| FEB | ? | ? | 2 | 2 | 30 | 56 | 43 | ? | 0 | 8 | 19 | 9 | ? | 0 | 3 | 4 | 2 |
| MAR | ? | ? | 30 | 48 | 33 | 103 | 68 | ? | 0 | 3 | 2 | 2 | ? | 0 | 2 | 1 | 1 |
| APR | ? | ? | 114 | 115 | 135 | 136 | 136 | ? | 7 | 5 | 2 | 4 | ? | 6 | 4 | 2 | 4 |
| MAY | ? | ? | 177 | 202 | 241 | 241 | 241 | ? | 4 | 1 | 2 | 2 | ? | 2 | 1 | 2 | 2 |
| JUN | ? | ? | 87 | 97 | 248 | 135 | 192 | ? | 0 | 5 | 0 | 2 | ? | 0 | 3 | 0 | 1 |
| JUL | ? | ? | 58 | ? | 120 | 148 | 134 | ? | 0 | 0 | 1 | 0 | ? | 0 | 0 | 1 | 0 |
| AUG | ? | ? | 72 | ? | 69 | 52 | 61 | ? | 0 | 0 | 0 | 0 | ? | 0 | 0 | 0 | 0 |
| SEP | ? | ? | 66 | ? | 84 | 47 | 66 | ? | 0 | 2 | 2 | 1 | ? | 0 | 1 | 2 | 1 |
| OCT | ? | ? | 56 | ? | 116 | 63 | 90 | ? | 4 | 2 | 0 | 2 | ? | 3 | 2 | 0 | 2 |
| NOV | ? | ? | 115 | ? | 110 | 48 | 79 | ? | 37 | 14 | 0 | 17 | ? | 14 | 7 | 0 | 7 |
| DEC | ? | ? | 69 | ? | 22 | 26 | 24 | ? | 3 | 0 | 12 | 5 | ? | 3 | 0 | 2 | 2 |
| Total | 0 | 0 | 854 | 467 | 1213 | 1071 | 1142 | 0 | 55 | 40 | 40 | 44 | 0 | 28 | 23 | 14 | 22 |
(Courtesy of National Weather Service/NOAA.)
EL NIÑO SUPPRESSED HURRICANES IN 2002 SEASON
The 2002 Atlantic hurricane season produced only four hurricanes due to a strengthening El Niño. However, twice the normal number of storm systems (eight) affected the nation, bringing storm surge and severe weather and rain to the nation, including Hurricane Lili, the first land-falling hurricane to strike the United States since the 1999 hurricane season.
Overall in 2002, there were 12 named storms, four of which became hurricanes. Hurricanes Lili and Isidore were classified as major (category 3 or higher on the Saffir-Simpson hurricane scale). Eight storms (Tropical Storms Bertha, Edouard, Fay, and Hanna; and Hurricanes Gustav, Isidore, Kyle, and Lili) affected the coastal United States. Hurricane Lili was the only storm to make landfall while still a hurricane. The other 2002 storms were Tropical Storms Arthur, Cristobal, Dolly, and Josephine.
Hurricane forecasters at NOAA Climate Prediction Center (CPC), Hurricane Research Division and National Hurricane Center (NHC) correctly forecast that climate conditions, including the El Niño, would reduce the overall hurricane activity this season. The forecast called for seven to 10 tropical storms, of which four to six could develop into hurricanes, with one to three classified as major.
Louisiana, the hardest hit area, was battered by four storms including the powerful Hurricane Lili and Tropical Storm Isidore. The 2002 season's storms caused 9 deaths in the United States and about $900 million in damages.
The public relied heavily on Internet access for lifesaving information from NOAA this season. The explosive use of the Internet to convey vital information to the public in near real time has been astonishing. Between August and September the NHC web site recorded almost 500 million hits. The peak day for the season was October 3 (Hurricane Lili), when the site recorded 35.9 million hits—doubling the previous record set in 1999 during Hurricane Floyd.
Typhoon Pongsona hits Guam, December 8, 2002
Guam, west of the international date line, about 3,700 miles southwest of Hawaii, was raked by wind gusts of more than 180 mph on this day, and winds the following day of 70 mph continued in this U.S. Territory. No deaths were reported but the entire island was without electricity, and water and sewer systems were not expected to be fully operational for weeks. Sustained winds of 150 mph around the eye of Pongsona gave the storm a "super typhoon" status. Gusts up to 184 mph were reported in some areas of Guam. A wind gust of 117 mph was clocked before the National Weather Service's sensor failed, along with the radar. A reported 2,000 homes were destroyed and many more were damaged. Schools became emergency shelters.
Cyclone Zoe Strikes the Solomon Islands
Southern Pacific Ocean Category 5 Cyclone Zoe struck the southernmost Solomon Islands December 29, 2002, and was reported to be the most powerful ever recorded in the area, with winds reaching 225 mph and producing 33-foot waves that destroyed houses, uprooted trees, and flooded entire villages. Those living on the island used the common sense gained from centuries of dealing with these storms and had taken shelter in the hills on the island. Amazingly no one was killed on Tikopia, some 1,400 miles northeast of Sydney, Australia.
FLOODS AND FLASH FLOODS
Global Precipitation for 2002
Global precipitation was below the 1961–1990 average in 2002. Much of Australia experienced severe drought, with the eastern part of the country the worst affected. India monsoon rainfall was 19 percent below normal, with the resulting drought characterized as the worst since 1987. Other drought-affected areas included the western United States and portions of the north coast of China.
After a dry beginning to 2002, several typhoons brought excessive rains to parts of southeast Asia and Japan, the southeast coast of China, Taiwan, and the Philippines. In contrast to drought conditions during the first half of 2002, the onset of monsoon rains in southeast Asia promoted extensive flooding along the Mekong Delta. Seasonal flooding in much of south Asia (Nepal, Bangladesh, and northeastern India) during June–August claimed more than 1,000 lives. In the eastern United States, long-term drought was ameliorated by a turn to wetter weather, due in part to moisture from tropical systems.
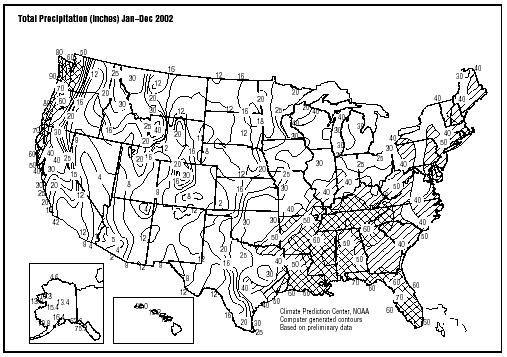
National Precipitation for 2002
During 2002, more than a tenth of the country was very dry in eight of the 11 months, and in February and May, more than 20 percent of the country was very dry. Only in September and October did the percentage area of very wet conditions exceed ten percent, though in October more than 20 percent of the country was very wet. This was due in part to several land-falling tropical systems during these two months. Drought improvement generally occurred in the eastern U.S. during 2002, while in much of the western half of the country and the central and southern Great Lakes drought worsened.
Precipitation in the United States in 2002 was characterized by extreme dryness in the west, generally above-average wetness in the Mississippi Valley Region and dryness giving way to near average conditions for the east. Colorado had its driest year on record during 2002, and Wyoming, Nevada, and Nebraska had their third driest years. Six states were much drier than normal and the Southwest region as a whole was the fourth driest on record.
Louisiana had its wettest fall on record, in part due to two land-falling tropical systems that hit the state in September and October. It was the third driest July and August combined for the Northeast. Considerable improvement in drought conditions for the east coast occurred in the fall so that annual totals for much of the east coast were near normal.
EARTHQUAKES
November 3, 2002 (UTC), Denali Fault, Alaska
This M7.9 shock is the largest earthquake on the Denali fault since at least 1912, when an M7.2 earthquake occurred in the general vicinity of the fault, 50 miles east of this latest epicenter. This M7.9 shock, which was also one of the largest ever recorded on U.S. soil, occurred on the Denali-Totschunda fault system, one of the longest strikeslip fault systems in the world and a rival in size to California's famed San Andreas strike-slip fault system, which spawned the destructive M7.8 San Francisco earthquake in 1906.
VOLCANIC ACTIVITY
The Pu'u 'O'o-Kupaianaha eruption of Kilauea, now in its nineteenth year and fifty-fifth eruptive episode, ranks as the most voluminous outpouring of lava on the volcano's east rift zone in the past five centuries. By September 2002,2.3 km 3 of lava had covered 110 km 2 and added 220 hectares to Kilauea's southern shore. In the process, lava flows destroyed 189 structures and resurfaced 13 km of highway with as much as 25 m of lava.
Beginning in 1983, a series of short-lived lava fountains built the massive cinder-and-spatter cone of Pu'u' O'o. In 1986, the eruption migrated 3 km down the east rift zone to build a broad shield, Kupaianaha, which fed lava to the coast for the next five-and-a-half years. When the eruption shifted back to Pu'u 'O'o in 1992, a series of flank-vent eruptions formed a shield banked against the uprift side of the cone. Continuous eruption from these vents undermined the west and south flanks of the cone, resulting in large collapses of the west flank.
In May 2002 a new vent opened on the west side of the shield and fed flows down the western margin of the flow field, sparking the largest forest fire in the park in 15 years. These flows reached the ocean near the end of Chain of Craters Road in July, and as many as 4,000 visitors per day flocked to view flowing lava up close for the rest of the summer.
171 PEOPLE WERE RESCUED IN THE U.S. IN 2002 WITH HELP FROM NOAA SATELLITES
Thanks to environmental satellites with search and rescue tracking capability, the Commerce Department's National Oceanic and Atmospheric Administration (NOAA) helped save 171 lives in the United States in 2002.
The NOAA satellites, along with Russia's Cospas satellites, are part of an international Search-and-Rescue Satellite-Aided Tracking System known as Cospas-Sarsat. The system uses a constellation of satellites in geostationary and polar orbits to detect and locate emergency beacons from vessels and aircraft in distress and from hand-held Personal Locator Beacons (PLBs). India and the European Space Agency also provide geostationary satellites for the Cospas-Sarsat System.
Of the 171 rescues last year, 133 people were saved on the nation's seas, 27 in the Alaska wilderness, and 11 from downed aircraft in states around the country. Of the 69 separate Sarsat rescue events, a variety took place out at sea.
Engine fires, flooding, and rough seas all caused emergencies resulting in distress calls and rescues. In Alaska, stranded snowmobilers and lost persons were among those rescued. Downed aircraft incidents included those making emergency landings. In one such incident, a Piper Supercub had flipped after landing near Glenallen, Alaska. Both the pilot and passenger were uninjured.
More than 15,000 lives have been saved worldwide (and nearly 4,500 in the United States alone) since the system became operational in 1982. September 2002 marked the 20th anniversary of the first Sarsat rescue.
In one dramatic rescue, a father, a son, and their family dog were plucked from a life raft in the Gulf of Alaska about 90 miles south of Cordova, Alaska. They were in a dangerous predicament: their fishing vessel had struck an object and sustained uncontrollable flooding, causing them to abandon the craft. Yet, because there was an Emergency Position Indicating Radio Beacon, or EPIRB, on board that was manually activated, a U.S. Coast Guard search and rescue helicopter was able to respond to the distress call quickly once the alert information was received from the USMCC. On arrival the helicopter saw the situation unfolding and deployed a rescue swimmer to retrieve the three occupants and bring them to safety. This particular incident illustrates the importance of emergency beacon registration.
NOAA expects the number of worldwide rescues for 2002 will total about 1,500. The average number of distress alerts continues to rise internationally as more countries sign on to use the advantages and benefits of the Cospas-Sarsat system.
NOAA's Geostationary Operational Environmental Satellites (GOES) can instantly detect emergency distress signals. The polar-orbiting satellites in the system detect emergency signals as they circle the Earth from pole to pole. The signals are sent to the Mission Control Centers, then automatically sent to rescue forces around the world. There are 35 countries participating in the system as of 2002.
NOAA Satellites and Information is the nation's primary source of operational space-based meteorological and climate data. In addition to search and rescue, NOAA's environmental satellites are used for weather forecasting, climate monitoring, and other environmental applications such as volcanic eruptions, ozone monitoring, sea surface temperature measurements, and wild fire detection.
NOAA Satellites and Information also operates three data centers, which house global data bases in climatology, oceanography, solid earth geophysics, marine geology and geophysics, solar-terrestrial physics, and paleoclimatology.
NOAA is dedicated to enhancing economic security and national safety through the prediction and research of weather- and climate-related events and providing environmental stewardship of our nation's coastal and marine resources.
2002 UNITED STATES WEATHER REVIEW
According to the National Climatic Data Center (NCDC), most of the country was abnormally warm once again in 2002, resulting in this being one of the warmest 15 years since records began in 1895. Below-average precipitation led to persistent or worsening drought for much of the nation, although a series of storms ended drought across the East Coast by year's end, and wet conditions prevailed from the lower Mississippi Valley into the Tennessee and Ohio River Valleys for much of the year. Major flooding hit south central Texas this summer. Drought affected farm areas in the High Plains this spring and summer, but several timely frontal passages in July and August prevented drought from becoming widespread over the Corn Belt. Six states—Wyoming, Nebraska, Colorado, Utah, Nevada, and Arizona—recorded one of the driest seven years on record, with Colorado recording its driest year ever.
WINTER (DECEMBER 2001–FEBRUARY 2002)
Winter 2001–2002 was generally mild and tranquil, with less-than-normal snowfall, although there were some notable exceptions. A series of early winter storms crossed the Northwest from Washington and Oregon into Idaho and northern California, ending drought across most of the region. In contrast, precipitation was scarce across the plains of Montana and southward through Wyoming and Colorado. Extraordinarily dry weather covered the Southwest from southern California through Arizona and New Mexico. Cumulative precipitation from the Southwest through the Rockies into the High Plains totaled less than 50% of normal. Nationally, this was the ninth mildest winter (December– February) on record, as nearly the entire country east of the Continental Divide experienced above-normal warmth. Temperatures for the three-month period averaged 5–10°F above normal over the Midwest and Northeast. Ten states in the northeastern quadrant of the country measured their mildest winters on record.
For the central and eastern parts of the country, the pattern featured mild weather with little snow, the main exception being parts of the Great Lakes region, which saw heavy lake-effect snows. A marked dearth of winter storms led to near-record dryness from Maine to Georgia, resulting in unseasonably low groundwater, lake, and stream levels. Precipitation from the mid-Atlantic region to the Gulf Coast totaled less than 75% of normal, with several areas recording under 50% of normal. New Jersey and Maryland measured their driest winter of record.
Despite a major snowstorm that swept across the Southeast during the first few days of January, most locations east of the Continental Divide registered meager snowfall amounts this season. The New York City–Washington urban corridor saw only three to five inches of snow for the entire snow season. New York City's 3.5 inches was it second lowest snowfall total on record.
The most damaging and expensive storm of the winter season spread rain, ice, and snow from New Mexico to Maine from January 30 to February 1. A thick layer of ice toppled trees and power lines and left hundreds of thousands of customers without power in Missouri, Kansas, and Oklahoma. The storm did, however, bring much needed moisture to the Plains wheat crop. The cold air associated with the storm left the northern High Plains winter wheat crop exposed to temperatures as low as –20 F.
SPRING (MARCH–MAY)
Wintry weather finally took hold over most of the nation during March, and an active storm pattern brought normal precipitation to many areas along the East Coast for the first time since August or September. This was the second-coldest March in the past 20 years nationally. Monthly temperatures averaged 10–20°F below normal across the northern Plains. Following March, extremes of temperature alternated during the rest of the spring, but Montana still ended up with its fourth-coldest spring since 1895. Record heat enveloped the country during the middle of April, sending mercury readings into the 90s across the Midwest and Northeast. Some 300 daily record high temperature records were set during April 14-20.
Only a few weeks later, a dramatic change in circulation brought polar air southward from Canada, resulting in frigid air covering a large expanse of the nation and nearly 500 low-temperature records during May 17-25. A number of locations from the Tennessee Valley into the mid-Atlantic region registered their latest freezes on record during this cold snap. The seesaw continued as, days later, a ridge of high pressure building up over the Southwest brought extreme heat to the West and Plains. Temperatures soaring into the 90s and 100s during May 30 to June 1 broke some 250 daily records and three dozen May monthly records.
Tornado alley was relatively quiet this spring, due to abnormally dry weather in the central parts of the country. But there were a number of outbreaks of severe weather from late spring into summer. About 50 tornadic thunderstorms hit central and eastern parts of the country during the last 10 days of April. One of the strongest East Coast tornadoes on record, an F4, struck La Plata, Maryland, on the 28th. The tornado was part of a storm system that brought heavy precipitation to many areas, including up to 20 inches of snow in Wisconsin.
Abnormally high pressure aloft kept southern Alaska unusually dry this spring, with the greatest deficits in the Panhandle. Although Anchorage recorded its all-time record 24-hour snowfall (26.7 inches) on March 16–17, most of the rest of the state saw dry conditions this month, especially across the south. Juneau saw its second driest April, with 0.47 inches (15% of normal) of precipitation. Spring precipitation totaled less than 50% of normal across the Panhandle.
Drought intensified over the Southwest, the Rockies, and the High Plains, as three-month precipitation totaled under 50% of normal across much of this region. Less than 25% of normal precipitation fell over the plains of Colorado, New Mexico, Arizona, southern California, and southern and eastern Utah. Colorado recorded its driest spring on record, and Arizona measured its second driest. The 12-month period ending in May was the driest ever for both states.
In contrast, the Midwest saw above-normal wetness, with spring precipitation 150% of normal across much of the Ohio Valley. Indiana saw its third wettest spring on record. Repeated rounds of heavy rain led to persistent lowland flooding from the southeastern Plains to the Ohio Valley during May, when more than a foot of rain fell on parts of Indiana, Illinois, and Missouri. Heavy rains led to significant fieldwork delays in the Corn Belt.
SUMMER (JUNE–AUGUST)
Heat and dryness contributed to huge wildfires in Colorado and Arizona from late spring into early summer and an active fire season throughout the West this year. Five western states—Nevada, Utah, Arizona, California, and Colorado—measured their driest summers since 1895. This was the driest first half of a year (January–June) on record in Arizona, Utah, and Colorado.
By the end of June wildfires had burned 2.8 million acres across the country, with most of the acreage in the parched West. Record large fires burned in Arizona, Colorado, and Oregon this spring and summer. Nationally, fires burned 7.1 million acres by year's end, nearly double the 10-year average. This was the second worst fire year in the past 14 years.
Summer rainfall totaled less than one-half of normal from western South Dakota to eastern Kansas and over large parts of Colorado and the other western states. But heavy rain and snow relieved drought in northern Montana in June, resulting in summer rainfall more than twice normal.
In late June, drought indices showed some 50% of the contiguous United States in drought, with severe drought covering nearly 40% of the country. Over one-quarter of the nation endured extreme drought, primarily the Southwest and the southeastern Piedmont areas. In addition, abnormal dryness covered about one-half of Alaska and lingered over parts of Hawaii. The last time severe drought covered a larger area occurred during the mid-1950s mini-dust bowl era.
One area with a quickly disappearing drought this year was south-central Texas, as an upper-level low-pressure system delivered torrential rains from the end of June into the first week of July. Over a foot of rain brought devastating floods to the San Antonio region, with thousands of people displaced from their homes. San Antonio measured 16.16 inches of rain from June 30 to July 6, and the city's monthly total of 16.92 inches (833% of normal) was by far its wettest July total ever.
Strong thunderstorms also brought widespread flooding to North Dakota and western Minnesota in June, resulting in considerable crop and property damage.
A series of heat waves affected the country at various times this summer. Much of the nation sweltered from June 29 to July 4 as the Bermuda High pumped tropical air northward. Bismark, North Dakota, set an all-time high mark with 111°F on June 29. On Independence Day temperatures neared triple digit levels in the mid-Atlantic region. Both Baltimore and Richmond registered maximum readings of 100°F.
Cold fronts brought cooler air to central and eastern parts of the country temporarily after July 4, but the heat continued in the West, with July 10 entering the record books as one of the hottest days in recent history across the interior Pacific states and the western Great Basin. Readings reached 115°F in the Sacramento Valley and exceeded 100°F as far north as Washington. Reno, Nevada's, maximum of 108°F on July 10 was its all-time highest, and this record was tied just one day later. During July 7–14, triple-digit heat broke more than 500 daily high-temperature records and numerous all-time highs.
In the Plains, extreme heat further aggravated drought conditions in July. From the 15th to the 21st, thermometers from South Dakota to Kansas hit the century mark each day. Omaha, Nebraska, reached 104°F on the 22nd before a cold front brought temporary relief. Another heat wave covered central and northeastern parts of the country in late July and early August, followed by a return of the heat to the Northeast in mid-August. Washington, DC, recorded eight consecutive days of 95-degree or higher temperatures from August 12 to 19, tying a record for the longest stretch of 95-degree readings.
Nationally, this was the third hottest summer (June– August) in over 100 years of record, exceeded only by the summers of 1934 and 1936. The hot weather aggravated drought in many areas, especially the East and the western Plains states, significantly cutting crop yields. Although several bouts of showers eased dryness over most of the Corn Belt, summer rainfall totaled less than 75% of normal over southern parts of Illinois, Indiana, and Michigan, and across much of Ohio. A dry pocket in northwestern Ohio saw less than 50% of normal rainfall. Hot, dry conditions in July severely stressed reproductive to filling crops in the westernmost Corn Belt.
AUTUMN (SEPTEMBER–NOVEMBER)
Twelve named tropical storms formed in the Atlantic basin during 2002, four becoming hurricanes. The two most notable storms took quite similar tracks from the Gulf of Mexico into the central Gulf states. In late September, Isidore slammed into southern Mississippi at tropical storm strength, its remains bringing tropical deluges of two to eight inches as far north as the Ohio Valley. On October 3, Hurricane Lili, the first storm to make landfall at hurricane strength since 1999, hit the central coast of Louisiana, bringing wind gusts to 92 mph and inundating low-lying areas. As with Isidore, tropical rains extended far northward into the Ohio Valley.
October brought a change in the weather pattern to most of the country, as the Bermuda High responsible for much of the summer heat retreated and the westerlies dropped southward, allowing cold Canadian air to penetrate the U.S. October 2002 was nearly opposite to October 2001, with below-normal temperatures and bouts of rain and snow affecting many states. One nor'easter early in the month ended many aspects of the long-term drought across the Eastern Seaboard, lifting water tables and adding substantially to reservoir levels. Tropical Storm Kyle, which had been meandering around the Atlantic for nearly three weeks, grazed the South Carolina coast on October 10–11, further eating away at the long-term drought.
October brought an early winter to many parts of the nation, as Canadian high pressure plunged southward. By the last day of the month, minimum temperatures hit sub-zero levels from Oregon to North Dakota, and dipped to –11°F in Montana.
The stormy weather pattern lasted through year's end, virtually ending the long-term drought over the Eastern Seaboard, but bringing violent weather to some areas.
Cold air behind an intense cold front sweeping across the central parts of the country clashed with unseasonably mild and humid air in the East on November 10, setting the stage for the year's deadliest outbreak of severe weather. Tornadoes in seven states from Mississippi, Alabama, and Georgia northward to Ohio and Indiana left 36 people dead. From late Sunday on the 10th through Monday the 11th there were more than 70 tornadoes, 250 damaging wind events, and 160 large hail occurrences from Louisiana across the Tennessee and Ohio Valleys to Pennsylvania and Georgia.
A few days earlier, a huge Pacific storm hit the Pacific states with a barrage of wind, waves, rain, and mountain snows. The first major storm of the season slammed the western states from November 7 to 9, bringing wind gusts of 55 mph to the San Francisco area and two to three feet of snow to the Sierra Nevada. The two- to four-inch rainfall amounts that covered large parts of California, Oregon, and Nevada constituted a big portion of the normal annual rainfall in some of the more arid locations. But the moisture was not entirely unwelcomed, as it put a big dent in the ongoing drought. Downtown Los Angeles recorded 2.31 inches of rain during the storm, more than the city received during the entire year-to-date through November 6 (1.61 inches). Nevertheless, even with the heavy rain, the city's year-to-date total through November 10 of 3.92 inches was just 31 percent of normal. The 12 months ending in October were coastal southern California's driest such period since at least 1895.
Nor'easters brought heavy rain, snow, or ice to the Eastern Seaboard on November 5–6 and 16–17, further eating away at any lingering drought. The freezing rain that fell on New England on Saturday the 16th turned into a major ice storm for Connecticut.
Conditions were abnormally dry north and west of the storm track this autumn. Reduced soil moisture and bouts of cool weather hindered winter wheat establishment across the northern and central Plains and the Northwest. Precipitation during the three-month period totaled under 50% of normal from Michigan into northeast Oklahoma. In Illinois, Peoria recorded only 34% of its normal September-November precipitation, setting a record for the city's driest autumn. Most of Washington and Oregon recorded less than 50% of normal precipitation.
DECEMBER
One of the most damaging ice storms of the year took place on December 4. Freezing rain fell from southern Virginia to northern Georgia, with the Carolinas bearing the brunt of the ice storm. A layer of ice one-half to one-inch thick toppled trees and power lines, leaving 1.5 million customers without power in North Carolina and many others in the dark in South Carolina. The same storm spread five to eight inches of snow from Washington, D.C., to New York City on the 5th, resulting in more snow in one day than the I-95 corridor saw during the entire 2001–2002 winter season. A number of Pacific storms pelted the West Coast states with strong winds, heavy rain, and mountain snows during December, the largest bearing down on Washington, Oregon, and California from the 13th to the 16th. This storm dropped seven inches of rain near San Francisco and brought river flooding to northern California. Winds gusted to 90 mph along the Oregon coast. Winds measured at 82 mph caused major property damage to Reno, Nevada, on the 14th. Another Pacific storm a few days later brought street flooding to San Francisco.
The storm that brought flooding to California on December 19–20 developed into a massive winter storm that brought a lot of wintry weather from the Plains to the Northeast on December 23–25. The storm left six to 12 inches of snow from western Oklahoma and northern Texas to southern Missouri on the 23rd to 24th and triggered severe thunderstorms in eastern Texas and southern Georgia. Coastal development led to an intense nor'easter on Christmas day, resulting in one to two feet of snow from Pennsylvania through upstate New York into New England.
Still more storms struck the West Coast the last few days of the year. At Squaw Valley in California, snow depth rose to 122 inches on the last day of the year, and winds gusted on top to 111 mph. For the month, many Tahoe locations accumulated 10 to 15 feet of snow. Along the Pacific coast, rainfall exceeded two feet this month from northern California into southwestern Oregon.
Dry weather persisted across the upper Midwest, as precipitation totaled under one-half of normal from Nebraska to the Great Lakes. In Nebraska, Omaha recorded no precipitation for the entire month. In Missouri, Kansas City measured only 0.03 inches, tying the record for the driest December. For the first time ever, Des Moines, Iowa, failed to receive measurable monthly precipitation.
2002 PRECIPITATION RECORDS FOR SELECTED LOCATIONS
Driest Year (Inches) on Record
Yuma, AZ 0.03
Palm Springs, CA 0.76
Phoenix, AZ 2.82
Pueblo, CO 3.94
Winslow, AZ 4.31
Laramie, WY 5.78
Denver, CO 7.48
Wettest Year on Record
Lake Charles, LA 85.17
EARTHQUAKE IN WEST CENTRAL MEXICO, JANUARY 21, 2003.
A major earthquake occurred in Colima, Mexico, about 310 miles west of Mexico City near the coastal city of Manzanillo, at 7:06 PM MST, January 21, 2003 (8:06 PM CST in Mexico). A preliminary magnitude of 7.8 was computed for this earthquake. The magnitude and location may be revised when additional data and further analysis results are available. There were at least 28 deaths, 300 injuries, and considerable damage in the states of Colima, Michoacan, and Jalisco. The earthquake was felt strongly in Mexico City.
WEATHER ANECDOTES
March 26, 2002, Slidell, LA. Two teenage girls using curling irons were hospitalized after lightning traveled through their houses electrical wiring.
May 13, 2002, Iron Co., MO. A 43-year old man was trying to cross the flooding Stouts Creek on foot to get to his home to rescue his dogs. He was knocked down, but managed to grab hold of a tree. He was swept away and drowned by the rising water before workers could reach him.
August 23, 2002, Willard, MO. Three mourners at a rural graveside funeral were killed when they were struck by lightning that cracked down a tree under which they took shelter.
This shallow earthquake occurred in a seismically active zone near the coast of central Mexico. The earthquake occurred near the juncture of three tectonic plates: the North American Plate to the northeast, the Rivera Plate to the northwest, and the Cocos Plate to the south. Both the Rivera Plate and the Cocos Plate are being consumed beneath the North American Plate. The slower moving Rivera Plate is moving northwest at about 2 cm per year relative to the North American Plate and the faster moving Cocos plate is moving in a similar direction at a rate of about 4.5 cm per year.
There have been several significant earthquakes near the recent event. In 1932, a magnitude 8.4 earthquake struck about 100 km to the northnorthwest. More recently, on October 9, 1995 a magnitude 8.0 earthquake struck about 50 km to the northwest killing at least 49 people and leaving 1,000 homeless. The most deadly earthquake in the region occurred about 170 km to the southeast on September 19,1985. This magnitude 8.0 earthquake killed at least 9,500 people, injured about 30,000, and left 100,000 people homeless.
Comment about this article, ask questions, or add new information about this topic: