2001 ANCHORAGE, ALASKA (ANC)
Anchorage is in a broad valley with adjacent narrow bodies of water. Cook Inlet, including Knik Arm and Turn again Arm, lies approximately 2 miles to the west, north, and south. The terrain rises gradually to the east for about 10 miles, with marshes interspersed with glacial moraines, shallow depressions, small streams, and knolls. Beyond this area, the Chugach Mountains rise abruptly into a range oriented north–northeast to south–southwest, with average elevation 4,000 to 5,000 feet and some peaks to 8,000 or 10,000 feet. The Chugach Range acts as a barrier to the influx of warm, moist air from the Gulf of Alaska, so the average annual precipitation is only 10 to 15 percent of that at stations located on the Gulf of Alaska side of the Chugach Range. The Alaska Mountain Range lies in a long arc from southwest, through northwest, to northeast, approximately 100 miles distant from Anchorage. During the winter, this range is an effective barrier to the influx of very cold air from the north side of the range.
The four seasons are well marked in Anchorage. In the summer, high temperatures average about 60 degrees and low temperatures nearly 50 degrees. Temperatures in the 70s are considered very warm. On summer days, temperatures on the east side of Anchorage may be about 10 degrees warmer than the official airport readings. Rain increases after mid–June. About two–thirds of the days in July and August are cloudy and one–third have rain.
Autumn is brief, beginning in early September and ending in mid–October. Temperatures begin to fall in September with snow becoming more frequent in October.
Winter can be considered as mid–October to early April when streams and lakes are frozen. Temperatures steadily decrease into January when the highs are near 20 degrees and lows near 5 degrees. The coldest weather is normally in January, when very cold days have high temperatures below zero. Cold days generally have clear skies and calm wind. Mild days do occur with temperatures in the 30s. On cold winter nights, temperatures on the east side of Anchorage may be 10–20 degrees lower than airport readings on the west side. Most winter precipitation is snow, but rain may occur on a few days.
Annual snowfall varies from about 70 inches on the west side to about 90 inches on the east side of Anchorage at low elevations. Along the Chugach Mountains, snow totals increase steadily with increasing elevations and winter arrives a month earlier and stays a month longer at the 1,000 to 2,000 foot level. Most snow is light or dry, i.e., low in water content. Freezing rain is extremely rare. Fog, made of water droplets, occurs on about fifteen days. In general, ice–fog does not occur in Anchorage.
Spring begins in late April and May when days are warm and sunny, nights are cool, and precipitation is exceedingly small. Foliage turns green by late May.
The wind in Anchorage is generally light. However, on several days each winter, strong northerly winds, up to 90 mph, affect the entire Anchorage area. Also during the winter there are about eight occurrences of very strong southeast winds which affect only the east side of Anchorage and the slopes of the Chugach Mountains. These winds occur more often above the 800 feet elevation in the Chugach where winds are funneled thru creek canyons. On the east side of Anchorage, damaging winds of over 100 mph have been recorded.
The average occurrence of the first snow is mid–October, but has occurred as early as mid–September. The average date of the last snow is mid–April, but has occurred as late as early May. The growing season is about 125 days. Average occurrence of the last temperature of 32 degrees in spring is mid–May and the first in fall is mid–September. Daylight varies from about 19 hours in late June to 6 hours in late December with 12 hours of daylight occurring in late September and late March.
NORMALS, MEANS, AND EXTREMES
ANCHORAGE, AK (ANC)
LATITUDE: LONGITUDE: ELEVATION (FT): TIME ZONE: WBAN: 26451
61 10′ 30″ N 149 59′ 36″ W GRND: 130 BARO: 133 ALASKA (UTC + 9)
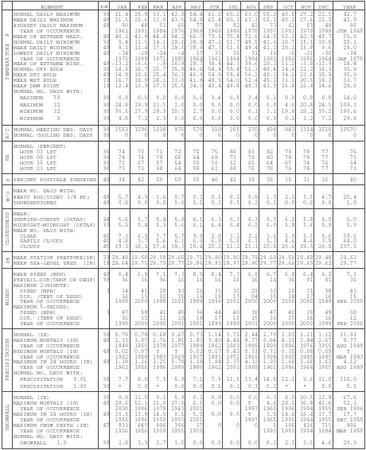
| ELEMENT | POR | JAN | FEB | MAR | APR | MAY | JUN | JUL | AUG | SEP | OCT | NOV | DEC | YEAR | |
| TEMPERATURE F | NORMAL DAILY MAXIMUM | 30 | 21.4 | 25.8 | 33.1 | 42.8 | 54.4 | 61.6 | 65.2 | 63.0 | 55.2 | 40.5 | 27.2 | 22.5 | 42.7 |
| MEAN DAILY MAXIMUM | 48 | 21.5 | 25.6 | 33.0 | 43.5 | 54.9 | 62.4 | 65.1 | 63.1 | 55.2 | 40.2 | 27.6 | 22.3 | 42.9 | |
| HIGHEST DAILY MAXIMUM | 48 | 50 | 48 | 51 | 65 | 77 | 85 | 82 | 82 | 73 | 61 | 53 | 48 | 85 | |
| YEAR OF OCCURRENCE | 1961 | 1991 | 1984 | 1976 | 1969 | 1969 | 1989 | 1978 | 1957 | 1993 | 1979 | 1999 | JUN 1969 | ||
| MEAN OF EXTREME MAXS. | 48 | 40.1 | 41.8 | 44.4 | 54.2 | 66.7 | 73.5 | 75.4 | 72.8 | 64.5 | 53.2 | 42.3 | 40.7 | 55.8 | |
| NORMAL DAILY MINIMUM | 30 | 8.4 | 11.5 | 18.1 | 28.6 | 38.8 | 47.2 | 51.7 | 49.5 | 41.6 | 28.7 | 15.1 | 10.0 | 29.1 | |
| MEAN DAILY MINIMUM | 48 | 8.3 | 11.4 | 17.5 | 28.6 | 38.9 | 47.3 | 51.5 | 49.4 | 41.2 | 28.1 | 15.8 | 9.6 | 29.0 | |
| LOWEST DAILY MINIMUM | 48 | -34 | -28 | -24 | –4 | 17 | 33 | 38 | 31 | 19 | –5 | -21 | -30 | -34 | |
| YEAR OF OCCURRENCE | 1975 | 1999 | 1971 | 1985 | 1964 | 1961 | 1964 | 1984 | 1992 | 1956 | 1956 | 1964 | JAN 1975 | ||
| MEAN OF EXTREME MINS. | 48 | –13.2 | –8.6 | –.8 | 16.9 | 29.7 | 39.4 | 44.3 | 39.6 | 29.3 | 11.2 | –3.0 | –12.3 | 14.4 | |
| NORMAL DRY BULB | 30 | 14.9 | 18.7 | 25.7 | 35.8 | 46.6 | 54.4 | 58.4 | 56.3 | 48.4 | 34.6 | 21.2 | 16.3 | 35.9 | |
| MEAN DRY BULB | 48 | 14.9 | 18.6 | 25.4 | 36.1 | 46.9 | 54.9 | 58.4 | 56.2 | 48.2 | 34.1 | 21.6 | 15.9 | 35.9 | |
| MEAN WET BULB | 18 | 16.7 | 18.0 | 24.1 | 33.0 | 41.8 | 49.5 | 54.0 | 52.4 | 45.2 | 31.1 | 20.5 | 18.2 | 33.7 | |
| MEAN DEW POINT | 18 | 12.4 | 13.3 | 17.5 | 25.5 | 34.0 | 43.4 | 49.8 | 48.3 | 41.0 | 26.4 | 16.4 | 14.6 | 28.6 | |
| NORMAL NO. DAYS WITH: | |||||||||||||||
| MAXIMUM 70 | 30 | 0.0 | 0.0 | 0.0 | 0.0 | 0.6 | 3.4 | 6.5 | 3.4 | 0.1 | 0.0 | 0.0 | 0.0 | 14.0 | |
| MAXIMUM 32 | 30 | 24.8 | 19.9 | 11.5 | 2.0 | 0.0 | 0.0 | 0.0 | 0.0 | 0.0 | 4.6 | 20.8 | 24.5 | 108.1 | |
| MINIMUM 32 | 30 | 30.5 | 27.3 | 28.3 | 20.3 | 2.7 | 0.0 | 0.0 | 0.1 | 3.2 | 19.8 | 28.2 | 30.2 | 190.6 | |
| MINIMUM 0 | 30 | 9.8 | 7.2 | 2.3 | 0.0 | 0.0 | 0.0 | 0.0 | 0.0 | 0.0 | 0.1 | 3.2 | 7.2 | 29.8 | |
| H/C | NORMAL HEATING DEG. DAYS | 30 | 1553 | 1296 | 1218 | 876 | 570 | 318 | 205 | 270 | 498 | 942 | 1314 | 1510 | 10570 |
| NORMAL COOLING DEG. DAYS | 30 | 0 | 0 | 0 | 0 | 0 | 0 | 0 | 0 | 0 | 0 | 0 | 0 | 0 | |
| RH | NORMAL (PERCENT) | ||||||||||||||
| HOUR 03 LST | 30 | 74 | 73 | 71 | 72 | 72 | 75 | 80 | 83 | 82 | 78 | 79 | 77 | 76 | |
| HOUR 09 LST | 30 | 74 | 74 | 70 | 66 | 64 | 68 | 73 | 78 | 80 | 78 | 78 | 77 | 73 | |
| HOUR 15 LST | 30 | 72 | 67 | 57 | 54 | 50 | 56 | 62 | 65 | 64 | 67 | 74 | 76 | 64 | |
| HOUR 21 LST | 30 | 73 | 71 | 68 | 64 | 59 | 62 | 69 | 76 | 78 | 76 | 78 | 77 | 71 | |
| S | PERCENT POSSIBLE SUNSHINE | 40 | 34 | 42 | 50 | 50 | 50 | 46 | 42 | 38 | 38 | 35 | 31 | 26 | 40 |
| W/O | MEAN NO. DAYS WITH: | ||||||||||||||
| HEAVY FOG (VISBY 1/4 MI) | 48 | 5.7 | 4.3 | 1.6 | 0.7 | 0.3 | 0.1 | 0.2 | 0.9 | 1.3 | 2.1 | 3.5 | 4.7 | 25.4 | |
| THUNDERSTORMS | 48 | 0.0 | 0.0 | 0.0 | 0.0 | 0.1 | 0.1 | 0.5 | 0.2 | 0.1 | 0.0 | 0.0 | 0.0 | 1.0 | |
| CLOUDINESS | MEAN: | ||||||||||||||
| SUNRISE–SUNSET (OKTAS) | 44 | 5.6 | 5.7 | 5.4 | 5.8 | 6.1 | 6.3 | 6.3 | 6.3 | 6.3 | 6.1 | 5.8 | 6.0 | 6.0 | |
| MIDNIGHT–MIDNIGHT (OKTAS) | 33 | 5.5 | 5.4 | 5.3 | 5.6 | 6.1 | 6.4 | 6.4 | 6.2 | 6.0 | 5.8 | 5.6 | 5.9 | 5.9 | |
| MEAN NO. DAYS WITH: | |||||||||||||||
| CLEAR | 45 | 7.1 | 6.3 | 7.7 | 5.7 | 3.9 | 2.8 | 3.2 | 3.2 | 3.6 | 5.0 | 5.5 | 5.6 | 59.6 | |
| PARTLY CLOUDY | 45 | 4.8 | 3.7 | 5.6 | 6.1 | 6.6 | 6.9 | 5.8 | 6.1 | 5.3 | 4.6 | 4.6 | 3.9 | 64.0 | |
| CLOUDY | 45 | 19.3 | 18.1 | 17.6 | 18.3 | 20.4 | 20.2 | 21.2 | 21.1 | 20.5 | 20.6 | 19.3 | 20.9 | 237.5 | |
| PR | MEAN STATION PRESSURE(IN) | 29 | 29.48 | 29.58 | 29.58 | 29.60 | 29.71 | 29.80 | 29.80 | 29.79 | 29.60 | 29.50 | 29.49 | 29.48 | 29.62 |
| MEAN SEA–LEVEL PRES. (IN) | 18 | 29.64 | 29.75 | 29.73 | 29.77 | 29.86 | 29.91 | 29.97 | 29.90 | 29.77 | 29.66 | 29.63 | 29.62 | 29.77 | |
| WINDS | MEAN SPEED (MPH) | 48 | 6.4 | 6.9 | 7.1 | 7.3 | 8.5 | 8.4 | 7.3 | 6.9 | 6.7 | 6.8 | 6.4 | 6.2 | 7.1 |
| PREVAIL. DIR (TENS OF DEGS) | 38 | 36 | 36 | 36 | 16 | 16 | 16 | 16 | 16 | 16 | 36 | 01 | 01 | 36 | |
| MAXIMUM 2–MINUTE: | |||||||||||||||
| SPEED (MPH) | 3 | 34 | 41 | 29 | 33 | 26 | 33 | 30 | 29 | 33 | 29 | 31 | 38 | 41 | |
| DIR. (TENS OF DEGS) | 16 | 15 | 02 | 15 | 16 | 18 | 17 | 04 | 15 | 18 | 17 | 16 | 15 | ||
| YEAR OF OCCURRENCE | 1999 | 2000 | 1999 | 2001 | 1999 | 1999 | 2001 | 2000 | 2000 | 2000 | 2000 | 1999 | FEB 2000 | ||
| MAXIMUM 5–SECOND: | |||||||||||||||
| SPEED (MPH) | 3 | 47 | 58 | 41 | 45 | 36 | 44 | 40 | 38 | 47 | 40 | 39 | 49 | 58 | |
| DIR. (TENS OF DEGS) | 16 | 12 | 11 | 18 | 18 | 17 | 15 | 15 | 15 | 17 | 16 | 16 | 12 | ||
| YEAR OF OCCURRENCE | 1999 | 2000 | 2000 | 2001 | 2001 | 1999 | 1999 | 2001 | 2000 | 2000 | 2000 | 1999 | FEB 2000 | ||
| PRECIPITATION | NORMAL (IN) | 30 | 0.79 | 0.78 | 0.69 | 0.67 | 0.73 | 1.14 | 1.71 | 2.44 | 2.70 | 2.03 | 1.11 | 1.12 | 15.91 |
| MAXIMUM MONTHLY (IN) | 48 | 2.13 | 3.07 | 2.76 | 1.91 | 1.93 | 3.40 | 4.49 | 9.77 | 6.64 | 4.11 | 2.84 | 2.67 | 9.77 | |
| YEAR OF OCCURRENCE | 1949 | 1955 | 1979 | 1977 | 1989 | 1962 | 2001 | 1989 | 1990 | 1986 | 1976 | 1955 | AUG 1989 | ||
| MINIMUM MONTHLY (IN) | 48 | 0.02 | 0.07 | T | T | 0.02 | 0.17 | 0.42 | 0.33 | 0.72 | 0.35 | 0.08 | 0.09 | T | |
| YEAR OF OCCURRENCE | 1982 | 1958 | 1983 | 1969 | 1957 | 1993 | 1972 | 1969 | 1998 | 1960 | 1985 | 1995 | MAR 1983 | ||
| MAXIMUM IN 24 HOURS (IN) | 48 | 1.19 | 1.16 | 1.25 | 0.78 | 1.18 | 1.84 | 2.37 | 4.12 | 1.92 | 1.60 | 1.66 | 1.62 | 4.12 | |
| YEAR OF OCCURRENCE | 1961 | 1956 | 1986 | 1989 | 1980 | 1962 | 2001 | 1989 | 1961 | 1986 | 1964 | 1955 | AUG 1989 | ||
| NORMAL NO. DAYS WITH: | |||||||||||||||
| PRECIPITATION 0.01 | 30 | 7.7 | 8.0 | 7.3 | 5.8 | 7.1 | 7.9 | 11.5 | 13.4 | 14.5 | 12.2 | 9.6 | 11.0 | 116.0 | |
| PRECIPITATION 1.00 | 30 | * | 0.0 | * | 0.0 | 0.0 | 0.1 | 0.1 | 0.1 | 0.2 | * | * | 0.0 | 0.5 | |
| SNOWFALL | NORMAL (IN) | 30 | 8.8 | 11.0 | 9.1 | 5.8 | 0.2 | 0.0 | 0.0 | 0.0 | 0.3 | 8.0 | 10.5 | 13.9 | 67.6 |
| MAXIMUM MONTHLY (IN) | 48 | 28.6 | 52.1 | 31.0 | 27.6 | 6.1 | 0.0 | 0.0 | T | 4.6 | 28.1 | 38.8 | 41.6 | 52.1 | |
| YEAR OF OCCURRENCE | 2000 | 1996 | 1979 | 1963 | 2001 | 1997 | 1965 | 1996 | 1994 | 1955 | FEB 1996 | ||||
| MAXIMUM IN 24 HOURS (IN) | 48 | 10.5 | 13.9 | 14.5 | 9.1 | 5.0 | 0.0 | 0.0 | T | 3.5 | 14.6 | 16.4 | 17.7 | 17.7 | |
| YEAR OF OCCURRENCE | 1955 | 1996 | 1959 | 1955 | 2001 | 1997 | 1965 | 1996 | 1964 | 1955 | DEC 1955 | ||||
| MAXIMUM SNOW DEPTH (IN) | 47 | 833 | 840 | 906 | 356 | 17 | 0 | 0 | 0 | 1 | 105 | 416 | 715 | 906 | |
| YEAR OF OCCURRENCE | 1956 | 1956 | 1959 | 1955 | 1955 | 1992 | 1991 | 1994 | 1994 | MAR 1959 | |||||
| NORMAL NO. DAYS WITH: | |||||||||||||||
| SNOWFALL 1.0 | 30 | 2.8 | 3.3 | 2.7 | 1.5 | 0.0 | 0.0 | 0.0 | 0.0 | 0.2 | 2.3 | 3.5 | 4.6 | 20.9 |
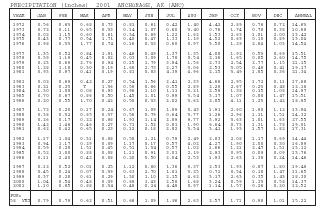
| PRECIPITATION (inches) 2001 ANCHORAGE, AK (ANC) | |||||||||||||
| YEAR | JAN | FEB | MAR | APR | MAY | JUN | JUL | AUG | SEP | OCT | NOV | DEC | ANNUAL |
| 1972 | 0.56 | 0.63 | 0.68 | 0.73 | 0.81 | 0.61 | 0.42 | 1.40 | 4.42 | 2.89 | 0.76 | 0.72 | 14.63 |
| 1973 | 0.72 | 0.11 | 0.65 | 0.33 | 0.14 | 1.07 | 0.60 | 3.40 | 0.76 | 1.74 | 0.78 | 0.38 | 10.68 |
| 1974 | 0.02 | 1.15 | 0.60 | 0.61 | 0.34 | 0.69 | 1.22 | 1.62 | 1.53 | 2.63 | 1.01 | 2.00 | 13.42 |
| 1975 | 0.43 | 0.77 | 0.54 | 1.71 | 0.40 | 0.47 | 1.33 | 1.19 | 4.52 | 0.69 | 0.10 | 0.89 | 13.04 |
| 1976 | 0.98 | 0.33 | 1.77 | 0.74 | 0.16 | 0.33 | 0.60 | 0.97 | 3.50 | 1.29 | 2.84 | 1.03 | 14.54 |
| 1977 | 1.35 | 0.52 | 0.84 | 1.91 | 0.46 | 0.49 | 1.37 | 1.35 | 4.08 | 1.92 | 0.53 | 0.69 | 15.51 |
| 1978 | 0.39 | 1.19 | 0.45 | 0.02 | 0.03 | 3.09 | 1.78 | 0.54 | 2.16 | 1.65 | 0.85 | 2.60 | 14.75 |
| 1979 | 0.23 | 0.69 | 2.76 | 0.94 | 0.15 | 1.79 | 3.84 | 1.56 | 2.73 | 2.54 | 2.77 | 1.15 | 21.15 |
| 1980 | 1.28 | 1.18 | 0.30 | 0.19 | 1.68 | 2.73 | 2.27 | 3.06 | 2.53 | 3.05 | 0.49 | 0.41 | 19.17 |
| 1981 | 0.93 | 0.97 | 0.41 | 0.19 | 0.81 | 0.83 | 4.39 | 4.96 | 2.15 | 3.49 | 1.85 | 0.36 | 21.34 |
| 1982 | 0.02 | 0.69 | 0.42 | 0.27 | 0.54 | 1.56 | 2.41 | 2.33 | 4.66 | 2.95 | 1.72 | 0.11 | 17.68 |
| 1983 | 0.21 | 0.23 | T | 1.36 | 0.59 | 0.66 | 0.55 | 2.89 | 2.29 | 2.67 | 0.23 | 0.48 | 12.16 |
| 1984 | 1.30 | 1.08 | 0.08 | 0.93 | 0.96 | 1.10 | 1.11 | 3.21 | 2.59 | 1.38 | 0.15 | 1.08 | 14.97 |
| 1985 | 0.70 | 0.67 | 0.86 | 0.50 | 1.45 | 1.01 | 0.99 | 3.54 | 3.17 | 1.07 | 0.08 | 1.47 | 15.51 |
| 1986 | 0.20 | 0.55 | 1.70 | 0.42 | 0.50 | 0.33 | 2.02 | 3.62 | 2.85 | 4.11 | 1.23 | 1.42 | 18.95 |
| 1987 | 1.72 | 0.20 | 0.17 | 0.24 | 0.67 | 1.09 | 1.89 | 0.43 | 1.91 | 2.60 | 1.90 | 1.12 | 13.94 |
| 1988 | 0.38 | 0.32 | 0.65 | 0.37 | 0.56 | 0.79 | 0.64 | 3.77 | 1.26 | 2.96 | 1.11 | 1.51 | 14.32 |
| 1989 | 0.26 | 0.17 | 0.22 | 0.98 | 1.93 | 1.14 | 2.89 | 9.77 | 3.92 | 3.63 | 1.01 | 1.63 | 27.55 |
| 1990 | 1.42 | 1.46 | 0.46 | 0.27 | 0.71 | 1.52 | 0.81 | 1.90 | 6.64 | 0.73 | 1.31 | 1.78 | 19.01 |
| 1991 | 0.62 | 0.42 | 0.65 | 0.23 | 0.12 | 0.18 | 2.82 | 3.54 | 3.41 | 1.93 | 1.57 | 1.82 | 17.31 |
| 1992 | 1.17 | 1.04 | 0.31 | 0.08 | 0.58 | 1.21 | 0.79 | 2.49 | 2.83 | 2.08 | 1.17 | 0.69 | 14.44 |
| 1993 | 0.94 | 1.17 | 0.29 | 0.09 | 1.17 | 0.17 | 0.57 | 4.02 | 4.27 | 1.90 | 2.00 | 0.30 | 16.89 |
| 1994 | 0.59 | 0.28 | 1.51 | 0.45 | 0.51 | 1.34 | 0.57 | 1.02 | 1.66 | 1.21 | 2.47 | 1.51 | 13.12 |
| 1995 | 0.52 | 1.00 | 0.88 | 0.08 | 1.11 | 0.91 | 3.01 | 2.19 | 2.93 | 0.95 | 0.09 | 0.09 | 13.76 |
| 1996 | 0.11 | 2.40 | 0.42 | 0.08 | 0.20 | 0.50 | 2.04 | 2.53 | 1.93 | 2.63 | 1.38 | 0.24 | 14.46 |
| 1997 | 0.12 | 0.52 | 0.01 | 0.25 | 1.12 | 0.60 | 1.36 | 8.37 | 2.53 | 1.93 | 0.87 | 1.80 | 19.48 |
| 1998 | 0.45 | 0.24 | 0.07 | 0.39 | 0.63 | 2.70 | 1.01 | 3.25 | 0.72 | 0.54 | 0.18 | 1.47 | 11.65 |
| 1999 | 0.37 | 0.28 | 0.61 | 0.29 | 1.30 | 1.10 | 2.15 | 4.62 | 3.17 | 2.63 | 0.35 | 1.43 | 18.30 |
| 2000 | 1.04 | 0.54 | 0.48 | 0.39 | 0.69 | 1.43 | 2.58 | 1.68 | 3.24 | 0.59 | 1.13 | 0.58 | 14.37 |
| 2001 | 1.10 | 0.85 | 0.88 | 0.34 | 0.48 | 0.24 | 4.49 | 0.97 | 1.14 | 1.57 | 0.26 | 0.20 | 12.52 |
| POR=58 YRS | 0.79 | 0.79 | 0.62 | 0.51 | 0.66 | 1.09 | 1.86 | 2.63 | 2.57 | 1.71 | 0.98 | 1.01 | 15.22 |
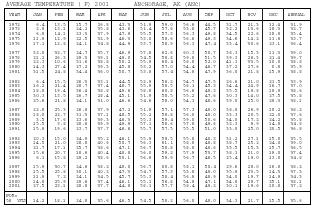
| AVERAGE TEMPERATURE (F) 2001 ANCHORAGE, AK (ANC) | |||||||||||||
| YEAR | JAN | FEB | MAR | APR | MAY | JUN | JUL | AUG | SEP | OCT | NOV | DEC | ANNUAL |
| 1972 | 6.4 | 13.5 | 15.7 | 26.8 | 43.3 | 51.9 | 59.0 | 56.6 | 44.5 | 31.7 | 21.3 | 12.4 | 31.9 |
| 1973 | 2.9 | 13.1 | 24.2 | 35.8 | 43.6 | 51.4 | 57.8 | 53.8 | 45.7 | 32.2 | 13.6 | 18.3 | 32.7 |
| 1974 | 6.8 | 14.1 | 23.3 | 37.9 | 47.9 | 55.5 | 57.3 | 56.3 | 49.8 | 34.5 | 22.6 | 18.8 | 35.4 |
| 1975 | 11.9 | 12.9 | 22.5 | 32.9 | 46.3 | 53.0 | 58.6 | 56.6 | 49.3 | 34.6 | 14.2 | 11.6 | 33.7 |
| 1976 | 17.1 | 12.8 | 24.1 | 34.8 | 44.9 | 53.7 | 58.9 | 56.3 | 47.4 | 33.4 | 30.6 | 23.1 | 36.4 |
| 1977 | 32.0 | 32.7 | 24.7 | 35.7 | 46.9 | 57.8 | 62.6 | 60.3 | 50.7 | 38.3 | 15.3 | 11.3 | 39.0 |
| 1978 | 21.2 | 26.3 | 29.3 | 39.1 | 49.0 | 54.5 | 58.8 | 59.8 | 51.5 | 39.3 | 26.3 | 21.4 | 39.7 |
| 1979 | 22.3 | 10.6 | 31.6 | 38.8 | 50.2 | 55.9 | 60.4 | 58.8 | 52.0 | 41.1 | 33.5 | 10.0 | 38.8 |
| 1980 | 14.3 | 27.4 | 27.2 | 39.3 | 45.8 | 53.2 | 57.0 | 54.4 | 46.7 | 37.2 | 27.6 | 0.8 | 35.9 |
| 1981 | 31.5 | 24.8 | 34.4 | 36.0 | 50.7 | 53.8 | 57.4 | 54.8 | 47.9 | 36.0 | 21.8 | 15.9 | 38.8 |
| 1982 | 6.4 | 15.5 | 26.3 | 33.1 | 44.5 | 52.9 | 56.2 | 54.7 | 47.5 | 26.6 | 21.0 | 21.5 | 33.9 |
| 1983 | 16.2 | 21.4 | 28.7 | 37.4 | 48.7 | 55.9 | 58.5 | 56.1 | 45.3 | 34.4 | 24.9 | 16.7 | 37.0 |
| 1984 | 18.8 | 19.4 | 36.4 | 38.8 | 49.6 | 58.8 | 60.8 | 56.6 | 49.3 | 35.5 | 19.8 | 18.9 | 38.6 |
| 1985 | 30.3 | 13.5 | 26.7 | 28.4 | 45.1 | 51.9 | 58.5 | 55.2 | 47.6 | 30.3 | 14.0 | 27.5 | 35.8 |
| 1986 | 25.6 | 21.8 | 24.1 | 31.0 | 46.6 | 54.6 | 58.0 | 54.3 | 48.6 | 39.0 | 25.0 | 28.3 | 38.1 |
| 1987 | 22.8 | 25.3 | 26.8 | 37.9 | 47.2 | 51.9 | 57.1 | 57.3 | 48.0 | 38.9 | 26.9 | 18.2 | 38.2 |
| 1988 | 18.0 | 22.7 | 31.3 | 37.1 | 48.5 | 55.2 | 58.8 | 56.0 | 48.0 | 33.3 | 20.5 | 22.0 | 37.6 |
| 1989 | 3.5 | 17.6 | 23.6 | 39.3 | 46.3 | 55.3 | 59.4 | 59.0 | 50.6 | 34.0 | 17.2 | 24.2 | 35.8 |
| 1990 | 15.5 | 3.8 | 28.6 | 39.9 | 49.9 | 57.1 | 58.6 | 57.8 | 49.6 | 32.3 | 9.9 | 14.8 | 34.8 |
| 1991 | 15.9 | 19.6 | 23.7 | 37.7 | 46.6 | 55.7 | 57.5 | 55.5 | 51.0 | 33.0 | 25.0 | 20.5 | 36.8 |
| 1992 | 20.3 | 15.0 | 24.9 | 35.2 | 46.1 | 55.9 | 59.5 | 55.8 | 40.3 | 31.2 | 27.1 | 15.0 | 35.5 |
| 1993 | 14.5 | 21.0 | 28.8 | 40.6 | 50.7 | 56.3 | 61.1 | 58.8 | 48.8 | 38.7 | 25.2 | 24.0 | 39.0 |
| 1994 | 21.7 | 17.1 | 25.7 | 38.6 | 47.1 | 56.7 | 58.8 | 58.8 | 48.6 | 33.5 | 15.3 | 15.7 | 36.5 |
| 1995 | 15.6 | 20.7 | 18.6 | 40.4 | 48.8 | 56.0 | 59.2 | 57.9 | 53.7 | 38.1 | 21.0 | 19.0 | 37.4 |
| 1996 | 6.1 | 15.8 | 29.2 | 38.6 | 50.1 | 56.9 | 59.9 | 56.7 | 46.5 | 25.4 | 19.0 | 13.0 | 34.8 |
| 1997 | 15.9 | 30.7 | 24.6 | 38.2 | 48.0 | 56.7 | 60.8 | 58.1 | 50.4 | 29.6 | 28.0 | 16.8 | 38.2 |
| 1998 | 15.5 | 25.8 | 30.1 | 40.2 | 47.3 | 54.7 | 57.3 | 53.8 | 49.0 | 35.9 | 23.5 | 14.3 | 37.3 |
| 1999 | 11.9 | 7.2 | 24.1 | 34.5 | 45.7 | 55.3 | 58.4 | 56.9 | 48.9 | 34.0 | 19.7 | 14.9 | 34.3 |
| 2000 | 14.8 | 25.9 | 29.6 | 37.4 | 46.1 | 55.1 | 56.8 | 54.8 | 47.1 | 34.8 | 29.7 | 25.1 | 38.1 |
| 2001 | 27.5 | 23.1 | 28.8 | 37.7 | 44.8 | 58.1 | 57.7 | 58.4 | 49.2 | 30.1 | 19.6 | 10.8 | 37.2 |
| POR=58 YRS | 14.2 | 18.1 | 24.8 | 35.6 | 46.5 | 54.5 | 58.2 | 56.0 | 48.0 | 34.3 | 21.7 | 15.5 | 35.6 |
REFERENCE NOTES:
PAGE 1:
THE TEMPERATURE GRAPH SHOWS NORMAL MAXIMUM AND NORMAL MINIMUM DAILY TEMPERATURES (SOLID CURVES) AND THE ACTUAL DAILY HIGH AND LOW TEMPERATURES (VERTICAL BARS).
PAGE 2 AND 3:
H/C INDICATES HEATING AND COOLING DEGREE DAYS.
RH INDICATES RELATIVE HUMIDITY
W/O INDICATES WEATHER AND OBSTRUCTIONS
S INDICATES SUNSHINE.
PR INDICATES PRESSURE.
CLOUDINESS ON PAGE 3 IS THE SUM OF THE CEILOMETER AND SATELLITE DATA NOT TO EXCEED EIGHT EIGHTHS (OKTAS).
GENERAL:
T INDICATES TRACE PRECIPITATION, AN AMOUNT GREATER THAN ZERO BUT LESS THAN THE LOWEST REPORTABLE VALUE.
+ INDICATES THE VALUE ALSO OCCURS ON EARLIER DATES.
BLANK ENTRIES DENOTE MISSING OR UNREPORTED DATA.
NORMALS ARE 30–YEAR AVERAGES (1961–1990).
ASOS INDICATES AUTOMATED SURFACE OBSERVING SYSTEM.
PM INDICATES THE LAST DAY OF THE PREVIOUS MONTH.
POR (PERIOD OF RECORD) BEGINS WITH THE JANUARY DATA MONTH AND IS THE NUMBER OF YEARS USED TO COMPUTE THE MEAN. INDIVIDUAL MONTHS WITHIN THE POR MAY BE MISSING.
WHEN THE POR FOR A NORMAL IS LESS THAN 30 YEARS, THE NORMAL IS PROVISIONAL AND IS BASED ON THE NUMBER OF YEARS INDICATED.
0.* OR * INDICATES THE VALUE OR MEAN–DAYS–WITH IS BETWEEN 0.00 AND 0.05.
CLOUDINESS FOR ASOS STATIONS DIFFERS FROM THE NON–ASOS OBSERVATION TAKEN BY A HUMAN OBSERVER. ASOS STATION CLOUDINESS IS BASED ON TIME–AVERAGED CEILOMETER DATA FOR CLOUDS AT OR BELOW 12,000 FEET AND ON SATELLITE DATA FOR CLOUDS ABOVE 12,000 FEET.
THE NUMBER OF DAYS WITH CLEAR, PARTLY CLOUDY, AND CLOUDY CONDITIONS FOR ASOS STATIONS IS THE SUM OF THE CEILOMETER AND SATELLITE DATA FOR THE SUNRISE TO SUNSET PERIOD.
GENERAL CONTINUED:
CLEAR INDICATES 0–2 OKTAS, PARTLY CLOUDY INDICATES 3–6 OKTAS, AND CLOUDY INDICATES 7 OR 8 OKTAS. WHEN AT LEAST ONE OF THE ELEMENTS (CEILOMETER OR SATELLITE) IS MISSING, THE DAILY CLOUDINESS IS NOT COMPUTED.
WIND DIRECTION IS RECORDED IN TENS OF DEGREES (2 DIGITS) CLOCKWISE FROM TRUE NORTH. "00" INDICATES CALM. "36" INDICATES TRUE NORTH.
RESULTANT WIND IS THE VECTOR AVERAGE OF THE SPEED AND DIRECTION.
AVERAGE TEMPERATURE IS THE SUM OF THE MEAN DAILY MAXIMUM AND MINIMUM TEMPERATURE DIVIDED BY 2.
SNOWFALL DATA COMPRISE ALL FORMS OF FROZEN PRECIPITATION, INCLUDING HAIL.
A HEATING (COOLING) DEGREE DAY IS THE DIFFERENCE BETWEEN THE AVERAGE DAILY TEMPERATURE AND 65 F.
DRY BULB IS THE TEMPERATURE OF THE AMBIENT AIR.
DEW POINT IS THE TEMPERATURE TO WHICH THE AIR MUST BE COOLED TO ACHIEVE 100 PERCENT RELATIVE HUMIDITY.
WET BULB IS THE TEMPERATURE THE AIR WOULD HAVE IF THE MOISTURE CONTENT WAS INCREASED TO 100 PERCENT RELATIVE HUMIDITY.
ON JULY 1, 1996, THE NATIONAL WEATHER SERVICE BEGAN USING THE "METAR" OBSERVATION CODE THAT WAS ALREADY EMPLOYED BY MOST OTHER NATIONS OF THE WORLD. THE MOST NOTICEABLE DIFFERENCE IN THIS ANNUAL PUBLICATION WILL BE THE CHANGE IN UNITS FROM TENTHS TO EIGHTS (OKTAS) FOR REPORTING THE AMOUNT OF SKY COVER.

| HEATING DEGREE DAYS (base 65 F) 2001 ANCHORAGE, AK (ANC) | |||||||||||||
| YEAR | JUL | AUG | SEP | OCT | NOV | DEC | JAN | FEB | MAR | APR | MAY | JUN | TOTAL |
| 1972–73 | 185 | 252 | 608 | 1025 | 1308 | 1627 | 1925 | 1448 | 1258 | 866 | 654 | 399 | 11555 |
| 1973-74 | 216 | 342 | 573 | 1012 | 1532 | 1440 | 1797 | 1416 | 1285 | 805 | 526 | 279 | 11223 |
| 1974-75 | 235 | 263 | 452 | 937 | 1263 | 1425 | 1643 | 1454 | 1313 | 954 | 575 | 354 | 10868 |
| 1975-76 | 192 | 252 | 463 | 937 | 1517 | 1654 | 1485 | 1511 | 1260 | 897 | 615 | 332 | 11115 |
| 1976-77 | 184 | 262 | 521 | 972 | 1028 | 1294 | 1017 | 897 | 1241 | 872 | 554 | 208 | 9050 |
| 1977-78 | 75 | 144 | 421 | 820 | 1486 | 1659 | 1349 | 1077 | 1100 | 771 | 491 | 308 | 9701 |
| 1978-79 | 186 | 160 | 400 | 792 | 1153 | 1344 | 1321 | 1515 | 1029 | 781 | 454 | 268 | 9403 |
| 1979-80 | 138 | 184 | 384 | 735 | 937 | 1704 | 1568 | 1083 | 1164 | 764 | 592 | 347 | 9600 |
| 1980–81 | 243 | 320 | 542 | 855 | 1115 | 1990 | 1032 | 1122 | 943 | 863 | 438 | 329 | 9792 |
| 1981–82 | 230 | 307 | 507 | 893 | 1290 | 1516 | 1813 | 1382 | 1191 | 949 | 625 | 356 | 11059 |
| 1982–83 | 261 | 313 | 520 | 1184 | 1315 | 1342 | 1507 | 1216 | 1117 | 821 | 500 | 267 | 10363 |
| 1983–84 | 194 | 269 | 585 | 945 | 1194 | 1491 | 1425 | 1319 | 880 | 778 | 471 | 179 | 9730 |
| 1984–85 | 129 | 254 | 464 | 906 | 1350 | 1423 | 1070 | 1437 | 1182 | 1091 | 610 | 388 | 10304 |
| 1985–86 | 193 | 298 | 516 | 1065 | 1523 | 1155 | 1215 | 1206 | 1260 | 1013 | 564 | 307 | 10315 |
| 1986–87 | 215 | 325 | 486 | 800 | 1194 | 1133 | 1303 | 1104 | 1176 | 805 | 543 | 386 | 9470 |
| 1987–88 | 243 | 232 | 506 | 801 | 1136 | 1444 | 1450 | 1221 | 1037 | 830 | 504 | 285 | 9689 |
| 1988-89 | 184 | 270 | 503 | 975 | 1331 | 1326 | 1908 | 1322 | 1277 | 765 | 573 | 286 | 10720 |
| 1989-90 | 173 | 181 | 423 | 956 | 1428 | 1255 | 1533 | 1715 | 1121 | 746 | 465 | 237 | 10233 |
| 1990-91 | 191 | 222 | 457 | 1006 | 1648 | 1552 | 1518 | 1265 | 1273 | 813 | 563 | 273 | 10781 |
| 1991-92 | 226 | 287 | 414 | 988 | 1193 | 1373 | 1380 | 1444 | 1240 | 891 | 579 | 268 | 10283 |
| 1992-93 | 161 | 280 | 735 | 1039 | 1131 | 1543 | 1563 | 1226 | 1117 | 725 | 436 | 252 | 10208 |
| 1993-94 | 125 | 187 | 477 | 808 | 1191 | 1267 | 1334 | 1335 | 1212 | 785 | 548 | 243 | 9512 |
| 1994-95 | 183 | 190 | 485 | 968 | 1488 | 1523 | 1526 | 1239 | 1433 | 734 | 496 | 265 | 10530 |
| 1995-96 | 172 | 214 | 335 | 826 | 1314 | 1425 | 1827 | 1423 | 1102 | 783 | 456 | 239 | 10116 |
| 1996-97 | 151 | 251 | 549 | 1220 | 1375 | 1608 | 1516 | 956 | 1246 | 796 | 520 | 249 | 10437 |
| 1997-98 | 123 | 207 | 432 | 1090 | 1103 | 1486 | 1530 | 1093 | 1073 | 739 | 540 | 302 | 9718 |
| 1998-99 | 232 | 340 | 475 | 895 | 1240 | 1566 | 1638 | 1611 | 1262 | 908 | 592 | 286 | 11045 |
| 1999-00 | 204 | 248 | 478 | 953 | 1352 | 1544 | 1548 | 1126 | 1090 | 821 | 579 | 291 | 10234 |
| 2000–01 | 245 | 312 | 534 | 931 | 1052 | 1230 | 1154 | 1168 | 1113 | 812 | 618 | 199 | 9368 |
| 2001– | 220 | 200 | 466 | 1072 | 1356 | 1673 | |||||||
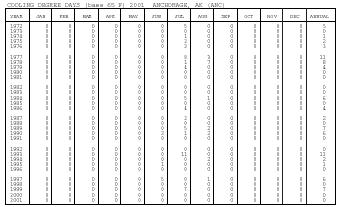
| COOLING DEGREE DAYS (base 65 F) 2001 ANCHORAGE, AK (ANC) | |||||||||||||
| YEAR | JAN | FEB | MAR | APR | MAY | JUN | JUL | AUG | SEP | OCT | NOV | DEC | ANNUAL |
| 1972 | 0 | 0 | 0 | 0 | 0 | 0 | 5 | 0 | 0 | 0 | 0 | 0 | 5 |
| 1973 | 0 | 0 | 0 | 0 | 0 | 0 | 0 | 0 | 0 | 0 | 0 | 0 | 0 |
| 1974 | 0 | 0 | 0 | 0 | 0 | 0 | 1 | 0 | 0 | 0 | 0 | 0 | 1 |
| 1975 | 0 | 0 | 0 | 0 | 0 | 0 | 2 | 0 | 0 | 0 | 0 | 0 | 2 |
| 1976 | 0 | 0 | 0 | 0 | 0 | 0 | 3 | 0 | 0 | 0 | 0 | 0 | 3 |
| 1977 | 0 | 0 | 0 | 0 | 0 | 0 | 8 | 3 | 0 | 0 | 0 | 0 | 11 |
| 1978 | 0 | 0 | 0 | 0 | 0 | 0 | 1 | 7 | 0 | 0 | 0 | 0 | 8 |
| 1979 | 0 | 0 | 0 | 0 | 0 | 0 | 4 | 0 | 0 | 0 | 0 | 0 | 4 |
| 1980 | 0 | 0 | 0 | 0 | 0 | 0 | 0 | 0 | 0 | 0 | 0 | 0 | 0 |
| 1981 | 0 | 0 | 0 | 0 | 0 | 0 | 0 | 0 | 0 | 0 | 0 | 0 | 0 |
| 1982 | 0 | 0 | 0 | 0 | 0 | 0 | 0 | 0 | 0 | 0 | 0 | 0 | 0 |
| 1983 | 0 | 0 | 0 | 0 | 0 | 0 | 0 | 0 | 0 | 0 | 0 | 0 | 0 |
| 1984 | 0 | 0 | 0 | 0 | 0 | 0 | 5 | 1 | 0 | 0 | 0 | 0 | 6 |
| 1985 | 0 | 0 | 0 | 0 | 0 | 0 | 0 | 0 | 0 | 0 | 0 | 0 | 0 |
| 1986 | 0 | 0 | 0 | 0 | 0 | 0 | 4 | 0 | 0 | 0 | 0 | 0 | 4 |
| 1987 | 0 | 0 | 0 | 0 | 0 | 0 | 2 | 0 | 0 | 0 | 0 | 0 | 2 |
| 1988 | 0 | 0 | 0 | 0 | 0 | 0 | 0 | 0 | 0 | 0 | 0 | 0 | 0 |
| 1989 | 0 | 0 | 0 | 0 | 0 | 0 | 5 | 2 | 0 | 0 | 0 | 0 | 7 |
| 1990 | 0 | 0 | 0 | 0 | 0 | 3 | 1 | 2 | 0 | 0 | 0 | 0 | 6 |
| 1991 | 0 | 0 | 0 | 0 | 0 | 0 | 0 | 0 | 0 | 0 | 0 | 0 | 0 |
| 1992 | 0 | 0 | 0 | 0 | 0 | 0 | 0 | 0 | 0 | 0 | 0 | 0 | 0 |
| 1993 | 0 | 0 | 0 | 0 | 0 | 0 | 11 | 0 | 0 | 0 | 0 | 0 | 11 |
| 1994 | 0 | 0 | 0 | 0 | 0 | 0 | 0 | 2 | 0 | 0 | 0 | 0 | 2 |
| 1995 | 0 | 0 | 0 | 0 | 0 | 1 | 0 | 0 | 0 | 0 | 0 | 0 | 1 |
| 1996 | 0 | 0 | 0 | 0 | 0 | 0 | 0 | 0 | 0 | 0 | 0 | 0 | 0 |
| 1997 | 0 | 0 | 0 | 0 | 0 | 5 | 0 | 1 | 0 | 0 | 0 | 0 | 6 |
| 1998 | 0 | 0 | 0 | 0 | 0 | 0 | 0 | 0 | 0 | 0 | 0 | 0 | 0 |
| 1999 | 0 | 0 | 0 | 0 | 0 | 0 | 7 | 0 | 0 | 0 | 0 | 0 | 7 |
| 2000 | 0 | 0 | 0 | 0 | 0 | 0 | 0 | 0 | 0 | 0 | 0 | 0 | 0 |
| 2001 | 0 | 0 | 0 | 0 | 0 | 0 | 0 | 0 | 0 | 0 | 0 | 0 | 0 |
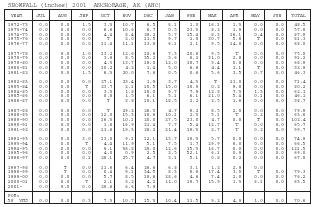
| SNOWFALL (inches) 2001 ANCHORAGE, AK (ANC) | |||||||||||||
| YEAR | JUL | AUG | SEP | OCT | NOV | DEC | JAN | FEB | MAR | APR | MAY | JUN | TOTAL |
| 1972-73 | 0.0 | 0.0 | 1.5 | 3.3 | 10.7 | 6.5 | 8.1 | 1.0 | 16.1 | 1.3 | 0.0 | 0.0 | 48.5 |
| 1973-74 | 0.0 | 0.0 | 0.0 | 6.6 | 10.6 | 6.7 | 0.5 | 23.3 | 8.2 | 1.9 | 0.0 | 0.0 | 57.8 |
| 1974-75 | 0.0 | 0.0 | 0.0 | 4.4 | 8.4 | 29.2 | 5.7 | 15.4 | 8.3 | 16.1 | 0.4 | 0.0 | 87.9 |
| 1975-76 | 0.0 | 0.0 | 0.0 | T | 2.0 | 11.5 | 9.7 | 1.8 | 30.7 | 5.6 | T | 0.0 | 61.3 |
| 1976-77 | 0.0 | 0.0 | 0.0 | 11.4 | 11.1 | 13.8 | 6.1 | 2.1 | 9.5 | 14.0 | 0.0 | 0.0 | 68.0 |
| 1977-78 | 0.0 | 0.0 | 1.0 | 13.2 | 12.6 | 10.6 | 7.3 | 20.8 | 9.5 | T | 0.0 | 0.0 | 75.0 |
| 1978-79 | 0.0 | 0.0 | 0.0 | 3.9 | 8.5 | 35.2 | 3.6 | 6.2 | 31.0 | 2.8 | 0.0 | 0.0 | 91.2 |
| 1979-80 | 0.0 | 0.0 | 0.0 | 4.3 | 13.7 | 16.0 | 12.0 | 18.7 | 3.4 | 0.8 | 0.0 | 0.0 | 68.9 |
| 1980–81 | 0.0 | 0.0 | 0.0 | 10.2 | 4.2 | 1.4 | 5.0 | 6.6 | 4.4 | 1.1 | T | 0.0 | 32.9 |
| 1981–82 | 0.0 | 0.0 | 1.5 | 6.3 | 20.0 | 7.6 | 0.5 | 0.6 | 5.6 | 3.5 | 0.7 | 0.0 | 46.3 |
| 1982–83 | 0.0 | 0.0 | 0.0 | 27.1 | 23.4 | 1.9 | 3.7 | 4.3 | T | 11.0 | 0.0 | 0.0 | 71.4 |
| 1983–84 | 0.0 | 0.0 | T | 23.7 | 2.1 | 10.5 | 15.0 | 18.9 | 0.2 | 9.8 | 0.0 | 0.0 | 80.2 |
| 1984–85 | 0.0 | 0.0 | 0.0 | 3.3 | 1.8 | 18.0 | 9.7 | 7.9 | 12.8 | 7.3 | 1.3 | 0.0 | 62.1 |
| 1985–86 | 0.0 | 0.0 | 0.0 | 0.8 | 1.5 | 6.1 | 5.1 | 6.1 | 21.0 | 5.4 | 0.1 | 0.0 | 46.1 |
| 1986–87 | 0.0 | 0.0 | 0.0 | T | 3.8 | 10.1 | 18.5 | 2.2 | 2.5 | 1.6 | 0.0 | 0.0 | 38.7 |
| 1987–88 | 0.0 | 0.0 | 0.0 | T | 29.2 | 26.3 | 4.7 | 9.2 | 8.5 | 2.0 | 0.0 | 0.0 | 79.9 |
| 1988-89 | 0.0 | 0.0 | 0.0 | 12.0 | 15.3 | 18.6 | 10.1 | 2.3 | 5.1 | T | 0.2 | 0.0 | 63.6 |
| 1989-90 | 0.0 | 0.0 | 0.0 | 16.3 | 10.1 | 20.0 | 27.5 | 23.0 | 4.7 | 0.8 | T | 0.0 | 102.4 |
| 1990-91 | 0.0 | 0.0 | 0.0 | 1.6 | 16.9 | 21.4 | 7.7 | 5.4 | 12.7 | T | 0.0 | 0.0 | 65.7 |
| 1991-92 | 0.0 | 0.0 | 0.0 | 11.6 | 19.3 | 26.2 | 21.4 | 18.3 | 2.7 | T | 0.2 | 0.0 | 99.7 |
| 1992-93 | 0.0 | 0.0 | 3.0 | 13.0 | 9.1 | 12.1 | 13.7 | 18.3 | 5.7 | 0.0 | 0.0 | 0.0 | 74.9 |
| 1993-94 | 0.0 | 0.0 | T | 4.4 | 11.9 | 5.1 | 7.5 | 1.7 | 29.9 | 6.0 | 0.0 | 0.0 | 66.5 |
| 1994–95 | 0.0 | 0.0 | 0.0 | 9.1 | 38.8 | 29.0 | 12.6 | 15.3 | 16.7 | 0.0 | 0.0 | 0.0 | 121.5 |
| 1995–96 | 0.0 | 0.0 | 0.0 | 4.0 | 0.9 | 2.5 | 2.5 | 52.1 | 6.1 | 0.9 | 0.0 | 0.0 | 69.0 |
| 1996–97 | 0.0 | 0.0 | 0.1 | 28.1 | 25.7 | 4.7 | 3.1 | 5.1 | 0.8 | 0.2 | 0.0 | 0.0 | 67.8 |
| 1997-98 | 0.0 | T | 0.0 | 11.6 | 6.4 | 26.6 | 6.8 | 3.1 | 1.2 | 2.9 | 0.0 | ||
| 1998-99 | 0.0 | T | 0.0 | 0.4 | 9.1 | 34.5 | 8.3 | 6.6 | 17.4 | 3.0 | T | 0.0 | 79.3 |
| 1999-00 | 0.0 | 0.0 | 0.0 | 5.7 | 8.5 | 18.6 | 28.6 | 4.6 | 7.4 | 2.8 | 0.0 | 0.0 | 76.2 |
| 2000–01 | 0.0 | 0.0 | T | 2.1 | 3.2 | 4.2 | 11.0 | 19.7 | 15.9 | 1.3 | 6.1 | 0.0 | 63.5 |
| 2001– | 0.0 | 0.0 | 0.0 | 20.6 | 6.6 | 7.9 | |||||||
| POR=58 YRS | 0.0 | 0.0 | 0.3 | 7.3 | 10.7 | 15.3 | 10.4 | 11.5 | 9.2 | 4.9 | 1.0 | 0.0 | 70.6 |