2001 MADISON, WISCONSIN (MSN)
Madison is set on a narrow isthmus of land between Lakes Mendota and Monona. Lake Mendota (15 square miles) lies northwest of Lake Monona (5 square miles) and the lakes are only two–thirds of a mile apart at one point. Drainage at Madison is southeast through two other lakes into the Rock River, which flows south into Illinois, and then west to the Mississippi. The westward flowing Wisconsin River is only 20 miles northwest of Madison. Madison lakes are normally frozen from mid–December to early April.
Madison has the typical continental climate of interior North America with a large annual temperature range and with frequent short period temperature changes. The range of extreme temperatures is from about 110 to –40 degrees. Winter temperatures (December–February) average near 20 degrees and the summer average (June–August) is in the upper 60s. Daily temperatures average below 32 degrees about 120 days and above 40 degrees for about 210 days of the year.
Madison lies in the path of the frequent cyclones and anticyclones which move eastward over this area during fall, winter and spring. In summer, the cyclones have diminished intensity and tend to pass farther north. The most frequent air masses are of polar origin. Occasional outbreaks of arctic air affect this area during the winter months. Although northward moving tropical air masses contribute considerable cloudiness and precipitation, the true Gulf air mass does not reach this area in winter, and only occasionally at other seasons. Summers are pleasant, with only occasional periods of extreme heat or high humidity.
There are no dry and wet seasons, but about 60 percent of the annual precipitation falls in the five months of May through September. Cold season precipitation is lighter, but lasts longer. Soil moisture is usually adequate in the first part of the growing season. During July, August, and September, the crops depend on current rainfall, which is mostly from thunderstorms and tends to be erratic and variable. Average occurrence of thunderstorms is just under 7 days per month during this period.
March and November are the windiest months. Tornadoes are infrequent. Dane County has about one tornado in every three to five years.
The ground is covered with 1 inch or more of snow about 60 percent of the time from about December 10 to near February 25 in an average winter. The soil is usually frozen from the first of December through most of March with an average frost penetration of 25 to 30 inches. The growing season averages 175 days.
Farming is diversified with the main emphasis on dairying. Field crops are mainly corn, oats, clover, and alfalfa, but barley, wheat, rye, and tobacco are also raised. Canning factories pack peas, sweet corn, and lima beans. Fruits are mainly apples, strawberries, and raspberries.
NORMALS, MEANS, AND EXTREMES
MADISON, WI (MSN)
LATITUDE: LONGITUDE: ELEVATION (FT): TIME ZONE: WBAN: 14837
43 08′ 26″ N 89 20′ 43″ W GRND: 857 BARO: 860 CENTRAL (UTC + 6)
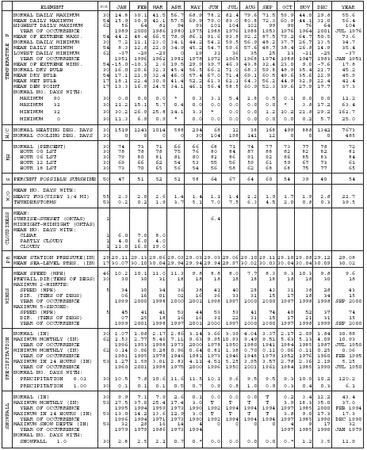
| ELEMENT | POR | JAN | FEB | MAR | APR | MAY | JUN | JUL | AUG | SEP | OCT | NOV | DEC | YEAR | |
| TEMPERATURE F | NORMAL DAILY MAXIMUM | 30 | 24.8 | 30.1 | 41.5 | 56.7 | 68.9 | 78.2 | 82.4 | 79.6 | 71.5 | 59.9 | 44.0 | 29.8 | 55.6 |
| MEAN DAILY MAXIMUM | 54 | 25.9 | 30.9 | 42.1 | 57.5 | 69.9 | 79.0 | 83.0 | 80.8 | 72.3 | 60.9 | 44.1 | 31.0 | 56.4 | |
| HIGHEST DAILY MAXIMUM | 62 | 56 | 64 | 82 | 94 | 93 | 101 | 104 | 102 | 99 | 90 | 76 | 64 | 104 | |
| YEAR OF OCCURRENCE | 1989 | 2000 | 1986 | 1980 | 1975 | 1988 | 1976 | 1988 | 1953 | 1976 | 1964 | 2001 | JUL 1976 | ||
| MEAN OF EXTREME MAXS. | 54 | 44.2 | 48.4 | 66.5 | 78.9 | 86.1 | 91.6 | 93.8 | 92.2 | 87.5 | 79.2 | 64.7 | 50.5 | 73.6 | |
| NORMAL DAILY MINIMUM | 30 | 7.2 | 11.1 | 23.0 | 34.1 | 44.2 | 54.2 | 59.5 | 56.9 | 48.2 | 37.7 | 26.7 | 13.5 | 34.7 | |
| MEAN DAILY MINIMUM | 54 | 8.3 | 12.8 | 22.9 | 34.9 | 45.2 | 54.7 | 59.6 | 57.6 | 48.7 | 38.4 | 26.8 | 14.9 | 35.4 | |
| LOWEST DAILY MINIMUM | 62 | -37 | -29 | -29 | 0 | 19 | 31 | 36 | 35 | 25 | 13 | -11 | -25 | -37 | |
| YEAR OF OCCURRENCE | 1951 | 1996 | 1962 | 1982 | 1978 | 1972 | 1965 | 1968 | 1974 | 1988 | 1947 | 1983 | JAN 1951 | ||
| MEAN OF EXTREME MINS. | 54 | -15.0 | -10.3 | 2.6 | 19.5 | 29.9 | 39.7 | 46.3 | 43.8 | 32.4 | 23.0 | 9.0 | -7.6 | 17.8 | |
| NORMAL DRY BULB | 30 | 16.0 | 20.6 | 32.3 | 45.4 | 56.5 | 66.2 | 71.0 | 68.3 | 59.8 | 48.9 | 35.4 | 21.7 | 45.2 | |
| MEAN DRY BULB | 54 | 17.1 | 21.9 | 32.4 | 46.0 | 57.4 | 67.0 | 71.4 | 69.1 | 60.5 | 49.6 | 35.6 | 22.9 | 45.9 | |
| MEAN WET BULB | 17 | 18.1 | 22.4 | 30.9 | 41.4 | 52.2 | 61.3 | 62.1 | 64.3 | 56.2 | 44.9 | 32.9 | 22.4 | 42.4 | |
| MEAN DEW POINT | 17 | 13.3 | 16.9 | 24.5 | 34.1 | 46.1 | 56.4 | 58.5 | 60.9 | 52.3 | 39.6 | 27.9 | 17.7 | 37.3 | |
| NORMAL NO. DAYS WITH: | |||||||||||||||
| MAXIMUM 90 | 30 | 0.0 | 0.0 | 0.0 | * | 0.3 | 3.1 | 5.4 | 2.8 | 0.5 | 0.1 | 0.0 | 0.0 | 12.2 | |
| MAXIMUM 32 | 30 | 21.2 | 15.1 | 5.7 | 0.4 | 0.0 | 0.0 | 0.0 | 0.0 | 0.0 | * | 3.8 | 17.2 | 63.4 | |
| MINIMUM 32 | 30 | 30.2 | 26.9 | 25.8 | 14.1 | 3.3 | * | 0.0 | 0.0 | 1.2 | 10.2 | 21.8 | 29.2 | 162.7 | |
| MINIMUM 0 | 30 | 11.3 | 6.9 | 0.9 | * | 0.0 | 0.0 | 0.0 | 0.0 | 0.0 | 0.0 | 0.2 | 5.7 | 25.0 | |
| H/C | NORMAL HEATING DEG. DAYS | 30 | 1519 | 1243 | 1014 | 588 | 294 | 68 | 12 | 38 | 168 | 499 | 888 | 1342 | 7673 |
| NORMAL COOLING DEG. DAYS | 30 | 0 | 0 | 0 | 0 | 30 | 104 | 198 | 141 | 12 | 0 | 0 | 0 | 485 | |
| RH | NORMAL (PERCENT) | 30 | 74 | 73 | 71 | 66 | 66 | 68 | 71 | 74 | 77 | 73 | 77 | 78 | 72 |
| HOUR 00 LST | 30 | 78 | 78 | 78 | 75 | 76 | 80 | 84 | 87 | 88 | 82 | 82 | 82 | 81 | |
| HOUR 06 LST | 30 | 79 | 80 | 81 | 81 | 80 | 82 | 86 | 91 | 92 | 86 | 85 | 83 | 84 | |
| HOUR 12 LST | 30 | 69 | 66 | 62 | 54 | 53 | 55 | 56 | 59 | 61 | 59 | 67 | 73 | 61 | |
| HOUR 18 LST | 30 | 73 | 70 | 65 | 56 | 54 | 56 | 58 | 62 | 68 | 68 | 75 | 77 | 65 | |
| S | PERCENT POSSIBLE SUNSHINE | 50 | 47 | 51 | 52 | 52 | 58 | 64 | 67 | 64 | 60 | 54 | 39 | 40 | 54 |
| W/O | MEAN NO. DAYS WITH: | ||||||||||||||
| HEAVY FOG (VISBY 1/4 MI) | 55 | 2.3 | 2.0 | 2.6 | 1.4 | 1.4 | 1.1 | 1.4 | 2.2 | 1.9 | 1.7 | 1.9 | 2.8 | 22.7 | |
| THUNDERSTORMS | 53 | 0.2 | 0.2 | 1.9 | 3.7 | 5.1 | 7.0 | 7.5 | 6.3 | 4.5 | 2.0 | 0.8 | 0.3 | 39.5 | |
| CLOUDINESS | MEAN: | ||||||||||||||
| SUNRISE-SUNSET (OKTAS) | 1 | 6.4 | |||||||||||||
| MIDNIGHT-MIDNIGHT (OKTAS) | |||||||||||||||
| MEAN NO. DAYS WITH: | |||||||||||||||
| CLEAR | 1 | 6.0 | 7.0 | 8.0 | |||||||||||
| PARTLY CLOUDY | 1 | 4.0 | 6.0 | 4.0 | |||||||||||
| CLOUDY | 1 | 21.0 | 16.0 | 19.0 | |||||||||||
| PR | MEAN STATION PRESSURE(IN) | 29 | 29.11 | 29.13 | 29.06 | 29.03 | 29.03 | 29.03 | 29.06 | 29.10 | 29.11 | 29.10 | 29.08 | 29.12 | 29.08 |
| MEAN SEA-LEVEL PRES. (IN) | 17 | 30.07 | 30.10 | 30.04 | 29.94 | 29.94 | 29.94 | 29.97 | 30.02 | 30.03 | 30.04 | 30.04 | 30.09 | 30.02 | |
| WINDS | MEAN SPEED (MPH) | 46 | 10.2 | 10.1 | 11.0 | 11.3 | 9.8 | 8.8 | 8.0 | 7.7 | 8.3 | 9.3 | 10.3 | 9.8 | 9.6 |
| PREVAIL. DIR (TENS OF DEGS) | 30 | 30 | 30 | 31 | 18 | 18 | 18 | 18 | 18 | 18 | 18 | 18 | 30 | 18 | |
| MAXIMUM 2-MINUTE: | |||||||||||||||
| SPEED (MPH) | 5 | 34 | 30 | 34 | 36 | 38 | 41 | 40 | 28 | 43 | 31 | 38 | 28 | 43 | |
| DIR. (TENS OF DEGS) | 06 | 16 | 01 | 02 | 16 | 36 | 33 | 31 | 15 | 17 | 18 | 34 | 15 | ||
| YEAR OF OCCURRENCE | 1999 | 2000 | 1998 | 2000 | 2001 | 1998 | 1997 | 2000 | 2000 | 1997 | 1998 | 1998 | SEP 2000 | ||
| MAXIMUM 5-SECOND: | |||||||||||||||
| SPEED (MPH) | 5 | 45 | 41 | 41 | 53 | 44 | 53 | 53 | 41 | 74 | 40 | 52 | 37 | 74 | |
| DIR. (TENS OF DEGS) | 07 | 25 | 18 | 26 | 16 | 31 | 22 | 31 | 15 | 17 | 21 | 31 | 15 | ||
| YEAR OF OCCURRENCE | 1999 | 2001 | 1998 | 1997 | 2001 | 2000 | 1997 | 2000 | 2000 | 1997 | 1998 | 1999 | SEP 2000 | ||
| PRECIPITATION | NORMAL (IN) | 30 | 1.07 | 1.08 | 2.17 | 2.86 | 3.14 | 3.66 | 3.39 | 4.04 | 3.37 | 2.17 | 2.09 | 1.84 | 30.88 |
| MAXIMUM MONTHLY (IN) | 62 | 2.53 | 2.77 | 5.46 | 7.11 | 9.63 | 9.95 | 10.93 | 9.49 | 9.51 | 5.63 | 5.13 | 4.09 | 10.93 | |
| YEAR OF OCCURRENCE | 1996 | 1953 | 1998 | 1973 | 2000 | 1978 | 1950 | 1980 | 1941 | 1984 | 1985 | 1987 | JUL 1950 | ||
| MINIMUM MONTHLY (IN) | 62 | 0.14 | 0.06 | 0.28 | 0.96 | 0.64 | 0.81 | 1.38 | 0.70 | 0.11 | 0.06 | 0.11 | 0.25 | 0.06 | |
| YEAR OF OCCURRENCE | 1981 | 1995 | 1978 | 1946 | 1981 | 1973 | 1946 | 1948 | 1979 | 1952 | 1976 | 1960 | FEB 1995 | ||
| MAXIMUM IN 24 HOURS (IN) | 53 | 1.27 | 1.59 | 3.01 | 2.83 | 4.11 | 4.51 | 5.25 | 3.95 | 3.57 | 2.78 | 2.36 | 2.19 | 5.25 | |
| YEAR OF OCCURRENCE | 1960 | 2001 | 1998 | 1975 | 2000 | 1996 | 1950 | 2001 | 1961 | 1984 | 1985 | 1990 | JUL 1950 | ||
| NORMAL NO. DAYS WITH: | |||||||||||||||
| PRECIPITATION 0.01 | 30 | 10.5 | 7.8 | 10.6 | 11.6 | 11.5 | 10.1 | 9.6 | 9.5 | 9.5 | 9.3 | 10.0 | 10.2 | 120.2 | |
| PRECIPITATION 1.00 | 30 | 0.1 | 0.1 | 0.1 | 0.5 | 0.7 | 0.9 | 0.8 | 1.0 | 0.9 | 0.3 | 0.4 | 0.3 | 6.1 | |
| SNOWFALL | NORMAL (IN) | 30 | 9.9 | 7.1 | 7.9 | 2.6 | 0.1 | 0.0 | 0.0 | 0.0 | T | 0.2 | 3.4 | 12.2 | 43.4 |
| MAXIMUM MONTHLY (IN) | 53 | 27.5 | 37.0 | 25.4 | 17.4 | 3.0 | T | T | T | T | 3.9 | 18.3 | 35.0 | 37.0 | |
| YEAR OF OCCURRENCE | 1995 | 1994 | 1959 | 1973 | 1990 | 1992 | 1994 | 1994 | 1994 | 1997 | 1985 | 2000 | FEB 1994 | ||
| MAXIMUM IN 24 HOURS (IN) | 53 | 13.0 | 14.2 | 13.6 | 12.9 | 3.0 | T | T | T | T | 3.8 | 9.0 | 17.3 | 17.3 | |
| YEAR OF OCCURRENCE | 1996 | 1994 | 1971 | 1973 | 1990 | 1992 | 1994 | 1994 | 1994 | 1997 | 1985 | 1990 | DEC 1990 | ||
| MAXIMUM SNOW DEPTH (IN) | 53 | 32 | 28 | 16 | 14 | 4 | 0 | 0 | 0 | 0 | 4 | 9 | 17 | 32 | |
| YEAR OF OCCURRENCE | 1979 | 1979 | 1986 | 1973 | 1994 | 1997 | 1985 | 1990 | JAN 1979 | ||||||
| NORMAL NO. DAYS WITH: | |||||||||||||||
| SNOWFALL 1.0 | 30 | 2.8 | 2.5 | 2.2 | 0.7 | 0.* | 0.0 | 0.0 | 0.0 | 0.0 | 0.* | 1.2 | 3.5 | 12.9 |
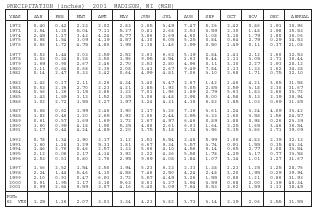
| PRECIPITATION (inches) 2001 MADISON, WI (MSN) | |||||||||||||
| YEAR | JAN | FEB | MAR | APR | MAY | JUN | JUL | AUG | SEP | OCT | NOV | DEC | ANNUAL |
| 1972 | 0.40 | 0.42 | 2.23 | 2.02 | 2.83 | 1.65 | 3.49 | 7.47 | 5.26 | 2.42 | 0.86 | 1.91 | 30.96 |
| 1973 | 1.54 | 1.20 | 5.04 | 7.11 | 5.27 | 0.81 | 2.68 | 2.53 | 3.59 | 2.30 | 1.48 | 1.98 | 35.53 |
| 1974 | 2.45 | 1.17 | 3.43 | 4.24 | 5.77 | 3.86 | 2.69 | 4.60 | 1.08 | 3.18 | 1.79 | 1.80 | 36.06 |
| 1975 | 0.98 | 1.54 | 3.09 | 4.19 | 4.57 | 4.30 | 6.05 | 5.25 | 0.84 | 0.64 | 2.79 | 0.29 | 34.53 |
| 1976 | 0.56 | 1.72 | 4.75 | 4.80 | 1.95 | 1.38 | 1.46 | 1.99 | 0.50 | 1.49 | 0.11 | 0.37 | 21.08 |
| 1977 | 0.53 | 1.44 | 3.03 | 2.59 | 2.52 | 2.63 | 6.63 | 5.19 | 2.84 | 1.41 | 2.12 | 1.60 | 32.53 |
| 1978 | 1.03 | 0.24 | 0.28 | 3.50 | 3.96 | 9.95 | 4.54 | 1.63 | 5.44 | 1.11 | 3.05 | 1.71 | 36.44 |
| 1979 | 1.69 | 0.90 | 2.67 | 2.46 | 2.70 | 2.53 | 2.80 | 4.96 | 0.11 | 3.10 | 2.27 | 1.93 | 28.12 |
| 1980 | 1.11 | 0.64 | 0.68 | 2.36 | 2.08 | 3.43 | 2.67 | 9.49 | 7.84 | 1.13 | 1.33 | 1.62 | 34.38 |
| 1981 | 0.14 | 2.47 | 0.33 | 3.42 | 0.64 | 4.99 | 4.81 | 7.06 | 3.10 | 2.68 | 1.71 | 0.75 | 32.10 |
| 1982 | 1.42 | 0.17 | 2.11 | 3.26 | 4.34 | 3.40 | 3.47 | 2.67 | 1.42 | 1.46 | 4.21 | 3.65 | 31.58 |
| 1983 | 0.53 | 2.26 | 2.70 | 2.23 | 4.21 | 1.85 | 1.92 | 5.05 | 2.85 | 2.59 | 3.18 | 2.30 | 31.67 |
| 1984 | 0.36 | 1.26 | 1.15 | 3.86 | 3.32 | 7.01 | 1.96 | 1.89 | 2.79 | 5.63 | 1.83 | 2.66 | 33.72 |
| 1985 | 1.43 | 1.89 | 3.13 | 1.52 | 3.35 | 3.06 | 4.48 | 2.98 | 5.00 | 4.58 | 5.13 | 2.39 | 38.94 |
| 1986 | 1.02 | 2.72 | 1.55 | 2.27 | 1.97 | 3.24 | 4.31 | 4.38 | 6.82 | 1.85 | 1.03 | 0.69 | 31.85 |
| 1987 | 0.68 | 0.62 | 1.99 | 2.46 | 3.90 | 1.17 | 3.26 | 7.16 | 3.61 | 1.24 | 3.24 | 4.09 | 33.42 |
| 1988 | 1.82 | 0.46 | 1.20 | 2.65 | 0.92 | 2.06 | 2.44 | 2.95 | 3.33 | 1.60 | 3.58 | 1.56 | 24.57 |
| 1989 | 0.61 | 0.57 | 1.69 | 1.69 | 1.72 | 1.67 | 4.97 | 6.46 | 0.89 | 1.88 | 0.98 | 0.26 | 23.39 |
| 1990 | 1.60 | 0.99 | 4.18 | 1.90 | 5.35 | 4.88 | 2.61 | 6.03 | 1.64 | 2.25 | 1.65 | 3.46 | 36.54 |
| 1991 | 1.17 | 0.44 | 4.24 | 4.89 | 2.20 | 3.75 | 5.18 | 2.34 | 3.96 | 5.35 | 3.86 | 1.71 | 39.09 |
| 1992 | 0.78 | 1.34 | 1.90 | 3.17 | 1.12 | 1.53 | 5.54 | 2.48 | 5.99 | 1.06 | 4.83 | 2.39 | 32.13 |
| 1993 | 1.60 | 1.18 | 3.29 | 5.33 | 3.81 | 6.67 | 9.34 | 5.57 | 3.74 | 0.91 | 1.55 | 0.35 | 43.34 |
| 1994 | 1.46 | 2.76 | 0.46 | 2.57 | 1.33 | 5.66 | 4.10 | 4.56 | 6.14 | 0.65 | 2.77 | 1.08 | 33.54 |
| 1995 | 2.12 | 0.06 | 2.17 | 4.14 | 3.92 | 1.22 | 4.36 | 5.58 | 1.78 | 4.29 | 3.17 | 0.77 | 33.58 |
| 1996 | 2.53 | 0.53 | 0.80 | 2.76 | 2.95 | 9.69 | 4.08 | 1.84 | 1.07 | 3.14 | 1.01 | 1.27 | 31.67 |
| 1997 | 1.36 | 2.52 | 1.54 | 2.50 | 1.94 | 5.23 | 6.23 | 2.33 | 1.38 | 1.23 | 1.25 | 1.25 | 28.76 |
| 1998 | 2.24 | 1.44 | 5.46 | 4.10 | 4.58 | 7.46 | 2.50 | 4.24 | 2.48 | 3.20 | 1.95 | 0.29 | 39.94 |
| 1999 | 2.10 | 0.91 | 0.47 | 6.91 | 3.72 | 5.57 | 4.49 | 3.26 | 1.55 | 0.88 | 1.21 | 0.86 | 31.93 |
| 2000 | 0.91 | 1.95 | 1.17 | 3.18 | 9.63 | 8.63 | 3.27 | 3.94 | 3.59 | 0.68 | 2.00 | 1.39 | 40.34 |
| 2001 | 0.99 | 2.64 | 0.59 | 3.07 | 4.16 | 5.40 | 3.09 | 7.64 | 5.53 | 2.62 | 1.59 | 1.13 | 38.45 |
| POR=62 YRS | 1.25 | 1.16 | 2.07 | 3.01 | 3.34 | 4.23 | 3.82 | 3.73 | 3.14 | 2.19 | 2.06 | 1.55 | 31.55 |
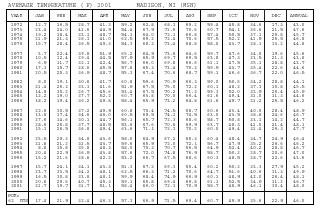
| AVERAGE TEMPERATURE (F) 2001 MADISON, WI (MSN) | |||||||||||||
| YEAR | JAN | FEB | MAR | APR | MAY | JUN | JUL | AUG | SEP | OCT | NOV | DEC | ANNUAL |
| 1972 | 12.7 | 16.5 | 28.7 | 41.3 | 59.2 | 62.8 | 68.3 | 69.2 | 59.4 | 45.8 | 34.6 | 17.3 | 43.0 |
| 1973 | 23.4 | 24.0 | 41.6 | 44.9 | 54.4 | 67.9 | 71.6 | 70.6 | 60.7 | 54.1 | 36.6 | 21.5 | 47.6 |
| 1974 | 19.2 | 18.4 | 33.1 | 48.7 | 54.1 | 64.0 | 72.1 | 66.8 | 57.4 | 50.5 | 37.1 | 26.8 | 45.7 |
| 1975 | 21.9 | 21.3 | 26.1 | 41.0 | 62.5 | 69.2 | 72.4 | 70.6 | 57.5 | 52.2 | 41.9 | 25.5 | 46.8 |
| 1976 | 15.7 | 28.4 | 36.5 | 49.3 | 54.3 | 68.3 | 73.4 | 68.8 | 58.0 | 43.7 | 28.1 | 13.2 | 44.8 |
| 1977 | 3.7 | 22.4 | 39.8 | 51.9 | 65.2 | 64.9 | 73.6 | 64.6 | 59.7 | 47.6 | 34.0 | 19.6 | 45.6 |
| 1978 | 10.5 | 12.4 | 29.4 | 44.5 | 57.9 | 65.9 | 69.7 | 69.5 | 63.8 | 47.3 | 33.5 | 21.3 | 43.8 |
| 1979 | 6.9 | 11.7 | 32.1 | 42.4 | 56.7 | 66.0 | 69.8 | 66.6 | 61.1 | 47.5 | 35.1 | 28.8 | 43.7 |
| 1980 | 17.3 | 15.7 | 28.0 | 45.5 | 57.8 | 65.3 | 73.4 | 70.3 | 59.9 | 43.7 | 35.4 | 22.6 | 44.6 |
| 1981 | 20.5 | 25.3 | 36.9 | 48.7 | 55.3 | 67.4 | 70.6 | 68.7 | 59.1 | 46.6 | 36.7 | 22.0 | 46.5 |
| 1982 | 8.0 | 19.1 | 30.6 | 41.7 | 60.8 | 59.6 | 70.9 | 66.3 | 59.0 | 50.6 | 34.2 | 28.8 | 44.1 |
| 1983 | 21.4 | 26.3 | 33.1 | 41.6 | 51.9 | 67.5 | 75.0 | 72.2 | 60.1 | 48.2 | 37.3 | 10.8 | 45.5 |
| 1984 | 14.8 | 30.2 | 26.7 | 45.6 | 53.4 | 67.5 | 70.2 | 71.3 | 59.3 | 52.0 | 33.9 | 26.4 | 45.9 |
| 1985 | 12.2 | 19.0 | 37.7 | 52.2 | 60.7 | 63.8 | 70.0 | 66.4 | 61.6 | 49.4 | 31.0 | 11.3 | 44.6 |
| 1986 | 18.2 | 19.4 | 36.2 | 49.8 | 58.4 | 65.9 | 73.2 | 64.8 | 61.6 | 49.7 | 31.2 | 25.5 | 46.2 |
| 1987 | 22.6 | 30.5 | 37.2 | 49.9 | 60.8 | 70.4 | 74.5 | 68.7 | 60.6 | 43.4 | 40.0 | 28.4 | 48.9 |
| 1988 | 13.8 | 17.4 | 34.6 | 46.0 | 60.5 | 69.5 | 74.1 | 74.5 | 63.0 | 43.5 | 38.8 | 24.6 | 46.7 |
| 1989 | 27.6 | 14.6 | 30.1 | 44.7 | 56.1 | 65.7 | 72.3 | 68.6 | 58.7 | 50.8 | 33.1 | 14.2 | 44.7 |
| 1990 | 28.6 | 25.8 | 37.7 | 48.5 | 53.6 | 67.6 | 70.6 | 69.9 | 63.7 | 48.3 | 41.0 | 21.4 | 48.1 |
| 1991 | 15.1 | 26.5 | 36.8 | 49.4 | 63.6 | 71.1 | 72.3 | 70.2 | 60.0 | 49.4 | 31.4 | 26.3 | 47.7 |
| 1992 | 25.5 | 29.3 | 34.8 | 43.6 | 58.0 | 64.9 | 67.2 | 65.3 | 60.4 | 48.4 | 34.7 | 24.9 | 46.4 |
| 1993 | 21.8 | 21.2 | 31.5 | 43.7 | 59.6 | 65.9 | 72.0 | 72.1 | 56.7 | 47.9 | 35.2 | 26.6 | 46.2 |
| 1994 | 8.8 | 15.8 | 35.8 | 48.3 | 58.0 | 70.3 | 70.7 | 66.5 | 64.9 | 52.4 | 40.2 | 28.8 | 46.7 |
| 1995 | 20.4 | 22.9 | 36.9 | 43.8 | 57.6 | 72.0 | 74.8 | 76.9 | 58.7 | 50.2 | 28.7 | 20.6 | 47.0 |
| 1996 | 15.2 | 21.6 | 28.6 | 42.2 | 53.2 | 66.7 | 67.5 | 68.6 | 60.3 | 48.5 | 28.7 | 22.6 | 43.6 |
| 1997 | 15.7 | 24.1 | 34.1 | 43.3 | 51.3 | 67.3 | 69.3 | 65.4 | 60.2 | 50.2 | 33.3 | 27.9 | 45.2 |
| 1998 | 23.7 | 33.5 | 34.2 | 48.1 | 62.5 | 66.3 | 71.2 | 70.6 | 64.7 | 51.6 | 40.6 | 31.3 | 49.9 |
| 1999 | 16.5 | 30.8 | 33.8 | 48.1 | 59.9 | 68.4 | 74.9 | 66.9 | 60.3 | 48.9 | 42.0 | 26.4 | 48.1 |
| 2000 | 20.6 | 29.6 | 40.7 | 45.3 | 59.1 | 65.8 | 69.4 | 69.8 | 61.1 | 52.5 | 34.9 | 11.2 | 46.7 |
| 2001 | 21.7 | 19.7 | 31.7 | 51.1 | 58.4 | 66.0 | 72.3 | 70.9 | 58.7 | 48.9 | 46.1 | 30.4 | 48.0 |
| POR=62 YRS | 17.4 | 21.9 | 32.4 | 46.3 | 57.3 | 66.9 | 71.5 | 69.4 | 60.7 | 49.9 | 35.6 | 22.9 | 46.0 |
REFERENCE NOTES:
PAGE 1:
THE TEMPERATURE GRAPH SHOWS NORMAL MAXIMUM AND NORMAL MINIMUM DAILY TEMPERATURES (SOLID CURVES) AND THE ACTUAL DAILY HIGH AND LOW TEMPERATURES (VERTICAL BARS).
PAGE 2 AND 3:
H/C INDICATES HEATING AND COOLING DEGREE DAYS.
RH INDICATES RELATIVE HUMIDITY
W/O INDICATES WEATHER AND OBSTRUCTIONS
S INDICATES SUNSHINE.
PR INDICATES PRESSURE.
CLOUDINESS ON PAGE 3 IS THE SUM OF THE CEILOMETER AND SATELLITE DATA NOT TO EXCEED EIGHT EIGHTHS (OKTAS).
GENERAL:
T INDICATES TRACE PRECIPITATION, AN AMOUNT GREATER THAN ZERO BUT LESS THAN THE LOWEST REPORTABLE VALUE.
+ INDICATES THE VALUE ALSO OCCURS ON EARLIER DATES.
BLANK ENTRIES DENOTE MISSING OR UNREPORTED DATA.
NORMALS ARE 30–YEAR AVERAGES (1961–1990).
ASOS INDICATES AUTOMATED SURFACE OBSERVING SYSTEM.
PM INDICATES THE LAST DAY OF THE PREVIOUS MONTH.
POR (PERIOD OF RECORD) BEGINS WITH THE JANUARY DATA MONTH AND IS THE NUMBER OF YEARS USED TO COMPUTE THE MEAN. INDIVIDUAL MONTHS WITHIN THE POR MAY BE MISSING.
WHEN THE POR FOR A NORMAL IS LESS THAN 30 YEARS, THE NORMAL IS PROVISIONAL AND IS BASED ON THE NUMBER OF YEARS INDICATED.
0.* OR * INDICATES THE VALUE OR MEAN–DAYS–WITH IS BETWEEN 0.00 AND 0.05.
CLOUDINESS FOR ASOS STATIONS DIFFERS FROM THE NON–ASOS OBSERVATION TAKEN BY A HUMAN OBSERVER. ASOS STATION CLOUDINESS IS BASED ON TIME–AVERAGED CEILOMETER DATA FOR CLOUDS AT OR BELOW 12,000 FEET AND ON SATELLITE DATA FOR CLOUDS ABOVE 12,000 FEET.
THE NUMBER OF DAYS WITH CLEAR, PARTLY CLOUDY, AND CLOUDY CONDITIONS FOR ASOS STATIONS IS THE SUM OF THE CEILOMETER AND SATELLITE DATA FOR THE SUNRISE TO SUNSET PERIOD.
GENERAL CONTINUED:
CLEAR INDICATES 0–2 OKTAS, PARTLY CLOUDY INDICATES 3–6 OKTAS, AND CLOUDY INDICATES 7 OR 8 OKTAS. WHEN AT LEAST ONE OF THE ELEMENTS (CEILOMETER OR SATELLITE) IS MISSING, THE DAILY CLOUDINESS IS NOT COMPUTED.
WIND DIRECTION IS RECORDED IN TENS OF DEGREES (2 DIGITS) CLOCKWISE FROM TRUE NORTH. "00" INDICATES CALM. "36" INDICATES TRUE NORTH.
RESULTANT WIND IS THE VECTOR AVERAGE OF THE SPEED AND DIRECTION.
AVERAGE TEMPERATURE IS THE SUM OF THE MEAN DAILY MAXIMUM AND MINIMUM TEMPERATURE DIVIDED BY 2.
SNOWFALL DATA COMPRISE ALL FORMS OF FROZEN PRECIPITATION, INCLUDING HAIL.
A HEATING (COOLING) DEGREE DAY IS THE DIFFERENCE BETWEEN THE AVERAGE DAILY TEMPERATURE AND 65 F.
DRY BULB IS THE TEMPERATURE OF THE AMBIENT AIR.
DEW POINT IS THE TEMPERATURE TO WHICH THE AIR MUST BE COOLED TO ACHIEVE 100 PERCENT RELATIVE HUMIDITY.
WET BULB IS THE TEMPERATURE THE AIR WOULD HAVE IF THE MOISTURE CONTENT WAS INCREASED TO 100 PERCENT RELATIVE HUMIDITY.
ON JULY 1, 1996, THE NATIONAL WEATHER SERVICE BEGAN USING THE "METAR" OBSERVATION CODE THAT WAS ALREADY EMPLOYED BY MOST OTHER NATIONS OF THE WORLD. THE MOST NOTICEABLE DIFFERENCE IN THIS ANNUAL PUBLICATION WILL BE THE CHANGE IN UNITS FROM TENTHS TO EIGHTS (OKTAS) FOR REPORTING THE AMOUNT OF SKY COVER.
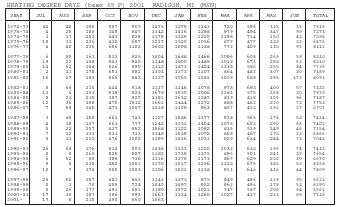
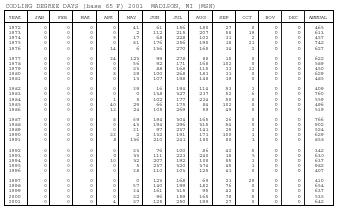
| HEATING DEGREE DAYS (base 65 F) 2001 MADISON, WI (MSN) | |||||||||||||
| YEAR | JUL | AUG | SEP | OCT | NOV | DEC | JAN | FEB | MAR | APR | MAY | JUN | TOTAL |
| 1972-73 | 44 | 42 | 188 | 587 | 905 | 1475 | 1279 | 1143 | 720 | 596 | 325 | 15 | 7319 |
| 1973-74 | 4 | 25 | 180 | 349 | 847 | 1342 | 1416 | 1298 | 979 | 494 | 347 | 90 | 7371 |
| 1974-75 | 1 | 37 | 253 | 443 | 829 | 1179 | 1329 | 1220 | 1198 | 714 | 150 | 43 | 7396 |
| 1975-76 | 18 | 11 | 236 | 412 | 687 | 1217 | 1520 | 1056 | 877 | 477 | 333 | 32 | 6876 |
| 1976-77 | 4 | 40 | 236 | 656 | 1102 | 1602 | 1898 | 1188 | 772 | 409 | 110 | 95 | 8112 |
| 1977-78 | 6 | 95 | 161 | 533 | 925 | 1404 | 1688 | 1466 | 1096 | 608 | 269 | 59 | 8310 |
| 1978-79 | 19 | 22 | 130 | 543 | 940 | 1348 | 1800 | 1489 | 1013 | 671 | 283 | 52 | 8310 |
| 1979-80 | 14 | 62 | 144 | 546 | 890 | 1112 | 1471 | 1424 | 1138 | 586 | 255 | 84 | 7726 |
| 1980-81 | 2 | 11 | 178 | 651 | 881 | 1303 | 1373 | 1107 | 864 | 482 | 307 | 30 | 7189 |
| 1981-82 | 16 | 27 | 193 | 566 | 842 | 1327 | 1765 | 1281 | 1059 | 688 | 155 | 172 | 8091 |
| 1982-83 | 5 | 66 | 230 | 444 | 918 | 1117 | 1346 | 1078 | 978 | 693 | 400 | 57 | 7332 |
| 1983-84 | 11 | 6 | 193 | 519 | 823 | 1678 | 1550 | 1006 | 1181 | 575 | 358 | 20 | 7920 |
| 1984-85 | 9 | 21 | 215 | 397 | 927 | 1191 | 1632 | 1287 | 839 | 418 | 155 | 96 | 7187 |
| 1985-86 | 12 | 36 | 198 | 475 | 1012 | 1661 | 1444 | 1272 | 888 | 462 | 220 | 73 | 7753 |
| 1986-87 | 7 | 59 | 145 | 471 | 1007 | 1218 | 1309 | 963 | 857 | 452 | 192 | 27 | 6707 |
| 1987-88 | 3 | 45 | 150 | 661 | 743 | 1127 | 1586 | 1377 | 938 | 565 | 176 | 53 | 7424 |
| 1988-89 | 4 | 18 | 107 | 661 | 777 | 1242 | 1153 | 1404 | 1076 | 602 | 290 | 68 | 7402 |
| 1989-90 | 5 | 22 | 207 | 437 | 952 | 1568 | 1122 | 1092 | 835 | 519 | 349 | 46 | 7154 |
| 1990-91 | 7 | 12 | 133 | 511 | 713 | 1349 | 1539 | 1072 | 868 | 467 | 173 | 22 | 6866 |
| 1991-92 | 8 | 11 | 222 | 476 | 1002 | 1195 | 1216 | 1031 | 929 | 634 | 244 | 73 | 7041 |
| 1992-93 | 26 | 68 | 176 | 514 | 903 | 1236 | 1333 | 1220 | 1032 | 633 | 196 | 74 | 7411 |
| 1993-94 | 0 | 9 | 260 | 525 | 887 | 1182 | 1739 | 1375 | 896 | 501 | 241 | 39 | 7654 |
| 1994-95 | 6 | 52 | 80 | 389 | 736 | 1116 | 1376 | 1173 | 867 | 629 | 226 | 20 | 6670 |
| 1995-96 | 9 | 0 | 228 | 452 | 1081 | 1370 | 1537 | 1256 | 1123 | 675 | 385 | 52 | 8168 |
| 1996-97 | 18 | 7 | 174 | 505 | 1083 | 1306 | 1521 | 1138 | 951 | 646 | 416 | 44 | 7809 |
| 1997-98 | 28 | 52 | 157 | 481 | 945 | 1141 | 1273 | 875 | 949 | 496 | 129 | 95 | 6621 |
| 1998-99 | 0 | 1 | 78 | 409 | 724 | 1040 | 1497 | 952 | 962 | 496 | 178 | 53 | 6390 |
| 1999-00 | 0 | 26 | 177 | 491 | 681 | 1190 | 1372 | 1021 | 747 | 587 | 206 | 64 | 6562 |
| 2000-01 | 17 | 10 | 187 | 386 | 895 | 1663 | 1334 | 1260 | 1027 | 417 | 231 | 89 | 7516 |
| 2001- | 17 | 8 | 210 | 490 | 560 | 1063 | |||||||
| COOLING DEGREE DAYS (base 65 F) 2001 MADISON, WI (MSN) | |||||||||||||
| YEAR | JAN | FEB | MAR | APR | MAY | JUN | JUL | AUG | SEP | OCT | NOV | DEC | ANNUAL |
| 1972 | 0 | 0 | 0 | 0 | 41 | 61 | 156 | 180 | 27 | 0 | 0 | 0 | 465 |
| 1973 | 0 | 0 | 0 | 0 | 2 | 112 | 215 | 207 | 58 | 19 | 0 | 0 | 613 |
| 1974 | 0 | 0 | 0 | 9 | 17 | 68 | 228 | 102 | 31 | 2 | 0 | 0 | 457 |
| 1975 | 0 | 0 | 0 | 0 | 81 | 176 | 256 | 190 | 18 | 21 | 0 | 0 | 742 |
| 1976 | 0 | 0 | 0 | 14 | 6 | 136 | 270 | 165 | 34 | 2 | 0 | 0 | 627 |
| 1977 | 0 | 0 | 0 | 24 | 123 | 99 | 278 | 88 | 10 | 0 | 0 | 0 | 622 |
| 1978 | 0 | 0 | 0 | 0 | 56 | 92 | 171 | 168 | 102 | 0 | 0 | 0 | 589 |
| 1979 | 0 | 0 | 0 | 0 | 33 | 88 | 168 | 115 | 33 | 13 | 0 | 0 | 450 |
| 1980 | 0 | 0 | 0 | 8 | 39 | 100 | 268 | 183 | 31 | 0 | 0 | 0 | 629 |
| 1981 | 0 | 0 | 0 | 0 | 13 | 107 | 198 | 148 | 19 | 0 | 0 | 0 | 485 |
| 1982 | 0 | 0 | 0 | 0 | 29 | 16 | 194 | 114 | 53 | 3 | 0 | 0 | 409 |
| 1983 | 0 | 0 | 0 | 0 | 0 | 138 | 327 | 237 | 52 | 6 | 0 | 0 | 760 |
| 1984 | 0 | 0 | 0 | 1 | 5 | 102 | 177 | 224 | 50 | 0 | 0 | 0 | 559 |
| 1985 | 0 | 0 | 0 | 40 | 29 | 66 | 175 | 84 | 102 | 0 | 0 | 0 | 496 |
| 1986 | 0 | 0 | 0 | 13 | 24 | 105 | 269 | 59 | 49 | 0 | 0 | 0 | 519 |
| 1987 | 0 | 0 | 0 | 8 | 69 | 194 | 304 | 165 | 26 | 0 | 0 | 0 | 766 |
| 1988 | 0 | 0 | 0 | 0 | 43 | 194 | 296 | 315 | 54 | 0 | 0 | 0 | 902 |
| 1989 | 0 | 0 | 0 | 0 | 21 | 97 | 237 | 141 | 25 | 3 | 0 | 0 | 524 |
| 1990 | 0 | 0 | 0 | 32 | 2 | 132 | 191 | 171 | 100 | 1 | 0 | 0 | 629 |
| 1991 | 0 | 0 | 0 | 8 | 136 | 210 | 241 | 180 | 80 | 3 | 0 | 0 | 858 |
| 1992 | 0 | 0 | 0 | 0 | 33 | 76 | 100 | 86 | 42 | 5 | 0 | 0 | 342 |
| 1993 | 0 | 0 | 0 | 0 | 33 | 111 | 223 | 240 | 18 | 5 | 0 | 0 | 630 |
| 1994 | 0 | 0 | 0 | 10 | 32 | 207 | 192 | 108 | 85 | 3 | 0 | 0 | 637 |
| 1995 | 0 | 0 | 0 | 0 | 5 | 237 | 320 | 374 | 45 | 1 | 0 | 0 | 982 |
| 1996 | 0 | 0 | 0 | 0 | 28 | 110 | 103 | 125 | 41 | 0 | 0 | 0 | 407 |
| 1997 | 0 | 0 | 0 | 0 | 0 | 123 | 168 | 69 | 21 | 29 | 0 | 0 | 410 |
| 1998 | 0 | 0 | 0 | 0 | 57 | 140 | 199 | 182 | 76 | 0 | 0 | 0 | 654 |
| 1999 | 0 | 0 | 0 | 0 | 24 | 161 | 315 | 95 | 42 | 0 | 0 | 0 | 637 |
| 2000 | 0 | 0 | 0 | 0 | 32 | 96 | 159 | 165 | 78 | 5 | 0 | 0 | 535 |
| 2001 | 0 | 0 | 0 | 4 | 37 | 125 | 250 | 199 | 27 | 0 | 0 | 0 | 642 |
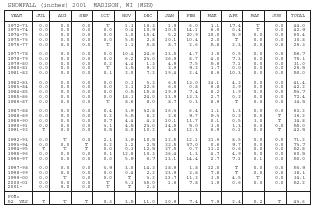
| SNOWFALL (inches) 2001 MADISON, WI (MSN) | |||||||||||||
| YEAR | JUL | AUG | SEP | OCT | NOV | DEC | JAN | FEB | MAR | APR | MAY | JUN | TOTAL |
| 1972-73 | 0.0 | 0.0 | 0.0 | T | 1.3 | 16.3 | 1.9 | 6.0 | 1.1 | 17.4 | T | 0.0 | 44.0 |
| 1973-74 | 0.0 | 0.0 | 0.0 | 0.0 | 0.4 | 10.9 | 10.5 | 14.1 | 6.6 | 0.4 | T | 0.0 | 42.9 |
| 1974-75 | 0.0 | 0.0 | 0.0 | 0.0 | 3.0 | 15.4 | 5.2 | 20.9 | 10.0 | 5.9 | 0.0 | 0.0 | 60.4 |
| 1975-76 | 0.0 | 0.0 | 0.0 | 0.0 | 5.5 | 2.8 | 10.1 | 10.4 | 2.0 | T | 0.0 | 0.0 | 30.8 |
| 1976-77 | 0.0 | 0.0 | 0.0 | T | 1.1 | 5.8 | 8.7 | 2.6 | 5.8 | 2.3 | 0.0 | 0.0 | 26.3 |
| 1977-78 | 0.0 | 0.0 | 0.0 | 0.0 | 10.4 | 24.6 | 13.5 | 4.7 | 3.0 | 0.5 | 0.0 | 0.0 | 56.7 |
| 1978-79 | 0.0 | 0.0 | 0.0 | 0.0 | 6.2 | 23.0 | 26.9 | 8.7 | 4.0 | 7.3 | 0.0 | 0.0 | 76.1 |
| 1979-80 | 0.0 | 0.0 | 0.0 | 0.2 | 4.4 | 1.3 | 4.9 | 7.5 | 5.6 | 7.1 | 0.0 | 0.0 | 31.0 |
| 1980-81 | 0.0 | 0.0 | 0.0 | T | 3.5 | 9.2 | 2.9 | 9.2 | 1.7 | 0.0 | 0.0 | 0.0 | 26.5 |
| 1981-82 | 0.0 | 0.0 | 0.0 | 0.1 | 2.0 | 7.2 | 19.4 | 2.4 | 8.6 | 10.3 | 0.0 | 0.0 | 50.0 |
| 1982-83 | 0.0 | 0.0 | 0.0 | 0.0 | 0.3 | 3.3 | 6.5 | 13.0 | 14.1 | 4.2 | 0.0 | 0.0 | 41.4 |
| 1983-84 | 0.0 | 0.0 | 0.0 | 0.0 | 2.1 | 22.6 | 6.0 | 0.8 | 6.8 | 3.9 | 0.0 | 0.0 | 42.2 |
| 1984-85 | 0.0 | 0.0 | 0.0 | 0.0 | 0.5 | 15.8 | 19.9 | 7.4 | 8.2 | 1.9 | 0.0 | 0.0 | 53.7 |
| 1985-86 | 0.0 | 0.0 | 0.0 | 0.0 | 18.3 | 24.0 | 13.9 | 13.3 | 2.7 | 0.2 | 0.0 | 0.0 | 72.4 |
| 1986-87 | 0.0 | 0.0 | 0.0 | T | 8.6 | 8.0 | 8.7 | 0.3 | 8.9 | T | 0.0 | 0.0 | 34.5 |
| 1987-88 | 0.0 | 0.0 | 0.0 | 0.4 | 3.9 | 32.8 | 16.3 | 6.4 | 1.1 | 1.3 | 0.0 | 0.0 | 62.2 |
| 1988-89 | 0.0 | 0.0 | 0.0 | 0.2 | 5.5 | 8.2 | 2.6 | 9.7 | 9.3 | 0.2 | 0.5 | T | 36.2 |
| 1989-90 | 0.0 | 0.0 | 0.0 | 0.7 | 4.4 | 4.3 | 10.1 | 11.7 | 0.1 | 0.5 | 3.0 | T | 34.8 |
| 1990-91 | 0.0 | 0.0 | 0.0 | 3.1 | 4.5 | 23.0 | 14.5 | 5.0 | 3.6 | 1.3 | 0.0 | 0.0 | 55.0 |
| 1991-92 | T | 0.0 | 0.0 | 0.5 | 8.0 | 10.2 | 4.5 | 12.3 | 6.9 | 0.1 | 0.0 | T | 42.5 |
| 1992-93 | 0.0 | T | 0.0 | 2.1 | 3.9 | 10.5 | 12.5 | 12.1 | 21.6 | 8.5 | 0.0 | 0.0 | 71.2 |
| 1993-94 | 0.0 | 0.0 | T | 0.2 | 1.2 | 2.5 | 22.5 | 37.0 | 0.6 | 9.7 | 0.0 | 0.0 | 73.7 |
| 1994-95 | T | T | T | 0.0 | 0.3 | 12.5 | 27.5 | 0.7 | 11.2 | 0.6 | 0.0 | 0.0 | 52.8 |
| 1995-96 | 0.0 | 0.0 | 0.0 | 0.1 | 12.8 | 10.3 | 26.4 | 1.3 | 4.7 | 4.9 | 0.0 | 0.0 | 60.5 |
| 1996-97 | 0.0 | 0.0 | 0.0 | 0.0 | 5.9 | 6.7 | 13.1 | 14.4 | 2.7 | 7.1 | 0.1 | 0.0 | 50.0 |
| 1997-98 | 0.0 | 0.0 | 0.0 | 3.9 | 3.0 | 14.3 | 18.9 | 1.8 | 12.0 | T | 0.0 | 0.0 | 53.9 |
| 1998-99 | 0.0 | 0.0 | 0.0 | 0.0 | 0.4 | 2.2 | 23.9 | 3.8 | 7.8 | T | 0.0 | 0.0 | 38.1 |
| 1999-00 | 0.0 | T | 0.0 | 0.0 | T | 3.2 | 11.7 | 11.2 | 3.5 | 4.5 | T | 0.0 | 34.1 |
| 2000-01 | 0.0 | 0.0 | 0.0 | T | 5.3 | 35.0 | 1.6 | 7.8 | 1.9 | 0.6 | 0.0 | 0.0 | 52.2 |
| 2001- | 0.0 | 0.0 | 0.0 | T | T | 2.3 | |||||||
| POR=52 YRS | T | T | T | 0.3 | 3.5 | 11.0 | 10.9 | 7.4 | 7.9 | 2.4 | 0.2 | T | 43.6 |
Comment about this article, ask questions, or add new information about this topic: