2001 BURLINGTON, VERMONT (BTV)
Burlington is located on the eastern shore of Lake Champlain at the widest part of the lake. About 35 miles to the west lie the highest peaks of the Adirondacks, while the foothills of the Green Mountains begin 10 miles to the east and southeast.
Its northerly latitude assures the variety and vigor of a true New England climate, while thanks to the modifying influence of the lake, the many rapid and marked weather changes are tempered in severity. Due to its location in the path of the St. Lawrence Valley storm track and the lake effects, the city is one of the cloudiest in the United States.
Lake Champlain exercises a tempering influence on the local temperature. During the winter months and prior to the lake freezing, temperatures along the lake shore are often 5–10 degrees warmer than at the airport 3 l/2 miles inland. At the airport the average occurrence of the last freeze in spring is around May l0th and that of the first in fall is early October, giving a growing season of 145 days. This location is justly proud of its delightful summer weather. On average, there are few days a year with maxima of 90 degrees or higher. This moderate summer heat gives way to a cooler, but none the less pleasant fall period, usually extending well into October. High pressure systems moving down rapidly from central Canada or Hudson Bay produce the coldest temperatures during the winter months, but extended periods of very cold weather are rare.
Precipitation, although generally plentiful and well distributed throughout the year, is less in the Champlain Valley than in other areas of Vermont due to the shielding effect of the mountain barriers to the east and west. The heaviest rainfall usually occurs during summer thunderstorms, but excessively heavy rainfall is quite uncommon. Droughts are infrequent.
Because of the trend of the Champlain Valley between the Adirondack and Green Mountain ranges, most winds have a northerly or southerly component. The prevailing direction most of the year is from the south. Winds of damaging force are very uncommon.
Smoke pollution is nearly non–existent since there is no concentration of heavy industry here, however, haze has been on the increase over the years due to the large increase in industry to the north and south. During the spring and fall months, fog occasionally forms along the Winooski River to the north and east and may drift over the airport with favorable winds. In spite of the high percentage of cloudiness, periods of low aircraft ceilings and visibilities are usually of short duration, allowing this area to have one of the highest percentages of flying weather in New England.
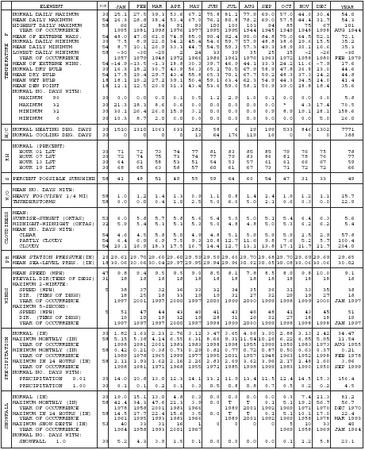
NORMALS, MEANS, AND EXTREMES
BURLINGTON, VT (BTV)
LATITUDE: LONGITUDE: ELEVATION (FT): TIME ZONE: WBAN: 14742
44 28′ 05″ N 73 09′ 01″ W GRND: 345 BARO: � A0;348 EASTERN (UTC + 5)
| ELEMENT | POR | JAN | FEB | MAR | APR | MAY | JUN | JUL | AUG | SEP | OCT | NOV | DEC | YEAR | |
| TEMPERATURE F | NORMAL DAILY MAXIMUM | 30 | 25.1 | 27.5 | 39.3 | 53.6 | 67.2 | 75.8 | 81.2 | 77.9 | 69.0 | 57.0 | 44.0 | 30.4 | 54.0 |
| MEAN DAILY MAXIMUM | 54 | 26.3 | 28.8 | 38.4 | 53.4 | 67.0 | 76.2 | 80.8 | 78.2 | 69.0 | 57.5 | 44.4 | 31.7 | 54.3 | |
| HIGHEST DAILY MAXIMUM | 58 | 66 | 62 | 84 | 91 | 93 | 100 | 100 | 101 | 94 | 85 | 75 | 67 | 101 | |
| YEAR OF OCCURRENCE | 1995 | 1981 | 1998 | 1976 | 1977 | 1995 | 1995 | 1944 | 1945 | 1949 | 1948 | 1998 | AUG 1944 | ||
| MEAN OF EXTREME MAXS. | 54 | 48.0 | 47.0 | 61.0 | 74.9 | 85.0 | 90.4 | 92.4 | 90.0 | 84.8 | 75.0 | 64.5 | 52.1 | 72.1 | |
| NORMAL DAILY MINIMUM | 30 | 7.5 | 8.9 | 22.0 | 34.2 | 45.4 | 54.6 | 59.7 | 57.9 | 48.8 | 38.6 | 29.6 | 15.5 | 35.2 | |
| MEAN DAILY MINIMUM | 54 | 8.7 | 10.1 | 20.9 | 33.3 | 44.7 | 54.5 | 59.3 | 57.3 | 49.3 | 38.9 | 30.1 | 16.6 | 35.3 | |
| LOWEST DAILY MINIMUM | 58 | -30 | -30 | -20 | 2 | 24 | 33 | 39 | 35 | 25 | 15 | -2 | -26 | -30 | |
| YEAR OF OCCURRENCE | 1957 | 1979 | 1948 | 1972 | 1966 | 1986 | 1962 | 1976 | 1963 | 1972 | 1958 | 1980 | FEB 1979 | ||
| MEAN OF EXTREME MINS. | 54 | -14.9 | -13.5 | -1.3 | 18.8 | 30.3 | 39.7 | 46.9 | 44.1 | 33.3 | 24.2 | 11.6 | -7.9 | 17.6 | |
| NORMAL DRY BULB | 30 | 16.3 | 18.2 | 30.7 | 43.9 | 56.3 | 65.2 | 70.5 | 67.9 | 58.9 | 47.8 | 36.8 | 23.0 | 44.6 | |
| MEAN DRY BULB | 54 | 17.5 | 19.4 | 29.7 | 43.4 | 55.8 | 65.3 | 70.1 | 67.7 | 59.2 | 48.3 | 37.3 | 24.2 | 44.8 | |
| MEAN WET BULB | 18 | 18.1 | 19.2 | 27.2 | 39.1 | 50.4 | 59.1 | 63.4 | 62.3 | 54.9 | 44.3 | 34.5 | 24.0 | 41.4 | |
| MEAN DEW POINT | 18 | 12.1 | 12.5 | 20.0 | 31.3 | 43.4 | 53.6 | 59.0 | 58.1 | 50.9 | 39.0 | 28.8 | 18.4 | 35.6 | |
| NORMAL NO. DAYS WITH: | |||||||||||||||
| MAXIMUM 90 | 30 | 0.0 | 0.0 | 0.0 | 0.1 | 0.5 | 1.2 | 2.9 | 1.0 | 0.1 | 0.0 | 0.0 | 0.0 | 5.8 | |
| MAXIMUM 32 | 30 | 21.3 | 18.3 | 8.6 | 0.6 | 0.0 | 0.0 | 0.0 | 0.0 | 0.0 | * | 4.3 | 17.4 | 70.5 | |
| MINIMUM 32 | 30 | 30.1 | 26.4 | 26.0 | 15.9 | 3.2 | 0.0 | 0.0 | 0.0 | 0.9 | 8.9 | 19.1 | 28.1 | 158.6 | |
| MINIMUM 0 | 30 | 10.3 | 8.7 | 2.0 | 0.0 | 0.0 | 0.0 | 0.0 | 0.0 | 0.0 | 0.0 | 0.0 | 5.0 | 26.0 | |
| H/C | NORMAL HEATING DEG. DAYS | 30 | 1510 | 1310 | 1063 | 633 | 282 | 58 | 6 | 29 | 199 | 533 | 846 | 1302 | 7771 |
| NORMAL COOLING DEG. DAYS | 30 | 0 | 0 | 0 | 0 | 13 | 64 | 176 | 119 | 16 | 0 | 0 | 0 | 388 | |
| RH | NORMAL (PERCENT) | ||||||||||||||
| HOUR 01 LST | 30 | 71 | 72 | 73 | 74 | 77 | 81 | 83 | 85 | 85 | 79 | 76 | 75 | 78 | |
| HOUR 07 LST | 30 | 72 | 74 | 75 | 73 | 74 | 77 | 79 | 83 | 86 | 81 | 78 | 76 | 77 | |
| HOUR 13 LST | 30 | 64 | 61 | 58 | 53 | 51 | 54 | 53 | 57 | 61 | 61 | 66 | 67 | 59 | |
| HOUR 19 LST | 30 | 68 | 65 | 63 | 58 | 57 | 60 | 61 | 67 | 73 | 71 | 72 | 72 | 66 | |
| S | PERCENT POSSIBLE SUNSHINE | 58 | 41 | 48 | 51 | 49 | 55 | 59 | 64 | 60 | 54 | 47 | 31 | 33 | 49 |
| W/O | MEAN NO. DAYS WITH: | ||||||||||||||
| HEAVY FOG(VISBY 1/4 MI) | 58 | 1.0 | 1.2 | 1.4 | 1.3 | 0.9 | 1.1 | 0.8 | 1.4 | 2.4 | 1.9 | 1.2 | 1.1 | 15.7 | |
| THUNDERSTORMS | 58 | 0.0 | 0.0 | 0.4 | 1.0 | 2.5 | 5.0 | 6.0 | 5.0 | 2.1 | 0.6 | 0.3 | 0.0 | 22.9 | |
| CLOUDINESS | MEAN: | ||||||||||||||
| SUNRISE-SUNSET (OKTAS) | 53 | 6.0 | 5.8 | 5.7 | 5.8 | 5.6 | 5.4 | 5.0 | 5.0 | 5.1 | 5.4 | 6.4 | 6.3 | 5.6 | |
| MIDNIGHT-MIDNIGHT (OKTAS) | 32 | 5.9 | 5.4 | 5.3 | 5.3 | 5.3 | 5.0 | 4.8 | 4.8 | 5.0 | 5.3 | 6.2 | 6.2 | 5.4 | |
| MEAN NO. DAYS WITH: | |||||||||||||||
| CLEAR | 54 | 4.6 | 4.5 | 5.8 | 5.0 | 4.9 | 4.8 | 5.1 | 5.9 | 5.9 | 5.9 | 2.5 | 2.9 | 57.8 | |
| PARTLY CLOUDY | 54 | 6.4 | 6.9 | 6.9 | 7.5 | 9.3 | 10.8 | 12.7 | 11.6 | 9.8 | 7.6 | 5.2 | 5.7 | 100.4 | |
| CLOUDY | 54 | 20.1 | 16.9 | 18.3 | 17.5 | 16.7 | 14.4 | 12.7 | 13.1 | 13.8 | 17.1 | 21.7 | 21.7 | 204.0 | |
| PR | MEAN STATION PRESSURE(IN) | 29 | 29.61 | 29.70 | 29.60 | 29.60 | 29.59 | 29.59 | 29.60 | 29.70 | 29.68 | 29.70 | 29.69 | 29.69 | 29.65 |
| MEAN SEA-LEVEL PRES. (IN) | 18 | 30.06 | 30.06 | 30.04 | 29.97 | 29.95 | 29.94 | 29.96 | 30.02 | 30.05 | 30.08 | 30.06 | 30.06 | 30.02 | |
| WINDS | MEAN SPEED (MPH) | 47 | 9.8 | 9.4 | 9.5 | 9.5 | 9.0 | 8.5 | 8.1 | 7.8 | 8.5 | 8.9 | 9.8 | 10.0 | 9.1 |
| PREVAIL. DIR (TENS OF DEGS) | 31 | 18 | 18 | 18 | 18 | 18 | 18 | 18 | 18 | 18 | 18 | 18 | 18 | 18 | |
| MAXIMUM 2-MINUTE: | |||||||||||||||
| SPEED (MPH) | 5 | 38 | 37 | 32 | 36 | 33 | 32 | 34 | 35 | 36 | 31 | 33 | 35 | 38 | |
| DIR. (TENS OF DEGS) | 18 | 25 | 18 | 33 | 19 | 19 | 32 | 27 | 32 | 29 | 19 | 27 | 18 | ||
| YEAR OF OCCURRENCE | 1997 | 2001 | 1997 | 2000 | 1997 | 2000 | 1999 | 2000 | 1999 | 1998 | 1999 | 2000 | JAN 1997 | ||
| MAXIMUM 5-SECOND: | |||||||||||||||
| SPEED (MPH) | 5 | 51 | 47 | 44 | 43 | 40 | 41 | 43 | 46 | 48 | 41 | 43 | 45 | 51 | |
| DIR. (TENS OF DEGS) | 19 | 19 | 19 | 32 | 19 | 28 | 31 | 26 | 32 | 27 | 18 | 18 | 19 | ||
| YEAR OF OCCURRENCE | 1997 | 1997 | 1997 | 2000 | 1997 | 1998 | 1999 | 2000 | 1999 | 1998 | 1998 | 1998 | JAN 1997 | ||
| PRECIPITATION | NORMAL (IN) | 30 | 1.82 | 1.63 | 2.23 | 2.76 | 3.12 | 3.47 | 3.65 | 4.06 | 3.30 | 2.88 | 3.13 | 2.42 | 34.47 |
| MAXIMUM MONTHLY (IN) | 58 | 5.15 | 5.38 | 4.14 | 6.55 | 6.31 | 8.66 | 9.31 | 11.54 | 10.26 | 6.22 | 6.85 | 5.95 | 11.54 | |
| YEAR OF OCCURRENCE | 1998 | 1981 | 2001 | 1983 | 1983 | 1998 | 1998 | 1955 | 1999 | 1959 | 1983 | 1973 | AUG 1955 | ||
| MINIMUM MONTHLY (IN) | 58 | 0.42 | 0.21 | 0.38 | 0.73 | 0.29 | 0.82 | 0.77 | 0.72 | 0.87 | 0.50 | 0.63 | 0.37 | 0.21 | |
| YEAR OF OCCURRENCE | 1989 | 1978 | 1965 | 1999 | 1977 | 1995 | 2001 | 1957 | 1948 | 1963 | 1952 | 1998 | FEB 1978 | ||
| MAXIMUM IN 24 HOURS (IN) | 58 | 2.11 | 1.93 | 1.62 | 2.16 | 2.26 | 2.83 | 2.69 | 3.62 | 3.96 | 2.17 | 2.48 | 2.60 | 3.96 | |
| YEAR OF OCCURRENCE | 1998 | 1981 | 1971 | 1968 | 1955 | 1972 | 1985 | 1998 | 1999 | 1983 | 1990 | 1950 | SEP 1999 | ||
| NORMAL NO. DAYS WITH: | |||||||||||||||
| PRECIPITATION 0.01 | 30 | 14.0 | 10.8 | 13.0 | 12.3 | 14.1 | 13.2 | 11.9 | 13.4 | 11.5 | 12.4 | 14.5 | 15.3 | 156.4 | |
| PRECIPITATION 1.00 | 30 | 0.1 | 0.1 | 0.2 | 0.1 | 0.3 | 0.5 | 0.8 | 0.8 | 0.7 | 0.5 | 0.2 | 0.2 | 4.5 | |
| SNOWFALL | NORMAL (IN) | 30 | 19.0 | 15.1 | 13.0 | 4.8 | 0.3 | 0.0 | 0.0 | 0.0 | 0.0 | 0.3 | 7.4 | 21.3 | 81.2 |
| MAXIMUM MONTHLY (IN) | 58 | 42.4 | 34.3 | 47.6 | 21.3 | 3.9 | 0.0 | T | T | 0.1 | 5.1 | 19.2 | 56.7 | 56.7 | |
| YEAR OF OCCURRENCE | 1978 | 1958 | 2001 | 1983 | 1966 | 1989 | 2001 | 1992 | 1969 | 1971 | 1970 | DEC 1970 | |||
| MAXIMUM IN 24 HOURS (IN) | 58 | 14.5 | 17.7 | 22.4 | 15.6 | 3.5 | 0.0 | T | T | 0.1 | 5.1 | 10.1 | 17.0 | 22.4 | |
| YEAR OF OCCURRENCE | 1961 | 1995 | 1993 | 1983 | 1966 | 1989 | 2001 | 1992 | 1969 | 1958 | 1978 | MAR 1993 | |||
| MAXIMUM SNOW DEPTH (IN) | 53 | 40 | 33 | 31 | 16 | 1 | 0 | 0 | 0 | 0 | 5 | 10 | 33 | 40 | |
| YEAR OF OCCURRENCE | 1964 | 1958 | 1993 | 2001 | 1967 | 1969 | 1958 | 1969 | JAN 1964 | ||||||
| NORMAL NO. DAYS WITH: | |||||||||||||||
| SNOWFALL 1.0 | 30 | 5.2 | 4.3 | 3.9 | 1.5 | 0.1 | 0.0 | 0.0 | 0.0 | 0.0 | 0.1 | 2.2 | 5.8 | 23.1 |
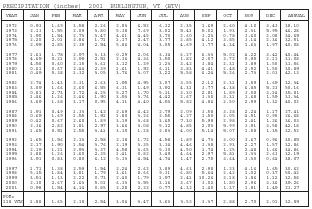
| PRECIPITATION (inches) 2001 BURLINGTON, VT (BTV) | |||||||||||||
| YEAR | JAN | FEB | MAR | APR | MAY | JUN | JUL | AUG | SEP | OCT | NOV | DEC | ANNUAL |
| 1972 | 0.93 | 1.69 | 3.58 | 2.26 | 2.83 | 6.52 | 6.12 | 2.35 | 1.69 | 2.60 | 4.10 | 3.43 | 38.10 |
| 1973 | 2.13 | 1.55 | 2.09 | 3.80 | 5.38 | 7.69 | 3.02 | 5.41 | 5.02 | 1.93 | 2.31 | 5.95 | 46.28 |
| 1974 | 1.90 | 1.54 | 2.73 | 3.47 | 4.61 | 4.45 | 3.70 | 2.60 | 3.23 | 0.78 | 3.60 | 2.08 | 34.69 |
| 1975 | 2.20 | 2.01 | 2.86 | 1.71 | 1.17 | 2.47 | 3.77 | 2.85 | 4.12 | 3.85 | 3.14 | 2.36 | 32.51 |
| 1976 | 2.99 | 2.85 | 2.35 | 2.54 | 5.86 | 4.04 | 3.05 | 4.69 | 3.77 | 4.34 | 1.63 | 1.97 | 40.08 |
| 1977 | 1.61 | 1.78 | 2.97 | 3.13 | 0.29 | 2.06 | 3.34 | 6.27 | 6.33 | 5.02 | 4.22 | 3.42 | 40.44 |
| 1978 | 4.69 | 0.21 | 2.98 | 2.51 | 2.16 | 4.36 | 3.50 | 1.82 | 2.07 | 3.72 | 0.95 | 2.11 | 31.08 |
| 1979 | 4.50 | 0.60 | 2.15 | 3.61 | 3.12 | 1.39 | 1.23 | 3.42 | 3.84 | 2.31 | 3.89 | 1.50 | 31.56 |
| 1980 | 0.61 | 0.67 | 2.44 | 2.39 | 1.61 | 1.92 | 6.11 | 3.83 | 4.41 | 2.48 | 2.92 | 1.50 | 30.89 |
| 1981 | 0.49 | 5.38 | 1.32 | 3.05 | 3.76 | 3.07 | 3.22 | 5.58 | 6.24 | 5.26 | 2.73 | 2.03 | 42.13 |
| 1982 | 2.74 | 1.43 | 2.31 | 2.63 | 1.95 | 4.95 | 3.07 | 3.55 | 2.12 | 2.31 | 3.59 | 1.69 | 32.34 |
| 1983 | 3.09 | 1.66 | 2.60 | 6.55 | 6.31 | 1.49 | 3.92 | 4.31 | 3.77 | 4.38 | 6.85 | 5.23 | 50.16 |
| 1984 | 0.81 | 2.73 | 1.72 | 4.25 | 5.27 | 1.70 | 5.11 | 3.30 | 2.81 | 1.89 | 3.08 | 3.14 | 35.81 |
| 1985 | 1.46 | 1.26 | 2.46 | 1.90 | 3.53 | 3.76 | 4.42 | 2.67 | 3.30 | 3.31 | 3.68 | 1.59 | 33.34 |
| 1986 | 3.69 | 1.68 | 3.17 | 0.95 | 4.11 | 4.40 | 4.53 | 5.82 | 4.86 | 2.50 | 2.99 | 1.32 | 40.02 |
| 1987 | 1.91 | 0.49 | 1.33 | 1.42 | 2.69 | 4.42 | 2.79 | 2.09 | 3.58 | 3.28 | 2.24 | 1.17 | 27.41 |
| 1988 | 0.69 | 1.69 | 1.55 | 1.91 | 1.80 | 3.26 | 2.55 | 4.27 | 1.50 | 2.05 | 4.51 | 0.90 | 26.68 |
| 1989 | 0.42 | 0.67 | 2.60 | 1.89 | 3.19 | 3.68 | 3.65 | 7.30 | 5.98 | 2.98 | 2.41 | 1.26 | 36.03 |
| 1990 | 2.36 | 2.82 | 1.81 | 2.97 | 3.66 | 3.08 | 5.12 | 4.85 | 2.03 | 5.99 | 3.91 | 3.58 | 42.18 |
| 1991 | 1.65 | 0.51 | 2.55 | 3.41 | 3.15 | 1.28 | 2.83 | 4.00 | 5.14 | 5.07 | 1.58 | 1.35 | 32.52 |
| 1992 | 1.65 | 1.56 | 2.13 | 2.58 | 2.38 | 1.72 | 4.58 | 1.89 | 4.73 | 3.00 | 3.67 | 0.96 | 30.85 |
| 1993 | 2.17 | 1.90 | 1.54 | 3.76 | 2.19 | 3.35 | 3.34 | 4.46 | 3.38 | 2.93 | 2.27 | 1.57 | 32.86 |
| 1994 | 2.19 | 1.21 | 2.93 | 3.37 | 4.58 | 3.65 | 5.30 | 4.50 | 1.74 | 1.25 | 2.48 | 1.66 | 34.86 |
| 1995 | 1.88 | 1.26 | 1.60 | 2.35 | 1.41 | 0.82 | 3.49 | 4.64 | 2.97 | 5.81 | 3.33 | 2.63 | 32.19 |
| 1996 | 3.91 | 0.83 | 0.80 | 6.12 | 5.33 | 4.54 | 4.74 | 1.47 | 2.75 | 3.64 | 3.30 | 0.64 | 38.07 |
| 1997 | 1.71 | 1.38 | 2.59 | 1.54 | 2.24 | 2.62 | 3.89 | 4.63 | 2.98 | 1.23 | 4.16 | 1.65 | 30.62 |
| 1998 | 5.15 | 1.84 | 3.81 | 1.79 | 3.61 | 8.66 | 9.31 | 6.80 | 5.64 | 2.42 | 1.02 | 0.37 | 50.42 |
| 1999 | 3.51 | 1.13 | 2.22 | 0.73 | 2.40 | 1.79 | 1.97 | 2.41 | 10.26 | 3.18 | 1.86 | 1.12 | 32.58 |
| 2000 | 2.30 | 2.67 | 1.63 | 5.01 | 6.13 | 3.55 | 3.16 | 3.67 | 3.02 | 1.80 | 2.96 | 3.36 | 39.26 |
| 2001 | 0.98 | 1.54 | 4.14 | 0.85 | 2.28 | 2.32 | 0.77 | 4.32 | 1.40 | 1.37 | 1.81 | 1.49 | 23.27 |
| POR=118 YRS | 1.88 | 1.65 | 2.18 | 2.54 | 3.06 | 3.47 | 3.63 | 3.52 | 3.37 | 2.88 | 2.70 | 2.01 | 32.89 |
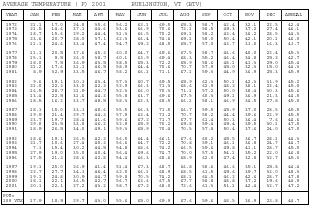
| AVERAGE TEMPERATURE (F) 2001 BURLINGTON, VT (BTV) | |||||||||||||
| YEAR | JAN | FEB | MAR | APR | MAY | JUN | JUL | AUG | SEP | OCT | NOV | DEC | ANNUAL |
| 1972 | 21.1 | 17.0 | 24.8 | 35.6 | 56.2 | 63.1 | 69.5 | 65.3 | 58.7 | 42.4 | 32.1 | 22.5 | 42.4 |
| 1973 | 21.5 | 14.6 | 37.1 | 44.6 | 53.6 | 66.9 | 70.6 | 72.1 | 58.5 | 49.3 | 37.2 | 27.4 | 46.1 |
| 1974 | 18.7 | 15.6 | 29.2 | 44.4 | 51.3 | 66.5 | 70.2 | 69.1 | 58.2 | 43.4 | 36.2 | 28.5 | 44.3 |
| 1975 | 23.6 | 20.7 | 28.0 | 37.1 | 62.3 | 66.4 | 74.6 | 69.1 | 58.0 | 50.4 | 42.1 | 20.1 | 46.0 |
| 1976 | 11.1 | 24.6 | 33.4 | 47.4 | 54.7 | 69.2 | 68.5 | 65.7 | 57.0 | 43.7 | 33.0 | 16.3 | 43.7 |
| 1977 | 11.1 | 20.5 | 37.6 | 45.3 | 60.0 | 64.7 | 69.6 | 67.5 | 58.7 | 46.6 | 40.0 | 22.4 | 45.3 |
| 1978 | 15.1 | 9.5 | 26.0 | 38.7 | 60.1 | 63.9 | 69.4 | 68.3 | 55.2 | 46.4 | 34.8 | 25.2 | 42.7 |
| 1979 | 18.0 | 7.5 | 36.9 | 43.5 | 58.5 | 65.3 | 72.2 | 65.9 | 58.6 | 48.1 | 41.3 | 29.0 | 45.4 |
| 1980 | 21.2 | 17.6 | 31.1 | 46.5 | 58.9 | 64.4 | 70.6 | 70.7 | 57.9 | 45.0 | 32.3 | 15.0 | 44.3 |
| 1981 | 8.9 | 32.9 | 33.5 | 46.7 | 58.2 | 66.1 | 71.1 | 67.1 | 59.3 | 44.9 | 36.9 | 25.3 | 45.9 |
| 1982 | 9.6 | 19.1 | 30.3 | 43.4 | 57.3 | 60.7 | 69.5 | 65.9 | 62.3 | 50.1 | 42.3 | 31.9 | 45.2 |
| 1983 | 21.0 | 22.3 | 33.0 | 42.3 | 52.9 | 66.3 | 71.3 | 68.6 | 62.9 | 48.2 | 38.1 | 22.4 | 45.8 |
| 1984 | 16.5 | 28.7 | 21.9 | 44.7 | 52.3 | 66.0 | 70.3 | 71.1 | 57.2 | 50.0 | 38.4 | 30.3 | 45.6 |
| 1985 | 13.4 | 22.5 | 31.6 | 44.3 | 55.8 | 61.7 | 69.6 | 67.5 | 60.3 | 49.1 | 36.9 | 21.3 | 44.5 |
| 1986 | 18.5 | 16.2 | 33.7 | 48.5 | 58.3 | 62.3 | 68.5 | 66.1 | 58.1 | 46.9 | 34.5 | 27.8 | 45.0 |
| 1987 | 18.1 | 15.0 | 33.3 | 48.6 | 55.5 | 66.3 | 71.5 | 66.7 | 59.5 | 45.9 | 37.0 | 28.5 | 45.5 |
| 1988 | 19.9 | 21.4 | 29.7 | 44.3 | 57.9 | 63.4 | 73.2 | 70.7 | 58.2 | 44.4 | 39.6 | 22.9 | 45.5 |
| 1989 | 23.7 | 19.7 | 28.4 | 41.6 | 59.6 | 67.2 | 71.7 | 67.7 | 61.4 | 50.3 | 36.4 | 7.6 | 44.6 |
| 1990 | 29.8 | 23.5 | 33.8 | 46.2 | 52.9 | 65.9 | 70.2 | 69.8 | 59.4 | 49.4 | 39.5 | 30.1 | 47.5 |
| 1991 | 18.9 | 26.5 | 34.0 | 49.1 | 59.3 | 65.9 | 70.4 | 70.5 | 57.8 | 50.4 | 37.6 | 24.0 | 47.0 |
| 1992 | 18.6 | 19.1 | 26.5 | 42.3 | 56.5 | 64.4 | 66.1 | 67.6 | 60.2 | 45.5 | 36.7 | 28.1 | 44.3 |
| 1993 | 21.7 | 10.6 | 27.4 | 45.3 | 56.6 | 64.7 | 72.2 | 70.8 | 59.1 | 46.1 | 36.8 | 24.7 | 44.7 |
| 1994 | 7.1 | 15.4 | 30.2 | 44.5 | 54.8 | 68.6 | 74.2 | 66.5 | 59.6 | 49.8 | 41.1 | 28.7 | 45.0 |
| 1995 | 27.9 | 19.0 | 35.0 | 40.4 | 56.4 | 69.6 | 74.7 | 70.0 | 57.5 | 54.1 | 35.2 | 22.0 | 46.8 |
| 1996 | 17.5 | 21.3 | 28.6 | 42.8 | 54.4 | 66.3 | 68.6 | 68.9 | 62.0 | 47.4 | 32.8 | 32.7 | 45.3 |
| 1997 | 19.1 | 25.0 | 26.9 | 41.4 | 51.4 | 67.3 | 68.7 | 66.8 | 58.6 | 46.6 | 35.1 | 25.8 | 44.4 |
| 1998 | 22.7 | 27.7 | 34.3 | 46.4 | 62.0 | 66.1 | 68.9 | 68.5 | 61.5 | 49.6 | 39.7 | 32.0 | 48.3 |
| 1999 | 19.1 | 24.8 | 30.9 | 44.7 | 59.8 | 70.5 | 74.2 | 68.1 | 64.5 | 46.2 | 42.6 | 28.7 | 47.8 |
| 2000 | 18.1 | 22.1 | 36.5 | 42.7 | 56.7 | 63.6 | 67.5 | 67.7 | 58.8 | 48.8 | 37.2 | 19.6 | 44.9 |
| 2001 | 20.1 | 22.1 | 27.2 | 43.2 | 58.7 | 67.2 | 68.0 | 72.6 | 61.3 | 51.1 | 42.4 | 32.7 | 47.2 |
| POR=109 YRS | 17.9 | 18.9 | 29.7 | 43.0 | 55.6 | 65.0 | 69.9 | 67.6 | 59.6 | 48.5 | 36.9 | 23.8 | 44.7 |
REFERENCE NOTES:
PAGE 1:
THE TEMPERATURE GRAPH SHOWS NORMAL MAXIMUM AND NORMAL MINIMUM DAILY TEMPERATURES (SOLID CURVES) AND THE ACTUAL DAILY HIGH AND LOW TEMPERATURES (VERTICAL BARS).
PAGE 2 AND 3:
H/C INDICATES HEATING AND COOLING DEGREE DAYS.
RH INDICATES RELATIVE HUMIDITY
W/O INDICATES WEATHER AND OBSTRUCTIONS
S INDICATES SUNSHINE.
PR INDICATES PRESSURE.
CLOUDINESS ON PAGE 3 IS THE SUM OF THE CEILOMETER AND SATELLITE DATA NOT TO EXCEED EIGHT EIGHTHS (OKTAS).
GENERAL:
T INDICATES TRACE PRECIPITATION, AN AMOUNT GREATER THAN ZERO BUT LESS THAN THE LOWEST REPORTABLE VALUE.
+ INDICATES THE VALUE ALSO OCCURS ON EARLIER DATES.
BLANK ENTRIES DENOTE MISSING OR UNREPORTED DATA.
NORMALS ARE 30–YEAR AVERAGES (1961–1990).
ASOS INDICATES AUTOMATED SURFACE OBSERVING SYSTEM.
PM INDICATES THE LAST DAY OF THE PREVIOUS MONTH.
POR (PERIOD OF RECORD) BEGINS WITH THE JANUARY DATA MONTH AND IS THE NUMBER OF YEARS USED TO COMPUTE THE MEAN. INDIVIDUAL MONTHS WITHIN THE POR MAY BE MISSING.
WHEN THE POR FOR A NORMAL IS LESS THAN 30 YEARS, THE NORMAL IS PROVISIONAL AND IS BASED ON THE NUMBER OF YEARS INDICATED.
0.* OR * INDICATES THE VALUE OR MEAN–DAYS–WITH IS BETWEEN 0.00 AND 0.05.
CLOUDINESS FOR ASOS STATIONS DIFFERS FROM THE NON–ASOS OBSERVATION TAKEN BY A HUMAN OBSERVER. ASOS STATION CLOUDINESS IS BASED ON TIME–AVERAGED CEILOMETER DATA FOR CLOUDS AT OR BELOW 12,000 FEET AND ON SATELLITE DATA FOR CLOUDS ABOVE 12,000 FEET.
THE NUMBER OF DAYS WITH CLEAR, PARTLY CLOUDY, AND CLOUDY CONDITIONS FOR ASOS STATIONS IS THE SUM OF THE CEILOMETER AND SATELLITE DATA FOR THE SUNRISE TO SUNSET PERIOD.
GENERAL CONTINUED:
CLEAR INDICATES 0–2 OKTAS, PARTLY CLOUDY INDICATES 3–6 OKTAS, AND CLOUDY INDICATES 7 OR 8 OKTAS. WHEN AT LEAST ONE OF THE ELEMENTS (CEILOMETER OR SATELLITE) IS MISSING, THE DAILY CLOUDINESS IS NOT COMPUTED.
WIND DIRECTION IS RECORDED IN TENS OF DEGREES (2 DIGITS) CLOCKWISE FROM TRUE NORTH. "00" INDICATES CALM. "36" INDICATES TRUE NORTH.
RESULTANT WIND IS THE VECTOR AVERAGE OF THE SPEED AND DIRECTION.
AVERAGE TEMPERATURE IS THE SUM OF THE MEAN DAILY MAXIMUM AND MINIMUM TEMPERATURE DIVIDED BY 2.
SNOWFALL DATA COMPRISE ALL FORMS OF FROZEN PRECIPITATION, INCLUDING HAIL.
A HEATING (COOLING) DEGREE DAY IS THE DIFFERENCE BETWEEN THE AVERAGE DAILY TEMPERATURE AND 65 F.
DRY BULB IS THE TEMPERATURE OF THE AMBIENT AIR.
DEW POINT IS THE TEMPERATURE TO WHICH THE AIR MUST BE COOLED TO ACHIEVE 100 PERCENT RELATIVE HUMIDITY.
WET BULB IS THE TEMPERATURE THE AIR WOULD HAVE IF THE MOISTURE CONTENT WAS INCREASED TO 100 PERCENT RELATIVE HUMIDITY.
ON JULY 1, 1996, THE NATIONAL WEATHER SERVICE BEGAN USING THE "METAR" OBSERVATION CODE THAT WAS ALREADY EMPLOYED BY MOST OTHER NATIONS OF THE WORLD. THE MOST NOTICEABLE DIFFERENCE IN THIS ANNUAL PUBLICATION WILL BE THE CHANGE IN UNITS FROM TENTHS TO EIGHTS (OKTAS) FOR REPORTING THE AMOUNT OF SKY COVER.
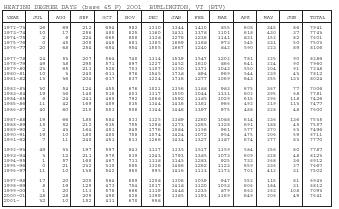
| HEATING DEGREE DAYS (base 65 F) 2001 BURLINGTON, VT (BTV) | |||||||||||||
| YEAR | JUL | AUG | SEP | OCT | NOV | DEC | JAN | FEB | MAR | APR | MAY | JUN | TOTAL |
| 1972-73 | 26 | 69 | 212 | 694 | 982 | 1310 | 1344 | 1410 | 855 | 608 | 345 | 86 | 7941 |
| 1973-74 | 10 | 17 | 256 | 480 | 825 | 1160 | 1431 | 1378 | 1101 | 618 | 430 | 37 | 7743 |
| 1974-75 | 2 | 6 | 224 | 665 | 858 | 1128 | 1276 | 1236 | 1141 | 831 | 152 | 82 | 7601 |
| 1975-76 | 0 | 45 | 208 | 448 | 681 | 1385 | 1669 | 1168 | 973 | 545 | 331 | 50 | 7503 |
| 1976-77 | 20 | 68 | 254 | 654 | 954 | 1505 | 1667 | 1240 | 842 | 590 | 223 | 89 | 8106 |
| 1977-78 | 24 | 53 | 207 | 564 | 740 | 1314 | 1539 | 1547 | 1202 | 781 | 225 | 90 | 8286 |
| 1978-79 | 49 | 38 | 295 | 571 | 897 | 1227 | 1452 | 1610 | 866 | 641 | 224 | 90 | 7960 |
| 1979-80 | 23 | 65 | 213 | 528 | 703 | 1107 | 1350 | 1371 | 1043 | 550 | 204 | 91 | 7248 |
| 1980-81 | 10 | 3 | 240 | 611 | 976 | 1545 | 1738 | 894 | 969 | 544 | 239 | 43 | 7812 |
| 1981-82 | 13 | 36 | 204 | 617 | 837 | 1224 | 1716 | 1277 | 1069 | 643 | 255 | 133 | 8024 |
| 1982-83 | 30 | 54 | 124 | 455 | 676 | 1021 | 1356 | 1188 | 983 | 675 | 367 | 77 | 7006 |
| 1983-84 | 19 | 36 | 148 | 518 | 803 | 1317 | 1500 | 1044 | 1331 | 602 | 395 | 68 | 7781 |
| 1984-85 | 6 | 24 | 241 | 460 | 792 | 1068 | 1592 | 1185 | 1029 | 615 | 296 | 118 | 7426 |
| 1985-86 | 11 | 42 | 169 | 489 | 835 | 1344 | 1436 | 1361 | 966 | 492 | 219 | 113 | 7477 |
| 1986-87 | 40 | 60 | 215 | 553 | 906 | 1144 | 1446 | 1397 | 975 | 488 | 328 | 48 | 7600 |
| 1987-88 | 19 | 66 | 185 | 584 | 833 | 1125 | 1389 | 1260 | 1088 | 614 | 236 | 136 | 7535 |
| 1988-89 | 15 | 52 | 212 | 635 | 755 | 1298 | 1273 | 1265 | 1128 | 691 | 188 | 45 | 7557 |
| 1989-90 | 2 | 43 | 164 | 451 | 849 | 1776 | 1084 | 1156 | 961 | 577 | 370 | 63 | 7496 |
| 1990-91 | 19 | 10 | 180 | 480 | 758 | 1074 | 1424 | 1072 | 954 | 475 | 206 | 59 | 6711 |
| 1991-92 | 7 | 11 | 240 | 451 | 813 | 1266 | 1434 | 1327 | 1187 | 674 | 277 | 83 | 7770 |
| 1992-93 | 49 | 33 | 197 | 597 | 843 | 1137 | 1335 | 1517 | 1159 | 584 | 256 | 80 | 7787 |
| 1993-94 | 3 | 12 | 211 | 579 | 839 | 1243 | 1793 | 1385 | 1073 | 609 | 328 | 48 | 8123 |
| 1994-95 | 1 | 57 | 168 | 467 | 711 | 1118 | 1145 | 1283 | 925 | 733 | 268 | 36 | 6912 |
| 1995-96 | 0 | 21 | 232 | 330 | 885 | 1326 | 1466 | 1262 | 1123 | 659 | 336 | 27 | 7667 |
| 1996-97 | 11 | 10 | 138 | 542 | 960 | 995 | 1416 | 1113 | 1173 | 701 | 412 | 31 | 7502 |
| 1997-98 | 17 | 20 | 205 | 564 | 889 | 1208 | 1306 | 1039 | 947 | 552 | 115 | 81 | 6943 |
| 1998-99 | 8 | 19 | 129 | 473 | 754 | 1017 | 1418 | 1120 | 1053 | 606 | 184 | 31 | 6812 |
| 1999-00 | 1 | 20 | 113 | 578 | 666 | 1119 | 1448 | 1235 | 879 | 663 | 263 | 108 | 7093 |
| 2000-01 | 28 | 28 | 209 | 498 | 828 | 1399 | 1385 | 1193 | 1169 | 649 | 206 | 49 | 7641 |
| 2001- | 32 | 10 | 152 | 431 | 670 | 998 | |||||||
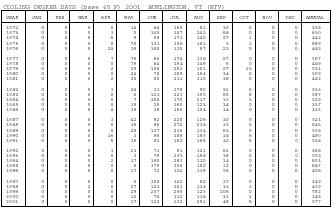
| COOLING DEGREE DAYS (base 65 F) 2001 BURLINGTON, VT (BTV) | |||||||||||||
| YEAR | JAN | FEB | MAR | APR | MAY | JUN | JUL | AUG | SEP | OCT | NOV | DEC | ANNUAL |
| 1972 | 0 | 0 | 0 | 0 | 14 | 64 | 169 | 81 | 30 | 0 | 0 | 0 | 358 |
| 1973 | 0 | 0 | 0 | 3 | 0 | 149 | 187 | 243 | 68 | 0 | 0 | 0 | 650 |
| 1974 | 0 | 0 | 0 | 5 | 9 | 89 | 171 | 140 | 27 | 1 | 0 | 0 | 442 |
| 1975 | 0 | 0 | 0 | 0 | 75 | 131 | 306 | 181 | 5 | 1 | 0 | 0 | 699 |
| 1976 | 0 | 0 | 0 | 24 | 19 | 185 | 135 | 97 | 23 | 0 | 0 | 0 | 483 |
| 1977 | 0 | 0 | 0 | 7 | 75 | 86 | 174 | 138 | 27 | 0 | 0 | 0 | 507 |
| 1978 | 0 | 0 | 0 | 0 | 79 | 64 | 194 | 146 | 6 | 0 | 0 | 0 | 489 |
| 1979 | 0 | 0 | 0 | 2 | 29 | 106 | 253 | 101 | 27 | 13 | 0 | 0 | 531 |
| 1980 | 0 | 0 | 0 | 0 | 24 | 78 | 189 | 184 | 34 | 0 | 0 | 0 | 509 |
| 1981 | 0 | 0 | 0 | 2 | 35 | 85 | 211 | 110 | 39 | 0 | 0 | 0 | 482 |
| 1982 | 0 | 0 | 0 | 1 | 24 | 11 | 179 | 90 | 51 | 0 | 0 | 0 | 356 |
| 1983 | 0 | 0 | 0 | 0 | 0 | 121 | 223 | 155 | 92 | 6 | 0 | 0 | 597 |
| 1984 | 0 | 0 | 0 | 0 | 7 | 106 | 175 | 217 | 15 | 3 | 0 | 0 | 523 |
| 1985 | 0 | 0 | 0 | 0 | 15 | 25 | 160 | 123 | 34 | 0 | 0 | 0 | 357 |
| 1986 | 0 | 0 | 0 | 4 | 19 | 38 | 156 | 104 | 14 | 0 | 0 | 0 | 335 |
| 1987 | 0 | 0 | 0 | 3 | 42 | 92 | 228 | 126 | 30 | 0 | 0 | 0 | 521 |
| 1988 | 0 | 0 | 0 | 0 | 19 | 96 | 274 | 238 | 15 | 3 | 0 | 0 | 645 |
| 1989 | 0 | 0 | 0 | 0 | 28 | 117 | 216 | 134 | 63 | 0 | 0 | 0 | 558 |
| 1990 | 0 | 0 | 0 | 16 | 1 | 95 | 189 | 165 | 18 | 6 | 0 | 0 | 490 |
| 1991 | 0 | 0 | 0 | 5 | 35 | 92 | 182 | 186 | 32 | 6 | 0 | 0 | 538 |
| 1992 | 0 | 0 | 0 | 3 | 21 | 71 | 91 | 121 | 61 | 0 | 0 | 0 | 368 |
| 1993 | 0 | 0 | 0 | 0 | 2 | 79 | 235 | 198 | 39 | 0 | 0 | 0 | 553 |
| 1994 | 0 | 0 | 0 | 2 | 17 | 165 | 293 | 110 | 14 | 0 | 0 | 0 | 601 |
| 1995 | 0 | 0 | 0 | 0 | 8 | 179 | 306 | 182 | 12 | 0 | 0 | 0 | 687 |
| 1996 | 0 | 0 | 0 | 0 | 17 | 72 | 124 | 139 | 56 | 0 | 0 | 0 | 408 |
| 1997 | 0 | 0 | 0 | 0 | 0 | 108 | 142 | 82 | 17 | 0 | 0 | 0 | 349 |
| 1998 | 0 | 0 | 2 | 0 | 27 | 121 | 141 | 134 | 33 | 1 | 0 | 0 | 459 |
| 1999 | 0 | 0 | 0 | 0 | 29 | 207 | 295 | 125 | 106 | 0 | 0 | 0 | 762 |
| 2000 | 0 | 0 | 0 | 0 | 12 | 74 | 112 | 118 | 31 | 1 | 0 | 0 | 348 |
| 2001 | 0 | 0 | 0 | 0 | 17 | 122 | 132 | 251 | 49 | 6 | 0 | 0 | 577 |
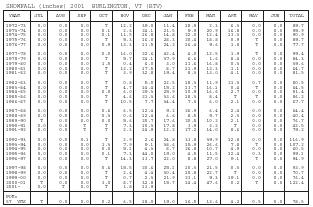
| SNOWFALL (inches) 2001 BURLINGTON, VT (BTV) | |||||||||||||
| YEAR | JUL | AUG | SEP | OCT | NOV | DEC | JAN | FEB | MAR | APR | MAY | JUN | TOTAL |
| 1972-73 | 0.0 | 0.0 | 0.0 | T | 12.2 | 39.0 | 11.4 | 18.5 | 2.3 | 6.3 | 0.0 | 0.0 | 89.7 |
| 1973-74 | 0.0 | 0.0 | 0.0 | 0.1 | 2.6 | 24.1 | 21.5 | 9.9 | 20.9 | 16.8 | 0.0 | 0.0 | 95.9 |
| 1974-75 | 0.0 | 0.0 | 0.0 | 0.1 | 11.5 | 16.8 | 14.8 | 22.0 | 12.4 | 13.3 | 0.0 | 0.0 | 90.9 |
| 1975-76 | 0.0 | 0.0 | 0.0 | T | 5.3 | 16.0 | 28.3 | 20.4 | 18.8 | 0.9 | T | 0.0 | 89.7 |
| 1976-77 | 0.0 | 0.0 | 0.0 | 0.9 | 13.3 | 11.5 | 24.2 | 16.4 | 9.6 | 1.8 | T | 0.0 | 77.7 |
| 1977-78 | 0.0 | 0.0 | 0.0 | 0.0 | 16.0 | 22.6 | 42.4 | 4.0 | 12.5 | 1.9 | T | 0.0 | 99.4 |
| 1978-79 | 0.0 | 0.0 | 0.0 | T | 5.7 | 24.1 | 37.9 | 6.6 | 1.6 | 8.4 | 0.0 | 0.0 | 84.3 |
| 1979-80 | 0.0 | 0.0 | 0.0 | 1.5 | 0.4 | 6.0 | 3.0 | 11.6 | 16.8 | 0.3 | 0.0 | 0.0 | 39.6 |
| 1980-81 | 0.0 | 0.0 | 0.0 | T | 12.2 | 17.5 | 8.7 | 11.9 | 13.3 | 1.1 | 0.0 | 0.0 | 64.7 |
| 1981-82 | 0.0 | 0.0 | 0.0 | T | 3.9 | 32.8 | 19.4 | 8.3 | 13.0 | 4.1 | 0.0 | 0.0 | 81.5 |
| 1982-83 | 0.0 | 0.0 | 0.0 | T | 0.8 | 5.0 | 22.5 | 18.3 | 11.9 | 21.3 | 0.7 | 0.0 | 80.5 |
| 1983-84 | 0.0 | 0.0 | 0.0 | T | 4.7 | 14.4 | 15.2 | 13.7 | 16.1 | 0.4 | T | 0.0 | 64.5 |
| 1984-85 | 0.0 | 0.0 | 0.0 | 0.0 | 6.0 | 29.3 | 25.9 | 10.9 | 16.6 | 2.7 | 0.0 | 0.0 | 91.4 |
| 1985-86 | 0.0 | 0.0 | 0.0 | T | 4.6 | 21.3 | 33.6 | 18.3 | 8.4 | T | T | 0.0 | 86.2 |
| 1986-87 | 0.0 | 0.0 | 0.0 | T | 10.5 | 7.7 | 34.4 | 7.0 | 6.0 | 2.1 | 0.0 | 0.0 | 67.7 |
| 1987-88 | 0.0 | 0.0 | 0.0 | 0.6 | 6.5 | 12.4 | 9.2 | 26.9 | 6.4 | 2.4 | 0.0 | 0.0 | 64.4 |
| 1988-89 | 0.0 | 0.0 | 0.0 | 0.3 | 0.6 | 12.4 | 6.6 | 8.5 | 9.7 | 2.3 | 0.0 | 0.0 | 40.4 |
| 1989-90 | T | 0.0 | 0.0 | 0.0 | 5.6 | 20.7 | 17.6 | 20.5 | 10.2 | 2.1 | 0.0 | 0.0 | 76.7 |
| 1990-91 | 0.0 | 0.0 | T | T | 7.3 | 10.3 | 17.8 | 3.9 | 3.2 | T | 0.0 | 0.0 | 42.5 |
| 1991-92 | 0.0 | 0.0 | T | T | 2.3 | 14.9 | 12.2 | 27.2 | 14.0 | 8.6 | 0.0 | 0.0 | 79.2 |
| 1992-93 | 0.0 | 0.0 | 0.1 | T | 2.9 | 2.6 | 24.8 | 33.8 | 39.9 | 12.8 | 0.0 | 0.0 | 116.9 |
| 1993-94 | 0.0 | 0.0 | 0.0 | 1.3 | 7.9 | 9.1 | 38.6 | 15.9 | 26.6 | 7.8 | T | 0.0 | 107.2 |
| 1994-95 | 0.0 | 0.0 | 0.0 | 0.0 | 5.1 | 4.3 | 8.7 | 26.8 | 10.7 | 4.9 | 0.0 | 0.0 | 60.5 |
| 1995-96 | 0.0 | 0.0 | 0.0 | 0.1 | 7.3 | 44.0 | 19.0 | 4.5 | 11.5 | 12.4 | 0.3 | 0.0 | 99.1 |
| 1996-97 | 0.0 | 0.0 | 0.0 | T | 14.3 | 13.7 | 22.0 | 8.8 | 27.0 | 9.1 | T | 0.0 | 94.9 |
| 1997-98 | 0.0 | 0.0 | 0.0 | 0.6 | 15.5 | 20.6 | 25.1 | 10.3 | 21.5 | 0.3 | 0.0 | 0.0 | 93.9 |
| 1998-99 | 0.0 | 0.0 | 0.0 | T | 2.4 | 4.4 | 30.4 | 10.8 | 22.7 | T | 0.0 | 0.0 | 70.7 |
| 1999-00 | 0.0 | 0.0 | 0.0 | T | 0.7 | 2.3 | 21.9 | 23.1 | 9.3 | 19.1 | 0.0 | 0.0 | 76.4 |
| 2000-01 | T | 0.0 | 0.0 | 3.0 | 8.7 | 32.8 | 15.7 | 14.4 | 47.6 | 0.2 | T | 0.0 | 122.4 |
| 2001- | 0.0 | T | 0.0 | T | 1.8 | 13.9 | |||||||
| POR=57 YRS | T | 0.0 | 0.0 | 0.2 | 6.5 | 18.0 | 19.0 | 16.5 | 13.6 | 4.2 | 0.5 | 0.0 | 78.5 |
Comment about this article, ask questions, or add new information about this topic: