2001 SAN JUAN, PUERTO RICO (SJU)
San Juan, located on the north coast of the island of Puerto Rico, is surrounded by the waters of the Atlantic Ocean and San Juan Bay. Local custom assigns the name San Juan to the old city which lies right on the coast, but the modern metropolitan area extends inland about 12 miles. These inland sections have a temperature and rainfall regime significantly different from the coastal area. Isla Verde Airport, where weather observations are made, lies on the coast about 7 miles east of old San Juan. The surrounding terrain is level with a gradual upslope inland. Mountain ranges, with peak elevations of 4,000 feet, extend east and west through the central portion of Puerto Rico, and are located 15 to 20 miles east and south of San Juan. These mountain ranges have a decided influence on the rainfall of the San Juan metropolitan area, and on the entire island in general.
The climate is tropical maritime, characteristic of all tropical islands. The predominant easterly trade winds, modified by local effects such as the land and sea breeze and the particular island topography, are a primary feature of the climate of San Juan and have a significant influence on the temperature and rainfall. During daylight hours the wind blows almost constantly off the ocean. Usually, after sunset the wind shifts to the south or southeast, off land. This daily wind variation is a contributing factor to the delightful climate of the city. The annual temperature range is small with about a 5–6 degree difference between the temperatures of the warmest and coldest months. The inland sectors have warmer afternoons and cooler nights. In the interior mountain and valley regions even greater daily and annual ranges of temperature occur. The highest temperatures recorded in Puerto Rico have exceeded 105 degrees and the lowest have been near 40. Sea water temperatures range from 78 degrees in March to about 83 degrees in September.
Although rainfall in San Juan is nearly 60 inches, the geographical distribution of rainfall over the island shows the heaviest rainfall, of about 180 inches per year, in the Luquillo Range, only 23 miles distant from San Juan. The driest area, with annual rainfall of 30 to 35 inches, is located in the southwest corner of the island. Rain showers occur mostly in the afternoon and at night. The nocturnal showers, usually light, are a characteristic feature of the San Juan rainfall pattern. Rainfall is generally of the brief showery type except for the continuous rains occuring with the passage of tropical disturbances, or when the trailing edge of a cold front out of the United States reaches Puerto Rico. This normally occurs from about November to April.
Puerto Rico is in the tropical hurricane region of the eastern Caribbean. The hurricane season begins June 1 and ends November 30. Only a few hurricanes have passed close enough to San Juan to produce hurricane force winds or damage.
Mild temperatures, refreshing sea breezes in the daytime, plenty of sunshine, and adequate rainfall make the climate of San Juan most enjoyable for tourists and residents alike.
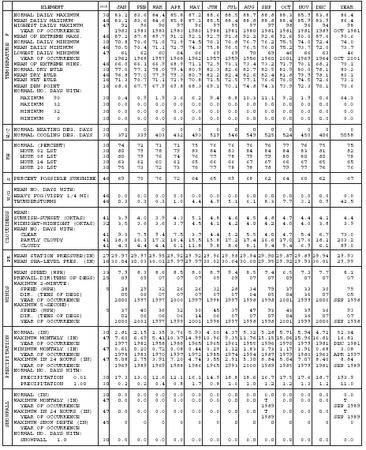
NORMALS, MEANS, AND EXTREMES
SAN JUAN, PR (SJU)
LATITUDE: LONGITUDE: ELEVATION (FT): TIME ZONE: WBAN: 11641
18 26′ 29″ N 66 00′ 08″ W GRND: 7 BARO: ;10 ATLANTIC (UTC + 4)
| ELEMENT | POR | JAN | FEB | MAR | APR | MAY | JUN | JUL | AUG | SEP | OCT | NOV | DEC | YEAR | |
| TEMPERATURE F | NORMAL DAILY MAXIMUM | 30 | 83.2 | 83.6 | 84.4 | 85.8 | 87.2 | 88.6 | 88.5 | 88.7 | 88.8 | 88.3 | 85.9 | 83.8 | 86.4 |
| MEAN DAILY MAXIMUM | 46 | 83.2 | 83.6 | 84.6 | 85.8 | 87.1 | 88.5 | 88.4 | 88.8 | 88.8 | 88.4 | 85.9 | 83.9 | 86.4 | |
| HIGHEST DAILY MAXIMUM | 47 | 92 | 96 | 96 | 97 | 96 | 97 | 95 | 97 | 97 | 98 | 96 | 94 | 98 | |
| YEAR OF OCCURRENCE | 1983 | 1983 | 1983 | 1983 | 1980 | 1988 | 1981 | 1980 | 1981 | 1981 | 1981 | 1989 | OCT 1981 | ||
| MEAN OF EXTREME MAXS. | 46 | 87.2 | 87.8 | 89.7 | 91.2 | 92.1 | 92.7 | 91.8 | 92.2 | 92.6 | 92.6 | 90.0 | 87.6 | 90.6 | |
| NORMAL DAILY MINIMUM | 30 | 70.8 | 70.6 | 71.6 | 72.9 | 74.5 | 76.1 | 76.8 | 76.7 | 76.2 | 75.5 | 74.0 | 72.4 | 74.0 | |
| MEAN DAILY MINIMUM | 46 | 70.5 | 70.4 | 71.1 | 72.7 | 74.3 | 75.8 | 76.5 | 76.5 | 76.0 | 75.2 | 73.7 | 72.0 | 73.7 | |
| LOWEST DAILY MINIMUM | 47 | 61 | 62 | 60 | 64 | 66 | 69 | 69 | 70 | 69 | 46 | 66 | 63 | 46 | |
| YEAR OF OCCURRENCE | 1962 | 1968 | 1957 | 1968 | 1962 | 1957 | 1959 | 1956 | 1960 | 2001 | 1969 | 1964 | OCT 2001 | ||
| MEAN OF EXTREME MINS. | 46 | 66.0 | 66.1 | 66.9 | 68.9 | 71.1 | 72.9 | 73.1 | 73.4 | 73.2 | 71.7 | 70.1 | 68.2 | 70.1 | |
| NORMAL DRY BULB | 30 | 77.0 | 77.1 | 78.0 | 79.4 | 80.9 | 82.3 | 82.6 | 82.7 | 82.5 | 81.9 | 80.0 | 78.1 | 80.2 | |
| MEAN DRY BULB | 46 | 76.8 | 77.0 | 77.9 | 79.3 | 80.7 | 82.2 | 82.4 | 82.6 | 82.4 | 81.8 | 79.9 | 78.1 | 80.1 | |
| MEAN WET BULB | 16 | 71.3 | 70.7 | 71.1 | 72.9 | 70.8 | 71.5 | 72.5 | 77.1 | 76.6 | 76.0 | 74.5 | 72.6 | 73.1 | |
| MEAN DEW POINT | 16 | 68.6 | 67.7 | 67.9 | 69.8 | 68.3 | 69.1 | 70.1 | 74.8 | 74.3 | 73.9 | 72.3 | 70.1 | 70.6 | |
| NORMAL NO. DAYS WITH: | |||||||||||||||
| MAXIMUM 90 | 30 | 0.4 | 0.9 | 1.9 | 3.6 | 6.2 | 9.4 | 8.8 | 10.3 | 11.1 | 9.2 | 1.9 | 0.6 | 64.3 | |
| MAXIMUM 32 | 30 | 0.0 | 0.0 | 0.0 | 0.0 | 0.0 | 0.0 | 0.0 | 0.0 | 0.0 | 0.0 | 0.0 | 0.0 | 0.0 | |
| MINIMUM 32 | 30 | 0.0 | 0.0 | 0.0 | 0.0 | 0.0 | 0.0 | 0.0 | 0.0 | 0.0 | 0.0 | 0.0 | 0.0 | 0.0 | |
| MINIMUM 0 | 30 | 0.0 | 0.0 | 0.0 | 0.0 | 0.0 | 0.0 | 0.0 | 0.0 | 0.0 | 0.0 | 0.0 | 0.0 | 0.0 | |
| H/C | NORMAL HEATING DEG. DAYS | 30 | 0 | 0 | 0 | 0 | 0 | 0 | 0 | 0 | 0 | 0 | 0 | 0 | 0 |
| NORMAL COOLING DEG. DAYS | 30 | 372 | 339 | 403 | 432 | 493 | 519 | 546 | 549 | 525 | 524 | 450 | 406 | 5558 | |
| RH | NORMAL (PERCENT) | 30 | 74 | 72 | 71 | 71 | 75 | 76 | 76 | 76 | 76 | 77 | 76 | 75 | 75 |
| HOUR 02 LST | 30 | 80 | 79 | 78 | 79 | 83 | 84 | 83 | 84 | 84 | 84 | 83 | 81 | 82 | |
| HOUR 08 LST | 30 | 80 | 79 | 76 | 74 | 76 | 77 | 78 | 79 | 79 | 80 | 80 | 80 | 78 | |
| HOUR 14 LST | 30 | 63 | 62 | 60 | 61 | 65 | 66 | 66 | 67 | 67 | 66 | 67 | 65 | 65 | |
| HOUR 20 LST | 30 | 75 | 73 | 72 | 73 | 76 | 77 | 78 | 78 | 78 | 79 | 77 | 76 | 76 | |
| S | PERCENT POSSIBLE SUNSHINE | 46 | 69 | 70 | 76 | 72 | 64 | 65 | 69 | 68 | 62 | 64 | 60 | 62 | 67 |
| W/O | MEAN NO. DAYS WITH: | ||||||||||||||
| HEAVY FOG(VISBY 1/4 MI) | 46 | 0.0 | 0.0 | 0.0 | 0.0 | 0.0 | 0.0 | 0.0 | 0.0 | 0.0 | 0.0 | 0.0 | 0.0 | 0.0 | |
| THUNDERSTORMS | 46 | 0.3 | 0.3 | 0.3 | 1.0 | 4.4 | 4.9 | 5.1 | 6.1 | 8.3 | 7.7 | 3.2 | 0.9 | 42.5 | |
| CLOUDINESS | MEAN: | ||||||||||||||
| SUNRISE-SUNSET (OKTAS) | 41 | 3.9 | 4.0 | 3.9 | 4.3 | 5.1 | 4.8 | 4.6 | 4.5 | 4.8 | 4.7 | 4.4 | 4.2 | 4.4 | |
| MIDNIGHT-MIDNIGHT (OKTAS) | 32 | 3.5 | 3.6 | 3.6 | 3.7 | 4.5 | 4.1 | 4.2 | 4.0 | 4.2 | 4.0 | 4.0 | 3.8 | 3.9 | |
| MEAN NO. DAYS WITH: | |||||||||||||||
| CLEAR | 41 | 9.0 | 7.5 | 9.4 | 7.5 | 3.7 | 4.4 | 5.2 | 5.5 | 4.0 | 4.7 | 5.4 | 6.7 | 73.0 | |
| PARTLY CLOUDY | 41 | 18.0 | 16.3 | 17.2 | 16.4 | 15.5 | 15.8 | 17.2 | 17.4 | 16.6 | 17.0 | 17.6 | 18.2 | 203.2 | |
| CLOUDY | 41 | 4.0 | 4.4 | 4.4 | 6.1 | 11.8 | 9.8 | 8.6 | 8.1 | 9.4 | 9.4 | 6.9 | 6.1 | 89.0 | |
| PR | MEAN STATION PRESSURE(IN) | 27 | 29.97 | 29.97 | 29.95 | 29.92 | 29.92 | 29.96 | 29.98 | 29.94 | 29.90 | 29.87 | 29.89 | 29.94 | 29.93 |
| MEAN SEA-LEVEL PRES. (IN) | 16 | 30.04 | 30.03 | 30.01 | 29.97 | 29.97 | 30.02 | 30.04 | 30.00 | 29.95 | 29.92 | 29.93 | 30.01 | 29.99 | |
| WINDS | MEAN SPEED (MPH) | 33 | 7.9 | 8.3 | 8.6 | 8.5 | 8.0 | 8.7 | 9.4 | 8.5 | 7.4 | 6.5 | 7.3 | 7.7 | 8.1 |
| PREVAIL. DIR (TENS OF DEGS) | 25 | 09 | 09 | 07 | 07 | 07 | 09 | 09 | 07 | 07 | 09 | 07 | 07 | 07 | |
| MAXIMUM 2-MINUTE: | |||||||||||||||
| SPEED (MPH) | 5 | 28 | 29 | 32 | 26 | 26 | 32 | 28 | 34 | 79 | 37 | 33 | 30 | 79 | |
| DIR. (TENS OF DEGS) | 05 | 06 | 07 | 07 | 07 | 07 | 07 | 04 | 05 | 04 | 36 | 07 | 05 | ||
| YEAR OF OCCURRENCE | 2000 | 1997 | 1997 | 2000 | 1997 | 1998 | 1997 | 1998 | 1998 | 2001 | 1999 | 2000 | SEP 1998 | ||
| MAXIMUM 5-SECOND: | |||||||||||||||
| SPEED (MPH) | 5 | 37 | 40 | 36 | 32 | 30 | 45 | 37 | 47 | 93 | 43 | 39 | 36 | 93 | |
| DIR. (TENS OF DEGS) | 02 | 06 | 06 | 06 | 14 | 06 | 07 | 07 | 07 | 04 | 36 | 07 | 07 | ||
| YEAR OF OCCURRENCE | 2000 | 2001 | 1997 | 1999 | 2001 | 1998 | 1997 | 1998 | 1998 | 2001 | 1999 | 2000 | SEP 1998 | ||
| PRECIPITATION | NORMAL (IN) | 30 | 2.81 | 2.15 | 2.35 | 3.76 | 5.93 | 4.00 | 4.37 | 5.32 | 5.28 | 5.71 | 5.94 | 4.72 | 52.34 |
| MAXIMUM MONTHLY (IN) | 47 | 7.60 | 6.69 | 5.41 | 10.37 | 14.99 | 10.96 | 9.35 | 11.76 | 15.15 | 15.06 | 15.96 | 16.81 | 16.81 | |
| YEAR OF OCCURRENCE | 1977 | 1982 | 1958 | 1988 | 1965 | 1965 | 1961 | 1955 | 1996 | 1970 | 1979 | 1981 | DEC 1981 | ||
| MINIMUM MONTHLY (IN) | 47 | 0.61 | 0.20 | 0.72 | 0.08 | 0.44 | 0.29 | 1.12 | 1.83 | 1.73 | 1.17 | 1.91 | 0.68 | 0.08 | |
| YEAR OF OCCURRENCE | 1978 | 1983 | 1970 | 1997 | 1972 | 1985 | 1974 | 1994 | 1987 | 1979 | 1980 | 1963 | APR 1997 | ||
| MAXIMUM IN 24 HOURS (IN) | 47 | 5.08 | 2.75 | 3.91 | 7.20 | 4.74 | 3.55 | 2.91 | 5.30 | 8.84 | 5.04 | 7.07 | 8.40 | 8.84 | |
| YEAR OF OCCURRENCE | 1969 | 1989 | 1969 | 1988 | 1986 | 1965 | 1993 | 2000 | 1989 | 1985 | 1979 | 1981 | SEP 1989 | ||
| NORMAL NO. DAYS WITH: | |||||||||||||||
| PRECIPITATION 0.01 | 30 | 17.3 | 13.0 | 12.6 | 12.1 | 16.1 | 14.9 | 18.8 | 18.6 | 16.7 | 17.5 | 17.6 | 18.7 | 193.9 | |
| PRECIPITATION 1.00 | 30 | 0.2 | 0.2 | 0.4 | 0.8 | 1.7 | 0.8 | 1.0 | 1.0 | 1.2 | 1.2 | 1.3 | 1.2 | 11.0 | |
| SNOWFALL | NORMAL (IN) | 30 | 0.0 | 0.0 | 0.0 | 0.0 | 0.0 | 0.0 | 0.0 | 0.0 | 0.0 | 0.0 | 0.0 | 0.0 | 0.0 |
| MAXIMUM MONTHLY (IN) | 47 | 0.0 | 0.0 | 0.0 | 0.0 | 0.0 | 0.0 | 0.0 | 0.0 | T | 0.0 | 0.0 | 0.0 | T | |
| YEAR OF OCCURRENCE | 1989 | SEP 1989 | |||||||||||||
| MAXIMUM IN 24 HOURS (IN) | 47 | 0.0 | 0.0 | 0.0 | 0.0 | 0.0 | 0.0 | 0.0 | 0.0 | T | 0.0 | 0.0 | 0.0 | T | |
| YEAR OF OCCURRENCE | 1989 | SEP 1989 | |||||||||||||
| MAXIMUM SNOW DEPTH (IN) | 45 | 0 | 0 | 0 | 0 | 0 | 0 | 0 | 0 | 0 | 0 | 0 | 0 | 0 | |
| YEAR OF OCCURRENCE | |||||||||||||||
| NORMAL NO. DAYS WITH: | |||||||||||||||
| SNOWFALL 1.0 | 30 | 0.0 | 0.0 | 0.0 | 0.0 | 0.0 | 0.0 | 0.0 | 0.0 | 0.0 | 0.0 | 0.0 | 0.0 | 0.0 |
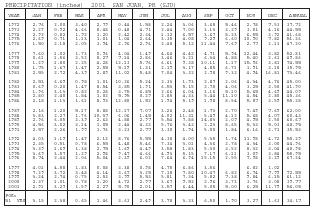
| PRECIPITATION (inches) 2001 SAN JUAN, PR (SJU) | |||||||||||||
| YEAR | JAN | FEB | MAR | APR | MAY | JUN | JUL | AUG | SEP | OCT | NOV | DEC | ANNUAL |
| 1972 | 2.76 | 2.00 | 3.40 | 2.79 | 0.44 | 1.58 | 2.24 | 3.06 | 3.68 | 5.46 | 2.78 | 7.53 | 37.72 |
| 1973 | 2.27 | 0.92 | 4.66 | 8.48 | 0.48 | 4.71 | 2.44 | 7.00 | 3.13 | 3.29 | 3.01 | 4.16 | 44.55 |
| 1974 | 2.92 | 0.82 | 1.92 | 1.20 | 2.42 | 2.34 | 1.12 | 6.57 | 3.67 | 8.23 | 6.55 | 3.92 | 41.68 |
| 1975 | 2.69 | 0.71 | 1.13 | 1.01 | 1.04 | 2.64 | 3.35 | 4.08 | 9.29 | 6.60 | 10.90 | 7.82 | 51.26 |
| 1976 | 1.50 | 2.18 | 2.05 | 3.94 | 2.96 | 2.96 | 2.48 | 5.12 | 11.44 | 7.69 | 2.77 | 2.11 | 47.20 |
| 1977 | 7.60 | 1.02 | 1.73 | 0.96 | 4.04 | 1.49 | 4.64 | 4.42 | 4.71 | 5.94 | 12.44 | 3.82 | 52.81 |
| 1978 | 0.61 | 1.56 | 3.52 | 8.27 | 7.14 | 2.86 | 3.46 | 3.21 | 6.34 | 4.88 | 5.40 | 2.61 | 49.86 |
| 1979 | 1.29 | 1.80 | 2.25 | 4.28 | 12.13 | 5.76 | 6.61 | 9.38 | 10.11 | 1.17 | 15.96 | 3.81 | 74.55 |
| 1980 | 1.75 | 1.67 | 1.47 | 2.55 | 5.19 | 1.31 | 2.19 | 3.17 | 4.85 | 6.71 | 1.91 | 3.18 | 35.95 |
| 1981 | 2.55 | 2.72 | 4.39 | 2.89 | 11.02 | 5.48 | 7.04 | 3.32 | 2.98 | 9.32 | 4.94 | 16.81 | 73.46 |
| 1982 | 2.53 | 6.69 | 0.98 | 1.01 | 10.26 | 5.24 | 2.33 | 1.93 | 2.87 | 2.06 | 4.34 | 4.76 | 45.00 |
| 1983 | 0.69 | 0.20 | 1.47 | 8.54 | 3.85 | 1.91 | 6.53 | 5.15 | 2.75 | 4.06 | 3.25 | 3.50 | 41.90 |
| 1984 | 1.96 | 3.13 | 0.82 | 0.28 | 3.75 | 6.85 | 2.66 | 6.04 | 3.16 | 5.10 | 5.65 | 4.69 | 44.09 |
| 1985 | 2.80 | 2.40 | 1.84 | 1.02 | 5.95 | 0.29 | 2.85 | 4.33 | 5.44 | 11.10 | 4.54 | 2.80 | 45.36 |
| 1986 | 2.18 | 1.13 | 1.61 | 8.93 | 12.80 | 1.52 | 1.94 | 5.19 | 1.98 | 8.54 | 5.87 | 3.59 | 55.28 |
| 1987 | 2.16 | 1.20 | 5.17 | 8.88 | 12.17 | 7.07 | 3.26 | 2.48 | 1.73 | 2.70 | 7.49 | 7.69 | 62.00 |
| 1988 | 3.83 | 2.27 | 1.76 | 10.37 | 6.06 | 1.45 | 4.02 | 11.31 | 5.49 | 4.12 | 5.68 | 4.07 | 60.43 |
| 1989 | 2.96 | 6.05 | 3.39 | 2.63 | 4.88 | 2.97 | 5.54 | 7.88 | 14.83 | 2.09 | 4.95 | 2.50 | 60.67 |
| 1990 | 4.56 | 3.02 | 3.14 | 1.05 | 2.44 | 4.32 | 5.76 | 3.42 | 2.23 | 8.65 | 5.33 | 5.03 | 48.95 |
| 1991 | 2.57 | 2.26 | 1.99 | 1.76 | 3.23 | 2.77 | 3.30 | 1.94 | 5.00 | 1.84 | 6.16 | 2.71 | 35.53 |
| 1992 | 4.03 | 1.19 | 1.47 | 2.12 | 8.76 | 5.55 | 4.38 | 4.00 | 5.35 | 1.74 | 11.98 | 4.72 | 55.29 |
| 1993 | 2.35 | 0.51 | 0.78 | 6.55 | 4.48 | 5.46 | 7.34 | 3.01 | 4.36 | 2.78 | 4.34 | 3.00 | 44.96 |
| 1994 | 3.39 | 1.69 | 1.38 | 2.75 | 1.69 | 4.49 | 3.58 | 1.83 | 5.30 | 3.52 | 8.32 | 3.04 | 40.98 |
| 1995 | 3.69 | 3.57 | 1.29 | 2.98 | 9.47 | 4.66 | 4.93 | 5.15 | 7.17 | 6.11 | 3.09 | 3.84 | 55.95 |
| 1996 | 5.74 | 2.44 | 2.06 | 5.04 | 2.39 | 6.02 | 7.64 | 6.94 | 15.15 | 2.55 | 7.98 | 3.29 | 67.24 |
| 1997 | 4.01 | 4.58 | 1.83 | 0.08 | 3.38 | 0.98 | 4.75 | 6.86 | 3.56 | 6.82 | 1.02 | ||
| 1998 | 7.29 | 3.72 | 3.48 | 4.14 | 3.67 | 3.25 | 7.18 | 7.80 | 10.47 | 6.82 | 6.74 | 7.99 | 72.55 |
| 1999 | 3.24 | 2.74 | 0.75 | 2.53 | 3.99 | 5.53 | 5.81 | 7.34 | 5.82 | 7.38 | 9.84 | 6.15 | 61.12 |
| 2000 | 2.37 | 1.01 | 0.78 | 1.20 | 4.72 | 2.97 | 3.67 | 9.52 | 2.96 | 3.73 | 3.76 | 3.08 | 39.77 |
| 2001 | 2.91 | 3.27 | 1.59 | 2.27 | 5.90 | 2.01 | 3.57 | 6.44 | 5.05 | 5.00 | 6.25 | 11.79 | 56.05 |
| POR=51 YRS | 3.15 | 2.38 | 0.65 | 1.46 | 3.63 | 2.49 | 3.78 | 3.33 | 6.50 | 1.90 | 3.27 | 1.63 | 34.17 |
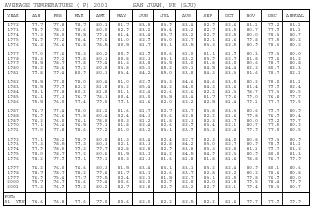
| AVERAGE TEMPERATURE (F) 2001 SAN JUAN, PR (SJU) | |||||||||||||
| YEAR | JAN | FEB | MAR | APR | MAY | JUN | JUL | AUG | SEP | OCT | NOV | DEC | ANNUAL |
| 1972 | 77.7 | 77.8 | 78.7 | 80.1 | 81.7 | 83.8 | 83.9 | 83.4 | 82.9 | 82.6 | 81.1 | 79.2 | 81.1 |
| 1973 | 78.9 | 78.3 | 78.6 | 80.0 | 82.9 | 83.2 | 83.4 | 83.2 | 82.7 | 83.5 | 80.7 | 77.9 | 81.1 |
| 1974 | 77.3 | 78.0 | 78.5 | 79.6 | 81.4 | 83.4 | 83.7 | 83.2 | 82.9 | 82.5 | 80.0 | 78.3 | 80.7 |
| 1975 | 76.9 | 77.2 | 78.4 | 79.6 | 81.0 | 82.9 | 83.0 | 82.7 | 82.1 | 81.6 | 79.8 | 77.5 | 80.2 |
| 1976 | 76.3 | 76.6 | 76.8 | 78.5 | 80.5 | 81.7 | 83.1 | 83.5 | 83.3 | 82.5 | 80.9 | 78.3 | 80.2 |
| 1977 | 77.0 | 77.6 | 78.3 | 80.2 | 80.9 | 81.9 | 80.6 | 81.0 | 81.1 | 81.9 | 80.3 | 79.3 | 80.0 |
| 1978 | 78.3 | 79.2 | 79.8 | 80.1 | 80.8 | 82.3 | 83.1 | 83.2 | 83.9 | 82.7 | 81.8 | 79.6 | 81.2 |
| 1979 | 78.5 | 78.7 | 77.8 | 79.4 | 81.3 | 83.8 | 83.5 | 83.0 | 81.8 | 83.0 | 80.6 | 78.7 | 80.8 |
| 1980 | 78.2 | 78.6 | 79.2 | 80.8 | 83.8 | 85.1 | 85.2 | 85.1 | 84.5 | 84.4 | 82.2 | 80.7 | 82.3 |
| 1981 | 79.8 | 79.4 | 80.9 | 80.3 | 83.4 | 84.2 | 85.0 | 83.8 | 84.3 | 83.3 | 81.6 | 78.7 | 82.1 |
| 1982 | 78.5 | 77.8 | 78.0 | 80.4 | 81.0 | 82.9 | 83.3 | 84.6 | 84.6 | 83.8 | 80.2 | 78.0 | 81.1 |
| 1983 | 78.5 | 79.9 | 82.2 | 81.8 | 83.2 | 85.4 | 84.2 | 84.0 | 84.3 | 83.6 | 81.4 | 79.9 | 82.4 |
| 1984 | 78.1 | 77.8 | 80.2 | 81.8 | 81.1 | 82.4 | 82.6 | 82.6 | 82.2 | 81.3 | 78.7 | 77.3 | 80.5 |
| 1985 | 76.1 | 77.3 | 76.7 | 78.3 | 80.4 | 83.0 | 83.5 | 83.4 | 81.7 | 79.6 | 79.0 | 76.8 | 79.7 |
| 1986 | 75.5 | 76.0 | 77.4 | 79.0 | 79.1 | 81.6 | 82.0 | 82.2 | 82.5 | 81.4 | 79.1 | 77.7 | 79.5 |
| 1987 | 76.7 | 77.4 | 78.0 | 81.2 | 81.6 | 81.7 | 82.7 | 83.7 | 83.8 | 83.3 | 80.6 | 79.7 | 80.9 |
| 1988 | 76.9 | 76.6 | 77.8 | 80.4 | 82.4 | 84.3 | 83.6 | 82.8 | 82.2 | 81.6 | 79.8 | 76.9 | 80.4 |
| 1989 | 76.2 | 76.0 | 76.1 | 78.8 | 80.3 | 81.2 | 81.8 | 82.3 | 82.3 | 81.7 | 80.0 | 79.2 | 79.7 |
| 1990 | 77.1 | 76.4 | 76.5 | 79.1 | 81.8 | 82.4 | 82.6 | 82.9 | 83.4 | 82.1 | 80.7 | 77.5 | 80.2 |
| 1991 | 77.0 | 77.8 | 78.6 | 79.2 | 81.0 | 83.2 | 83.1 | 83.9 | 83.3 | 82.4 | 79.9 | 77.0 | 80.5 |
| 1992 | 77.1 | 78.2 | 78.9 | 80.8 | 81.3 | 83.4 | 82.4 | 82.7 | 82.3 | 84.0 | 80.8 | 79.3 | 80.9 |
| 1993 | 77.3 | 78.5 | 79.3 | 80.3 | 82.1 | 83.3 | 82.8 | 84.2 | 83.0 | 82.7 | 80.9 | 78.9 | 81.1 |
| 1994 | 77.9 | 78.0 | 79.3 | 79.7 | 82.8 | 82.8 | 82.9 | 83.8 | 83.3 | 82.8 | 81.1 | 79.7 | 81.2 |
| 1995 | 78.0 | 78.7 | 77.2 | 80.6 | 81.5 | 83.3 | 84.2 | 84.5 | 84.9 | 82.3 | 80.9 | 80.0 | 81.3 |
| 1996 | 78.2 | 77.9 | 79.1 | 79.1 | 80.3 | 81.3 | 81.6 | 81.8 | 81.8 | 81.6 | 78.8 | 76.7 | 79.9 |
| 1997 | 76.2 | 76.0 | 76.6 | 80.3 | 81.5 | 83.4 | 83.1 | 83.1 | 83.2 | 82.4 | 80.9 | 80.1 | 80.6 |
| 1998 | 78.7 | 78.7 | 78.2 | 79.6 | 81.7 | 83.1 | 82.6 | 83.7 | 82.8 | 82.2 | 80.2 | 78.6 | 80.8 |
| 1999 | 76.9 | 75.4 | 77.7 | 79.5 | 82.4 | 82.1 | 81.5 | 82.7 | 83.1 | 81.5 | 79.8 | 76.9 | 80.0 |
| 2000 | 75.7 | 76.7 | 76.6 | 79.4 | 80.6 | 82.0 | 82.9 | 82.8 | 82.0 | 81.8 | 79.5 | 78.4 | 79.9 |
| 2001 | 77.3 | 76.9 | 79.2 | 80.2 | 82.7 | 82.8 | 82.9 | 83.2 | 82.9 | 82.1 | 79.4 | 78.3 | 80.7 |
| POR=51 YRS | 76.6 | 76.8 | 77.6 | 79.0 | 80.6 | 82.0 | 82.2 | 82.5 | 82.2 | 81.6 | 79.7 | 77.9 | 79.9 |
REFERENCE NOTES:
PAGE 1:
THE TEMPERATURE GRAPH SHOWS NORMAL MAXIMUM AND NORMAL MINIMUM DAILY TEMPERATURES (SOLID CURVES) AND THE ACTUAL DAILY HIGH AND LOW TEMPERATURES (VERTICAL BARS).
PAGE 2 AND 3:
H/C INDICATES HEATING AND COOLING DEGREE DAYS.
RH INDICATES RELATIVE HUMIDITY
W/O INDICATES WEATHER AND OBSTRUCTIONS
S INDICATES SUNSHINE.
PR INDICATES PRESSURE.
CLOUDINESS ON PAGE 3 IS THE SUM OF THE CEILOMETER AND SATELLITE DATA NOT TO EXCEED EIGHT EIGHTHS (OKTAS).
GENERAL:
T INDICATES TRACE PRECIPITATION, AN AMOUNT GREATER THAN ZERO BUT LESS THAN THE LOWEST REPORTABLE VALUE.
+ INDICATES THE VALUE ALSO OCCURS ON EARLIER DATES.
BLANK ENTRIES DENOTE MISSING OR UNREPORTED DATA.
NORMALS ARE 30–YEAR AVERAGES (1961–1990).
ASOS INDICATES AUTOMATED SURFACE OBSERVING SYSTEM.
PM INDICATES THE LAST DAY OF THE PREVIOUS MONTH.
POR (PERIOD OF RECORD) BEGINS WITH THE JANUARY DATA MONTH AND IS THE NUMBER OF YEARS USED TO COMPUTE THE MEAN. INDIVIDUAL MONTHS WITHIN THE POR MAY BE MISSING.
WHEN THE POR FOR A NORMAL IS LESS THAN 30 YEARS, THE NORMAL IS PROVISIONAL AND IS BASED ON THE NUMBER OF YEARS INDICATED.
0.* OR * INDICATES THE VALUE OR MEAN–DAYS–WITH IS BETWEEN 0.00 AND 0.05.
CLOUDINESS FOR ASOS STATIONS DIFFERS FROM THE NON–ASOS OBSERVATION TAKEN BY A HUMAN OBSERVER. ASOS STATION CLOUDINESS IS BASED ON TIME–AVERAGED CEILOMETER DATA FOR CLOUDS AT OR BELOW 12,000 FEET AND ON SATELLITE DATA FOR CLOUDS ABOVE 12,000 FEET.
THE NUMBER OF DAYS WITH CLEAR, PARTLY CLOUDY, AND CLOUDY CONDITIONS FOR ASOS STATIONS IS THE SUM OF THE CEILOMETER AND SATELLITE DATA FOR THE SUNRISE TO SUNSET PERIOD.
GENERAL CONTINUED:
CLEAR INDICATES 0–2 OKTAS, PARTLY CLOUDY INDICATES 3–6 OKTAS, AND CLOUDY INDICATES 7 OR 8 OKTAS. WHEN AT LEAST ONE OF THE ELEMENTS (CEILOMETER OR SATELLITE) IS MISSING, THE DAILY CLOUDINESS IS NOT COMPUTED.
WIND DIRECTION IS RECORDED IN TENS OF DEGREES (2 DIGITS) CLOCKWISE FROM TRUE NORTH. "00" INDICATES CALM. "36" INDICATES TRUE NORTH.
RESULTANT WIND IS THE VECTOR AVERAGE OF THE SPEED AND DIRECTION.
AVERAGE TEMPERATURE IS THE SUM OF THE MEAN DAILY MAXIMUM AND MINIMUM TEMPERATURE DIVIDED BY 2.
SNOWFALL DATA COMPRISE ALL FORMS OF FROZEN PRECIPITATION, INCLUDING HAIL.
A HEATING (COOLING) DEGREE DAY IS THE DIFFERENCE BETWEEN THE AVERAGE DAILY TEMPERATURE AND 65 F.
DRY BULB IS THE TEMPERATURE OF THE AMBIENT AIR.
DEW POINT IS THE TEMPERATURE TO WHICH THE AIR MUST BE COOLED TO ACHIEVE 100 PERCENT RELATIVE HUMIDITY.
WET BULB IS THE TEMPERATURE THE AIR WOULD HAVE IF THE MOISTURE CONTENT WAS INCREASED TO 100 PERCENT RELATIVE HUMIDITY.
ON JULY 1, 1996, THE NATIONAL WEATHER SERVICE BEGAN USING THE "METAR" OBSERVATION CODE THAT WAS ALREADY EMPLOYED BY MOST OTHER NATIONS OF THE WORLD. THE MOST NOTICEABLE DIFFERENCE IN THIS ANNUAL PUBLICATION WILL BE THE CHANGE IN UNITS FROM TENTHS TO EIGHTS (OKTAS) FOR REPORTING THE AMOUNT OF SKY COVER.
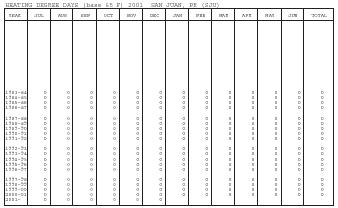
| HEATING DEGREE DAYS (base 65 F) 2001 SAN JUAN, PR (SJU) | |||||||||||||
| 1983-84 | 0 | 0 | 0 | 0 | 0 | 0 | 0 | 0 | 0 | 0 | 0 | 0 | 0 |
| 1984-85 | 0 | 0 | 0 | 0 | 0 | 0 | 0 | 0 | 0 | 0 | 0 | 0 | 0 |
| 1985-86 | 0 | 0 | 0 | 0 | 0 | 0 | 0 | 0 | 0 | 0 | 0 | 0 | 0 |
| 1986-87 | 0 | 0 | 0 | 0 | 0 | 0 | 0 | 0 | 0 | 0 | 0 | 0 | 0 |
| 1987-88 | 0 | 0 | 0 | 0 | 0 | 0 | 0 | 0 | 0 | 0 | 0 | 0 | 0 |
| 1988-89 | 0 | 0 | 0 | 0 | 0 | 0 | 0 | 0 | 0 | 0 | 0 | 0 | 0 |
| 1989-90 | 0 | 0 | 0 | 0 | 0 | 0 | 0 | 0 | 0 | 0 | 0 | 0 | 0 |
| 1990-91 | 0 | 0 | 0 | 0 | 0 | 0 | 0 | 0 | 0 | 0 | 0 | 0 | 0 |
| 1991-92 | 0 | 0 | 0 | 0 | 0 | 0 | 0 | 0 | 0 | 0 | 0 | 0 | 0 |
| 1992-93 | 0 | 0 | 0 | 0 | 0 | 0 | 0 | 0 | 0 | 0 | 0 | 0 | 0 |
| 1993-94 | 0 | 0 | 0 | 0 | 0 | 0 | 0 | 0 | 0 | 0 | 0 | 0 | 0 |
| 1994-95 | 0 | 0 | 0 | 0 | 0 | 0 | 0 | 0 | 0 | 0 | 0 | 0 | 0 |
| 1995-96 | 0 | 0 | 0 | 0 | 0 | 0 | 0 | 0 | 0 | 0 | 0 | 0 | 0 |
| 1996-97 | 0 | 0 | 0 | 0 | 0 | 0 | 0 | 0 | 0 | 0 | 0 | 0 | 0 |
| 1997-98 | 0 | 0 | 0 | 0 | 0 | 0 | 0 | 0 | 0 | 0 | 0 | 0 | 0 |
| 1998-99 | 0 | 0 | 0 | 0 | 0 | 0 | 0 | 0 | 0 | 0 | 0 | 0 | 0 |
| 1999-00 | 0 | 0 | 0 | 0 | 0 | 0 | 0 | 0 | 0 | 0 | 0 | 0 | 0 |
| 2000-01 | 0 | 0 | 0 | 0 | 0 | 0 | 0 | 0 | 0 | 0 | 0 | 0 | 0 |
| 2001- | 0 | 0 | 0 | 0 | 0 | 0 | |||||||
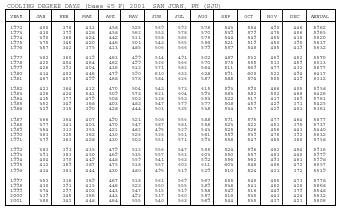
| COOLING DEGREE DAYS (base 65 F) 2001 SAN JUAN, PR (SJU) | |||||||||||||
| YEAR | JAN | FEB | MAR | APR | MAY | JUN | JUL | AUG | SEP | OCT | NOV | DEC | ANNUAL |
| 1972 | 400 | 376 | 431 | 458 | 525 | 569 | 592 | 578 | 543 | 554 | 490 | 446 | 5962 |
| 1973 | 438 | 379 | 428 | 458 | 562 | 553 | 578 | 570 | 539 | 579 | 475 | 406 | 5965 |
| 1974 | 390 | 368 | 424 | 442 | 511 | 558 | 586 | 575 | 544 | 549 | 455 | 418 | 5820 |
| 1975 | 375 | 346 | 420 | 446 | 501 | 543 | 565 | 556 | 521 | 519 | 450 | 395 | 5637 |
| 1976 | 357 | 342 | 375 | 413 | 485 | 506 | 566 | 579 | 557 | 548 | 485 | 419 | 5632 |
| 1977 | 382 | 360 | 419 | 463 | 499 | 514 | 491 | 502 | 487 | 532 | 469 | 452 | 5570 |
| 1978 | 420 | 404 | 464 | 462 | 499 | 526 | 566 | 570 | 575 | 555 | 513 | 459 | 6013 |
| 1979 | 426 | 393 | 404 | 436 | 512 | 571 | 582 | 564 | 511 | 569 | 477 | 432 | 5877 |
| 1980 | 414 | 402 | 446 | 479 | 590 | 610 | 633 | 628 | 591 | 608 | 522 | 494 | 6417 |
| 1981 | 467 | 407 | 499 | 468 | 578 | 584 | 626 | 587 | 588 | 574 | 505 | 429 | 6312 |
| 1982 | 423 | 364 | 412 | 470 | 504 | 543 | 573 | 615 | 593 | 590 | 466 | 405 | 5958 |
| 1983 | 426 | 424 | 541 | 509 | 573 | 621 | 604 | 593 | 583 | 582 | 502 | 468 | 6426 |
| 1984 | 415 | 377 | 479 | 508 | 503 | 528 | 553 | 553 | 522 | 517 | 417 | 389 | 5761 |
| 1985 | 352 | 349 | 368 | 403 | 483 | 547 | 579 | 577 | 508 | 459 | 429 | 371 | 5425 |
| 1986 | 329 | 315 | 390 | 428 | 444 | 501 | 535 | 538 | 534 | 517 | 429 | 401 | 5361 |
| 1987 | 366 | 354 | 407 | 490 | 521 | 508 | 556 | 588 | 571 | 575 | 477 | 464 | 5877 |
| 1988 | 377 | 341 | 403 | 470 | 547 | 587 | 581 | 558 | 523 | 522 | 453 | 375 | 5737 |
| 1989 | 354 | 313 | 353 | 421 | 482 | 495 | 529 | 543 | 525 | 526 | 456 | 443 | 5440 |
| 1990 | 383 | 325 | 362 | 430 | 526 | 526 | 551 | 561 | 559 | 539 | 478 | 392 | 5632 |
| 1991 | 379 | 363 | 428 | 430 | 503 | 551 | 571 | 593 | 558 | 547 | 455 | 380 | 5758 |
| 1992 | 383 | 393 | 435 | 479 | 512 | 556 | 547 | 555 | 524 | 596 | 482 | 454 | 5916 |
| 1993 | 391 | 383 | 450 | 469 | 535 | 557 | 561 | 603 | 550 | 557 | 483 | 440 | 5979 |
| 1994 | 404 | 370 | 449 | 448 | 559 | 541 | 563 | 592 | 556 | 562 | 493 | 461 | 5998 |
| 1995 | 412 | 389 | 387 | 475 | 518 | 557 | 602 | 611 | 603 | 545 | 486 | 472 | 6057 |
| 1996 | 414 | 381 | 444 | 430 | 480 | 495 | 519 | 529 | 510 | 524 | 421 | 372 | 5519 |
| 1997 | 353 | 316 | 369 | 467 | 518 | 561 | 569 | 567 | 555 | 545 | 485 | 473 | 5778 |
| 1998 | 430 | 391 | 415 | 446 | 523 | 550 | 555 | 589 | 538 | 541 | 462 | 428 | 5868 |
| 1999 | 374 | 297 | 402 | 443 | 547 | 515 | 519 | 558 | 549 | 516 | 449 | 379 | 5548 |
| 2000 | 339 | 345 | 366 | 443 | 492 | 517 | 560 | 557 | 516 | 530 | 443 | 424 | 5532 |
| 2001 | 388 | 342 | 448 | 464 | 555 | 540 | 563 | 569 | 544 | 535 | 437 | 421 | 5806 |
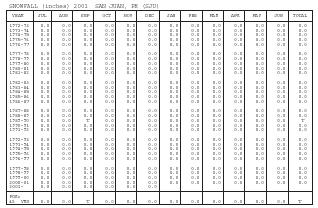
| SNOWFALL (inches) 2001 SAN JUAN, PR (SJU) | |||||||||||||
| YEAR | JUL | AUG | SEP | OCT | NOV | DEC | JAN | FEB | MAR | APR | MAY | JUN | TOTAL |
| 1972-73 | 0.0 | 0.0 | 0.0 | 0.0 | 0.0 | 0.0 | 0.0 | 0.0 | 0.0 | 0.0 | 0.0 | 0.0 | 0.0 |
| 1973-74 | 0.0 | 0.0 | 0.0 | 0.0 | 0.0 | 0.0 | 0.0 | 0.0 | 0.0 | 0.0 | 0.0 | 0.0 | 0.0 |
| 1974-75 | 0.0 | 0.0 | 0.0 | 0.0 | 0.0 | 0.0 | 0.0 | 0.0 | 0.0 | 0.0 | 0.0 | 0.0 | 0.0 |
| 1975-76 | 0.0 | 0.0 | 0.0 | 0.0 | 0.0 | 0.0 | 0.0 | 0.0 | 0.0 | 0.0 | 0.0 | 0.0 | 0.0 |
| 1976-77 | 0.0 | 0.0 | 0.0 | 0.0 | 0.0 | 0.0 | 0.0 | 0.0 | 0.0 | 0.0 | 0.0 | 0.0 | 0.0 |
| 1977-78 | 0.0 | 0.0 | 0.0 | 0.0 | 0.0 | 0.0 | 0.0 | 0.0 | 0.0 | 0.0 | 0.0 | 0.0 | 0.0 |
| 1978-79 | 0.0 | 0.0 | 0.0 | 0.0 | 0.0 | 0.0 | 0.0 | 0.0 | 0.0 | 0.0 | 0.0 | 0.0 | 0.0 |
| 1979-80 | 0.0 | 0.0 | 0.0 | 0.0 | 0.0 | 0.0 | 0.0 | 0.0 | 0.0 | 0.0 | 0.0 | 0.0 | 0.0 |
| 1980-81 | 0.0 | 0.0 | 0.0 | 0.0 | 0.0 | 0.0 | 0.0 | 0.0 | 0.0 | 0.0 | 0.0 | 0.0 | 0.0 |
| 1981-82 | 0.0 | 0.0 | 0.0 | 0.0 | 0.0 | 0.0 | 0.0 | 0.0 | 0.0 | 0.0 | 0.0 | 0.0 | 0.0 |
| 1982-83 | 0.0 | 0.0 | 0.0 | 0.0 | 0.0 | 0.0 | 0.0 | 0.0 | 0.0 | 0.0 | 0.0 | 0.0 | 0.0 |
| 1983-84 | 0.0 | 0.0 | 0.0 | 0.0 | 0.0 | 0.0 | 0.0 | 0.0 | 0.0 | 0.0 | 0.0 | 0.0 | 0.0 |
| 1984-85 | 0.0 | 0.0 | 0.0 | 0.0 | 0.0 | 0.0 | 0.0 | 0.0 | 0.0 | 0.0 | 0.0 | 0.0 | 0.0 |
| 1985-86 | 0.0 | 0.0 | 0.0 | 0.0 | 0.0 | 0.0 | 0.0 | 0.0 | 0.0 | 0.0 | 0.0 | 0.0 | 0.0 |
| 1986-87 | 0.0 | 0.0 | 0.0 | 0.0 | 0.0 | 0.0 | 0.0 | 0.0 | 0.0 | 0.0 | 0.0 | 0.0 | 0.0 |
| 1987-88 | 0.0 | 0.0 | 0.0 | 0.0 | 0.0 | 0.0 | 0.0 | 0.0 | 0.0 | 0.0 | 0.0 | 0.0 | 0.0 |
| 1988-89 | 0.0 | 0.0 | 0.0 | 0.0 | 0.0 | 0.0 | 0.0 | 0.0 | 0.0 | 0.0 | 0.0 | 0.0 | 0.0 |
| 1989-90 | 0.0 | 0.0 | T | 0.0 | 0.0 | 0.0 | 0.0 | 0.0 | 0.0 | 0.0 | 0.0 | 0.0 | T |
| 1990-91 | 0.0 | 0.0 | 0.0 | 0.0 | 0.0 | 0.0 | 0.0 | 0.0 | 0.0 | 0.0 | 0.0 | 0.0 | 0.0 |
| 1991-92 | 0.0 | 0.0 | 0.0 | 0.0 | 0.0 | 0.0 | 0.0 | 0.0 | 0.0 | 0.0 | 0.0 | 0.0 | 0.0 |
| 1992-93 | 0.0 | 0.0 | 0.0 | 0.0 | 0.0 | 0.0 | 0.0 | 0.0 | 0.0 | 0.0 | 0.0 | 0.0 | 0.0 |
| 1993-94 | 0.0 | 0.0 | 0.0 | 0.0 | 0.0 | 0.0 | 0.0 | 0.0 | 0.0 | 0.0 | 0.0 | 0.0 | 0.0 |
| 1994-95 | 0.0 | 0.0 | 0.0 | 0.0 | 0.0 | 0.0 | 0.0 | 0.0 | 0.0 | 0.0 | 0.0 | 0.0 | 0.0 |
| 1995-96 | 0.0 | 0.0 | 0.0 | 0.0 | 0.0 | 0.0 | 0.0 | 0.0 | 0.0 | 0.0 | 0.0 | 0.0 | 0.0 |
| 1996-97 | 0.0 | 0.0 | 0.0 | 0.0 | 0.0 | 0.0 | 0.0 | 0.0 | 0.0 | 0.0 | 0.0 | 0.0 | 0.0 |
| 1997-98 | 0.0 | 0.0 | 0.0 | 0.0 | 0.0 | 0.0 | 0.0 | 0.0 | 0.0 | 0.0 | 0.0 | 0.0 | 0.0 |
| 1998-99 | 0.0 | 0.0 | 0.0 | 0.0 | 0.0 | 0.0 | 0.0 | 0.0 | 0.0 | 0.0 | 0.0 | 0.0 | 0.0 |
| 1999-00 | 0.0 | 0.0 | 0.0 | 0.0 | 0.0 | 0.0 | 0.0 | 0.0 | 0.0 | 0.0 | 0.0 | 0.0 | 0.0 |
| 2000-01 | 0.0 | 0.0 | 0.0 | 0.0 | 0.0 | 0.0 | 0.0 | 0.0 | 0.0 | 0.0 | 0.0 | 0.0 | 0.0 |
| 2001- | 0.0 | 0.0 | 0.0 | 0.0 | 0.0 | 0.0 | |||||||
| POR=45 YRS | 0.0 | 0.0 | T | 0.0 | 0.0 | 0.0 | 0.0 | 0.0 | 0.0 | 0.0 | 0.0 | 0.0 | T |
Comment about this article, ask questions, or add new information about this topic: