2001 RAPID CITY, SOUTH DAKOTA (RAP)
Rapid City, which is not far from the geographical center of North America, experiences the large temperature ranges, both daily and seasonal, that are typical of semi–arid continental climates.
The city is surrounded by contrasting landforms, with the forested Black Hills rising immediately west of the city, and rolling prairie extending out in the other directions. From 40 to 70 miles southeast lie the eroded Badlands. The Black Hills, many of which are more than 5,000 feet above sea level, with a number of peaks above 7,000 feet, exert a pronounced influence on the climate of this area. The rolling land to the east of the city is cut by the valleys of the Box Elder and Rapid Creeks, which flow generally east–southeastward. The station is located on the north slope of the irrigated Rapid Valley. An east–west ridge 200 to 300 feet higher than the airport separates the station from the Box Elder Creek Valley.
The principal agricultural products in the area are cattle and wheat, and ranchers and farmers are dependent on the current weather forecasts, which are at times of vital interest in the protection of livestock.
Although the annual precipitation is light at lower elevations, the distribution is beneficial to agriculture with the greatest amounts occurring during the growing season. The heaviest snows are expected in the spring, which helps to furnish moisture for the early maturing crops such as wheat, while heavy winter snows at the higher elevations provide irrigation water for the fertile valleys.
Summer days are normally warm with cool, comfortable nights. Nearly all of the summer precipitation occurs as thunderstorms. Hail is often associated with the more severe thunderstorms, with resultant damage to vegetation as well as other fragile material in the path of the storms. Autumn, which begins soon after the first of September, is characterized by mild, balmy days, and cool, invigorating mornings and evenings. Autumn weather usually extends into November and often into December.
Temperatures for the winter months of December, January, and February are among the warmest in South Dakota due to the protection of the Black Hills, the frequent occurrence of Chinook winds, and the fact that the winter tracks of arctic air masses usually pass east of Rapid City. Rapid City has become the retirement home for many farmers and ranchers from the western half of the state because of the cool summer nights and the relatively mild winters.
Snowfall is normally light with the greatest monthly average of about 8 inches occurring in March. Cold waves can be expected occasionally, and one or more blizzards may occur each winter.
Spring is characterized by unsettled conditions. Wide variations usually occur in temperatures, and snows may fall as late as May.
Based on the 1951–1980 period, the average first occurrence of 32 degrees Fahrenheit in the fall is September 29 and the average last occurrence in the spring is May 7.
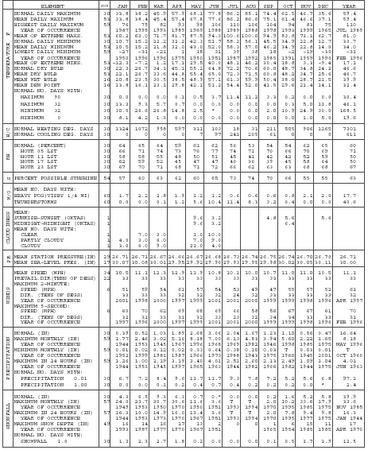
NORMALS, MEANS, AND EXTREMES
RAPID CITY, SD (RAP)
LATITUDE: LONGITUDE: ELEVATION (FT): TIME ZONE: WBAN: 24090
44 02′ 44″ N 103 03′ 14″ W GRND: 3150 BARO: &#x 0A0;3153 MOUNTAIN (UTC + 7)
| ELEMENT | POR | JAN | FEB | MAR | APR | MAY | JUN | JUL | AUG | SEP | OCT | NOV | DEC | YEAR | |
| TEMPERATURE F | NORMAL DAILY MAXIMUM | 30 | 33.8 | 38.2 | 45.9 | 57.9 | 68.1 | 77.8 | 86.2 | 85.1 | 74.4 | 62.5 | 46.7 | 35.6 | 59.4 |
| MEAN DAILY MAXIMUM | 53 | 33.8 | 38.4 | 45.4 | 57.4 | 67.8 | 77.6 | 86.2 | 86.0 | 75.1 | 61.4 | 46.6 | 37.1 | 59.4 | |
| HIGHEST DAILY MAXIMUM | 59 | 76 | 75 | 82 | 93 | 98 | 106 | 110 | 106 | 104 | 94 | 83 | 75 | 110 | |
| YEAR OF OCCURRENCE | 1987 | 1995 | 1993 | 1989 | 1969 | 1988 | 1989 | 1988 | 1978 | 1993 | 1999 | 1965 | JUL 1989 | ||
| MEAN OF EXTREME MAXS. | 53 | 60.2 | 63.0 | 71.7 | 81.7 | 87.5 | 94.3 | 100.6 | 100.0 | 94.9 | 83.8 | 71.1 | 62.7 | 81.0 | |
| NORMAL DAILY MINIMUM | 30 | 10.7 | 15.2 | 22.2 | 32.2 | 42.3 | 51.7 | 58.2 | 56.1 | 45.5 | 34.9 | 22.8 | 12.7 | 33.7 | |
| MEAN DAILY MINIMUM | 53 | 10.5 | 15.2 | 21.8 | 32.0 | 43.0 | 52.0 | 58.3 | 57.0 | 46.2 | 34.9 | 22.8 | 14.0 | 34.0 | |
| LOWEST DAILY MINIMUM | 59 | -27 | -31 | -21 | 1 | 18 | 31 | 39 | 38 | 18 | -2 | -19 | -30 | -31 | |
| YEAR OF OCCURRENCE | 1950 | 1996 | 1996 | 1975 | 1950 | 1951 | 1987 | 1992 | 1985 | 1991 | 1959 | 1990 | FEB 1996 | ||
| MEAN OF EXTREME MINS. | 53 | -12.3 | -7.2 | 1.2 | 17.1 | 29.5 | 40.0 | 48.1 | 46.2 | 30.4 | 18.8 | 3.3 | -9.4 | 17.1 | |
| NORMAL DRY BULB | 30 | 22.3 | 26.7 | 34.1 | 45.1 | 55.2 | 64.8 | 72.2 | 70.6 | 60.0 | 48.7 | 34.8 | 24.2 | 46.6 | |
| MEAN DRY BULB | 53 | 22.1 | 26.7 | 33.6 | 44.8 | 55.4 | 65.0 | 72.3 | 71.5 | 60.8 | 48.2 | 34.7 | 25.6 | 46.7 | |
| MEAN WET BULB | 16 | 20.8 | 23.5 | 30.5 | 38.5 | 48.9 | 57.1 | 61.3 | 59.9 | 50.4 | 38.0 | 28.7 | 21.5 | 39.9 | |
| MEAN DEW POINT | 16 | 13.8 | 16.1 | 23.1 | 29.8 | 42.1 | 51.2 | 54.4 | 52.0 | 41.5 | 29.6 | 21.4 | 14.1 | 32.4 | |
| NORMAL NO. DAYS WITH: | |||||||||||||||
| MAXIMUM 90 | 30 | 0.0 | 0.0 | 0.0 | 0.1 | 0.5 | 3.7 | 11.4 | 11.2 | 3.3 | 0.2 | 0.0 | 0.0 | 30.4 | |
| MAXIMUM 32 | 30 | 13.3 | 9.3 | 5.7 | 0.7 | 0.0 | 0.0 | 0.0 | 0.0 | 0.0 | 0.3 | 5.0 | 11.8 | 46.1 | |
| MINIMUM 32 | 30 | 30.0 | 26.6 | 26.8 | 14.8 | 2.5 | * | 0.0 | 0.0 | 2.0 | 10.9 | 24.9 | 30.0 | 168.5 | |
| MINIMUM 0 | 30 | 8.1 | 4.2 | 1.3 | 0.0 | 0.0 | 0.0 | 0.0 | 0.0 | 0.0 | 0.0 | 1.0 | 5.0 | 19.6 | |
| H/C | NORMAL HEATING DEG. DAYS | 30 | 1324 | 1072 | 958 | 597 | 311 | 103 | 18 | 31 | 211 | 505 | 906 | 1265 | 7301 |
| NORMAL COOLING DEG. DAYS | 30 | 0 | 0 | 0 | 0 | 7 | 97 | 241 | 205 | 61 | 0 | 0 | 0 | 611 | |
| RH | NORMAL (PERCENT) | 30 | 64 | 65 | 64 | 59 | 61 | 62 | 56 | 53 | 54 | 54 | 62 | 65 | 60 |
| HOUR 05 LST | 30 | 66 | 71 | 74 | 73 | 76 | 77 | 74 | 71 | 70 | 66 | 70 | 69 | 71 | |
| HOUR 11 LST | 30 | 58 | 58 | 55 | 48 | 50 | 51 | 45 | 41 | 42 | 42 | 52 | 59 | 50 | |
| HOUR 17 LST | 30 | 62 | 59 | 52 | 45 | 47 | 47 | 40 | 36 | 39 | 45 | 58 | 64 | 50 | |
| HOUR 23 LST | 30 | 67 | 70 | 71 | 68 | 71 | 72 | 66 | 62 | 63 | 63 | 68 | 68 | 67 | |
| S | PERCENT POSSIBLE SUNSHINE | 54 | 57 | 60 | 63 | 62 | 60 | 65 | 73 | 74 | 70 | 66 | 55 | 55 | 63 |
| W/O | MEAN NO. DAYS WITH: | ||||||||||||||
| HEAVY FOG (VISBY 1/4 MI) | 60 | 1.7 | 2.2 | 2.8 | 1.9 | 1.2 | 1.2 | 0.6 | 0.6 | 0.6 | 0.8 | 2.1 | 2.0 | 17.7 | |
| THUNDERSTORMS | 60 | 0.0 | 0.0 | 0.1 | 1.2 | 5.6 | 10.4 | 11.4 | 8.3 | 3.2 | 0.4 | 0.0 | 0.0 | 40.6 | |
| CLOUDINESS | MEAN: | ||||||||||||||
| SUNRISE-SUNSET (OKTAS) | 1 | 9.6 | 3.2 | 4.8 | 5.6 | 5.6 | |||||||||
| MIDNIGHT-MIDNIGHT (OKTAS) | 1 | 9.6 | 3.2 | 6.4 | |||||||||||
| MEAN NO. DAYS WITH: | |||||||||||||||
| CLEAR | 1 | 7.0 | 3.0 | 1.0 | 10.0 | ||||||||||
| PARTLY CLOUDY | 1 | 4.0 | 3.0 | 6.0 | 7.0 | 9.0 | |||||||||
| CLOUDY | 1 | 3.0 | 6.0 | 9.0 | 21.0 | 4.0 | |||||||||
| PR | MEAN STATION PRESSURE(IN) | 29 | 26.71 | 26.71 | 26.67 | 26.66 | 26.67 | 26.68 | 26.73 | 26.74 | 26.75 | 26.74 | 26.70 | 26.70 | 26.71 |
| MEAN SEA-LEVEL PRES. (IN) | 17 | 30.07 | 30.08 | 30.01 | 29.95 | 29.92 | 29.90 | 29.93 | 29.95 | 29.98 | 30.02 | 30.05 | 30.11 | 30.00 | |
| WINDS | MEAN SPEED (MPH) | 34 | 10.5 | 11.1 | 12.3 | 12.9 | 11.9 | 10.8 | 10.1 | 10.0 | 10.7 | 11.0 | 11.0 | 10.5 | 11.1 |
| PREVAIL. DIR (TENS OF DEGS) | 22 | 33 | 33 | 33 | 33 | 33 | 33 | 33 | 33 | 33 | 33 | 33 | 33 | 33 | |
| MAXIMUM 2-MINUTE: | |||||||||||||||
| SPEED (MPH) | 6 | 51 | 59 | 54 | 61 | 57 | 54 | 53 | 49 | 47 | 55 | 57 | 52 | 61 | |
| DIR. (TENS OF DEGS) | 33 | 33 | 33 | 32 | 32 | 32 | 24 | 32 | 33 | 33 | 33 | 33 | 32 | ||
| YEAR OF OCCURRENCE | 2001 | 1998 | 2000 | 1997 | 1999 | 2001 | 2001 | 2000 | 1999 | 1999 | 1998 | 1996 | APR 1997 | ||
| MAXIMUM 5-SECOND: | |||||||||||||||
| SPEED (MPH) | 6 | 60 | 70 | 62 | 69 | 68 | 69 | 66 | 58 | 56 | 67 | 67 | 61 | 70 | |
| DIR. (TENS OF DEGS) | 32 | 31 | 33 | 31 | 32 | 33 | 23 | 32 | 34 | 34 | 33 | 33 | 31 | ||
| YEAR OF OCCURRENCE | 1997 | 1996 | 2000 | 1997 | 1999 | 2001 | 2001 | 2000 | 1999 | 1999 | 1998 | 1996 | FEB 1996 | ||
| PRECIPITATION | NORMAL (IN) | 30 | 0.39 | 0.52 | 1.03 | 1.89 | 2.68 | 3.06 | 2.04 | 1.67 | 1.23 | 1.10 | 0.56 | 0.47 | 16.64 |
| MAXIMUM MONTHLY (IN) | 59 | 1.77 | 2.46 | 3.02 | 5.16 | 8.18 | 7.00 | 6.13 | 4.83 | 3.94 | 5.60 | 2.22 | 1.65 | 8.18 | |
| YEAR OF OCCURRENCE | 1944 | 1953 | 1945 | 1967 | 1996 | 1968 | 1969 | 1982 | 1946 | 1998 | 1985 | 1975 | MAY 1996 | ||
| MINIMUM MONTHLY (IN) | 59 | 0.01 | 0.02 | 0.12 | 0.02 | 0.33 | 0.64 | 0.38 | 0.10 | 0.03 | T | 0.03 | 0.01 | T | |
| YEAR OF OCCURRENCE | 1952 | 1999 | 1981 | 1987 | 1966 | 1973 | 1988 | 1943 | 1975 | 1960 | 1945 | 2001 | OCT 1960 | ||
| MAXIMUM IN 24 HOURS (IN) | 59 | 1.26 | 1.00 | 2.19 | 3.19 | 3.40 | 4.01 | 2.51 | 2.60 | 2.13 | 2.49 | 1.09 | 1.04 | 4.01 | |
| YEAR OF OCCURRENCE | 1944 | 1953 | 1945 | 1997 | 1965 | 1963 | 1944 | 1982 | 1966 | 1982 | 1944 | 1975 | JUN 1963 | ||
| NORMAL NO. DAYS WITH: | |||||||||||||||
| PRECIPITATION 0.01 | 30 | 6.7 | 7.2 | 8.4 | 9.6 | 11.7 | 11.7 | 9.3 | 7.8 | 7.2 | 5.2 | 5.6 | 6.8 | 97.2 | |
| PRECIPITATION 1.00 | 30 | 0.0 | 0.0 | 0.1 | 0.2 | 0.4 | 0.7 | 0.4 | 0.2 | 0.2 | 0.2 | 0.0 | * | 2.4 | |
| SNOWFALL | NORMAL (IN) | 30 | 4.3 | 6.5 | 9.3 | 6.3 | 0.7 | 0.* | 0.0 | 0.0 | 0.2 | 1.6 | 5.2 | 5.8 | 39.9 |
| MAXIMUM MONTHLY (IN) | 57 | 24.0 | 23.7 | 30.7 | 30.6 | 11.6 | 3.6 | T | T | 2.0 | 10.2 | 33.6 | 17.9 | 33.6 | |
| YEAR OF OCCURRENCE | 1949 | 1953 | 1950 | 1970 | 1950 | 1951 | 1993 | 1994 | 1970 | 1995 | 1985 | 1975 | NOV 1985 | ||
| MAXIMUM IN 24 HOURS (IN) | 57 | 16.3 | 10.0 | 14.9 | 16.0 | 13.4 | 3.6 | T | T | 2.0 | 7.8 | 9.4 | 9.8 | 16.3 | |
| YEAR OF OCCURRENCE | 1944 | 1953 | 1973 | 1970 | 1967 | 1951 | 1993 | 1994 | 1970 | 1995 | 1977 | 1975 | JAN 1944 | ||
| MAXIMUM SNOW DEPTH (IN) | 49 | 16 | 14 | 16 | 17 | 13 | 2 | 0 | 0 | 1 | 6 | 15 | 11 | 17 | |
| YEAR OF OCCURRENCE | 1993 | 1987 | 1977 | 1970 | 1967 | 1951 | 1965 | 1954 | 1985 | 1985 | APR 1970 | ||||
| NORMAL NO. DAYS WITH: | |||||||||||||||
| SNOWFALL 1.0 | 30 | 1.3 | 2.3 | 2.7 | 1.8 | 0.2 | 0.0 | 0.0 | 0.0 | 0.1 | 0.5 | 1.7 | 1.9 | 12.5 |
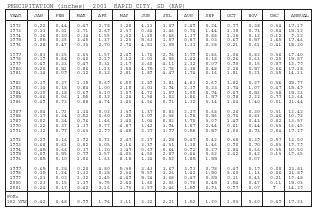
| PRECIPITATION (inches) 2001 RAPID CITY, SD (RAP) | |||||||||||||
| YEAR | JAN | FEB | MAR | APR | MAY | JUN | JUL | AUG | SEP | OCT | NOV | DEC | ANNUAL |
| 1972 | 0.22 | 0.44 | 0.47 | 2.78 | 3.28 | 4.11 | 1.67 | 2.49 | 0.24 | 0.77 | 0.38 | 0.34 | 17.19 |
| 1973 | 0.11 | 0.31 | 2.71 | 2.69 | 2.37 | 0.64 | 1.46 | 0.74 | 1.44 | 1.38 | 0.73 | 0.54 | 15.12 |
| 1974 | 0.16 | 0.30 | 0.34 | 1.55 | 1.32 | 1.10 | 0.68 | 1.37 | 0.88 | 1.18 | 0.12 | 0.12 | 9.12 |
| 1975 | 1.05 | 0.35 | 2.45 | 1.37 | 1.23 | 5.63 | 1.57 | 0.87 | 0.03 | 0.69 | 0.57 | 1.65 | 17.46 |
| 1976 | 0.28 | 0.47 | 0.33 | 2.70 | 2.74 | 4.81 | 1.05 | 1.31 | 0.28 | 0.21 | 0.61 | 0.41 | 15.20 |
| 1977 | 0.83 | 0.25 | 2.63 | 1.57 | 2.49 | 1.76 | 2.98 | 1.79 | 2.86 | 1.06 | 0.82 | 0.36 | 19.40 |
| 1978 | 0.19 | 0.84 | 0.40 | 2.19 | 3.12 | 2.01 | 4.08 | 1.42 | 0.18 | 0.26 | 0.63 | 0.25 | 15.57 |
| 1979 | 0.49 | 0.33 | 0.47 | 0.31 | 1.17 | 3.60 | 4.11 | 2.32 | 0.07 | 0.90 | 0.15 | 0.07 | 13.99 |
| 1980 | 0.20 | 0.51 | 0.86 | 1.13 | 1.58 | 4.75 | 1.78 | 2.38 | 0.48 | 2.28 | 0.57 | 0.66 | 17.18 |
| 1981 | 0.14 | 0.09 | 0.12 | 0.32 | 2.81 | 1.89 | 4.47 | 1.74 | 0.16 | 1.81 | 0.23 | 0.35 | 14.13 |
| 1982 | 0.39 | 0.37 | 1.35 | 0.69 | 6.50 | 2.89 | 1.81 | 4.83 | 2.69 | 3.82 | 0.27 | 0.36 | 25.97 |
| 1983 | 0.34 | 0.18 | 0.84 | 1.00 | 2.18 | 3.01 | 1.94 | 2.39 | 0.33 | 1.74 | 1.07 | 0.47 | 15.49 |
| 1984 | 0.10 | 0.18 | 0.69 | 3.10 | 1.57 | 4.72 | 1.57 | 1.00 | 0.74 | 0.67 | 0.51 | 0.38 | 15.23 |
| 1985 | 0.46 | 0.06 | 1.55 | 0.32 | 1.24 | 1.58 | 1.03 | 1.86 | 1.57 | 0.98 | 2.22 | 0.77 | 13.64 |
| 1986 | 0.49 | 0.92 | 0.88 | 4.74 | 1.43 | 4.56 | 0.91 | 1.32 | 3.14 | 1.64 | 1.40 | 0.01 | 21.44 |
| 1987 | 0.04 | 1.71 | 1.14 | 0.02 | 3.39 | 1.37 | 0.83 | 2.37 | 0.68 | 0.26 | 0.30 | 0.31 | 12.42 |
| 1988 | 0.17 | 0.34 | 0.52 | 0.60 | 3.25 | 1.09 | 0.38 | 1.98 | 0.56 | 0.76 | 0.81 | 0.46 | 10.92 |
| 1989 | 0.02 | 0.34 | 0.96 | 1.46 | 1.40 | 1.04 | 0.82 | 1.70 | 3.09 | 1.49 | 0.43 | 0.82 | 13.57 |
| 1990 | 0.22 | 0.37 | 1.17 | 0.77 | 4.87 | 1.42 | 1.94 | 1.87 | 2.44 | 0.61 | 0.44 | 0.33 | 16.45 |
| 1991 | 0.32 | 0.77 | 0.63 | 2.99 | 4.40 | 3.27 | 1.97 | 0.58 | 0.59 | 1.00 | 0.73 | 0.04 | 17.29 |
| 1992 | 0.29 | 0.16 | 1.92 | 0.71 | 2.47 | 2.17 | 3.25 | 0.47 | 0.42 | 0.68 | 0.39 | 0.57 | 13.50 |
| 1993 | 0.68 | 0.61 | 0.82 | 3.05 | 2.16 | 3.39 | 4.31 | 1.18 | 1.46 | 0.90 | 0.70 | 0.53 | 19.79 |
| 1994 | 0.45 | 0.66 | 0.37 | 1.20 | 1.47 | 0.67 | 0.64 | 0.92 | 0.27 | 2.84 | 0.66 | 0.35 | 10.50 |
| 1995 | 0.09 | 0.55 | 0.79 | 2.57 | 4.03 | 4.50 | 2.87 | 0.46 | 0.82 | 2.42 | 0.42 | 0.13 | 19.65 |
| 1996 | 0.85 | 0.10 | 1.06 | 1.63 | 8.18 | 1.24 | 0.52 | 1.85 | 1.55 | 0.07 | |||
| 1997 | 0.65 | 0.28 | 0.20 | 4.80 | 5.35 | 3.43 | 3.67 | 3.93 | 0.78 | 0.47 | 0.19 | 0.08 | 23.83 |
| 1998 | 0.15 | 1.24 | 1.32 | 0.28 | 2.34 | 5.59 | 1.26 | 1.42 | 1.50 | 5.60 | 1.13 | 0.06 | 21.89 |
| 1999 | 0.21 | 0.02 | 1.32 | 2.45 | 4.49 | 5.24 | 3.68 | 0.47 | 0.85 | 0.11 | 0.43 | 0.21 | 19.48 |
| 2000 | 0.23 | 0.15 | 1.37 | 3.95 | 2.40 | 1.60 | 2.06 | 0.70 | 0.45 | 1.54 | 0.47 | 0.11 | 15.03 |
| 2001 | 0.24 | 0.17 | 0.42 | 2.16 | 1.73 | 3.57 | 2.46 | 1.59 | 0.91 | 0.97 | 0.07 | T | 14.29 |
| POR=102 YRS | 0.42 | 0.48 | 0.99 | 1.96 | 3.11 | 3.22 | 2.21 | 1.52 | 1.20 | 1.03 | 0.60 | 0.49 | 17.23 |
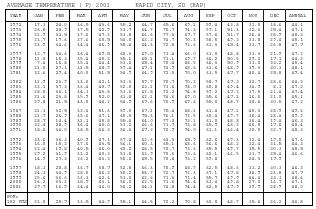
| AVERAGE TEMPERATURE (F) 2001 RAPID CITY, SD (RAP) | |||||||||||||
| YEAR | JAN | FEB | MAR | APR | MAY | JUN | JUL | AUG | SEP | OCT | NOV | DEC | ANNUAL |
| 1972 | 17.3 | 24.0 | 36.5 | 43.6 | 55.2 | 64.7 | 65.6 | 69.1 | 59.4 | 43.8 | 31.0 | 18.6 | 44.1 |
| 1973 | 26.8 | 28.9 | 37.5 | 42.9 | 53.7 | 64.7 | 70.7 | 74.3 | 57.1 | 51.3 | 32.3 | 25.4 | 47.1 |
| 1974 | 21.9 | 32.5 | 37.6 | 47.2 | 53.8 | 66.6 | 77.3 | 67.7 | 57.6 | 51.7 | 36.4 | 28.9 | 48.3 |
| 1975 | 23.7 | 17.6 | 27.6 | 40.5 | 54.0 | 62.2 | 74.7 | 70.3 | 58.5 | 49.2 | 33.8 | 29.4 | 45.1 |
| 1976 | 23.9 | 34.6 | 34.4 | 46.9 | 55.4 | 64.3 | 72.8 | 72.6 | 63.3 | 45.4 | 31.7 | 26.8 | 47.7 |
| 1977 | 12.7 | 34.6 | 36.4 | 49.5 | 60.3 | 69.0 | 73.4 | 66.0 | 61.0 | 48.8 | 33.3 | 21.9 | 47.2 |
| 1978 | 11.0 | 15.3 | 35.4 | 45.2 | 55.1 | 65.1 | 71.1 | 69.7 | 66.2 | 50.5 | 29.2 | 17.1 | 44.2 |
| 1979 | 7.4 | 16.8 | 35.4 | 44.4 | 53.6 | 65.4 | 70.4 | 68.5 | 66.3 | 50.9 | 33.0 | 33.2 | 45.4 |
| 1980 | 21.0 | 27.1 | 31.5 | 48.9 | 57.4 | 67.1 | 74.9 | 68.6 | 61.6 | 48.9 | 39.3 | 30.3 | 48.1 |
| 1981 | 32.6 | 29.4 | 40.0 | 51.5 | 54.9 | 64.9 | 72.0 | 70.0 | 63.5 | 47.7 | 40.4 | 25.8 | 49.4 |
| 1982 | 11.9 | 23.9 | 33.0 | 42.1 | 53.3 | 59.7 | 70.7 | 70.2 | 58.7 | 47.2 | 32.7 | 28.6 | 44.3 |
| 1983 | 32.1 | 37.3 | 36.4 | 40.7 | 52.0 | 63.1 | 73.6 | 78.0 | 60.8 | 49.4 | 34.9 | 8.1 | 47.2 |
| 1984 | 28.0 | 36.1 | 34.3 | 43.8 | 53.6 | 62.8 | 72.2 | 74.8 | 57.2 | 47.2 | 37.5 | 21.4 | 47.4 |
| 1985 | 21.6 | 23.8 | 35.9 | 52.0 | 61.8 | 62.1 | 74.6 | 69.0 | 55.6 | 47.3 | 16.0 | 21.0 | 45.1 |
| 1986 | 29.8 | 21.5 | 43.0 | 44.2 | 54.9 | 67.6 | 70.9 | 69.6 | 55.0 | 48.7 | 30.6 | 30.5 | 47.2 |
| 1987 | 31.1 | 32.5 | 32.6 | 51.6 | 59.5 | 67.1 | 75.4 | 68.1 | 61.4 | 47.1 | 40.3 | 28.9 | 49.6 |
| 1988 | 21.7 | 26.9 | 35.6 | 47.1 | 60.0 | 75.6 | 76.1 | 72.5 | 60.4 | 49.7 | 36.4 | 28.4 | 49.2 |
| 1989 | 28.7 | 14.4 | 31.1 | 45.8 | 55.4 | 64.0 | 77.0 | 73.1 | 61.0 | 48.8 | 36.4 | 19.4 | 46.3 |
| 1990 | 32.4 | 28.9 | 36.4 | 45.0 | 53.2 | 66.6 | 71.7 | 73.8 | 65.9 | 48.2 | 40.5 | 17.8 | 48.4 |
| 1991 | 18.4 | 36.0 | 38.5 | 46.3 | 56.6 | 67.2 | 72.9 | 74.0 | 61.1 | 46.4 | 30.0 | 32.7 | 48.3 |
| 1992 | 33.6 | 36.3 | 40.9 | 47.1 | 57.4 | 62.6 | 64.3 | 65.9 | 62.6 | 49.3 | 32.4 | 19.0 | 47.6 |
| 1993 | 16.0 | 15.2 | 37.6 | 43.5 | 56.1 | 60.3 | 65.1 | 68.6 | 56.6 | 48.2 | 32.4 | 31.5 | 44.3 |
| 1994 | 22.4 | 19.8 | 40.5 | 46.0 | 60.2 | 68.5 | 70.7 | 73.3 | 65.5 | 49.7 | 35.5 | 30.3 | 48.5 |
| 1995 | 29.2 | 31.9 | 33.2 | 40.3 | 51.8 | 62.9 | 70.6 | 73.6 | 60.1 | 46.5 | 33.7 | 25.4 | 46.6 |
| 1996 | 14.9 | 27.3 | 26.2 | 43.3 | 50.6 | 65.5 | 70.8 | 73.2 | 59.8 | 24.3 | 17.9 | ||
| 1997 | 18.1 | 28.8 | 36.7 | 38.7 | 52.8 | 66.3 | 70.9 | 68.7 | 62.5 | 48.6 | 33.2 | 30.3 | 46.3 |
| 1998 | 24.3 | 34.9 | 28.0 | 46.2 | 56.2 | 58.7 | 72.7 | 72.3 | 67.1 | 47.8 | 36.9 | 26.8 | 47.7 |
| 1999 | 25.6 | 36.6 | 36.3 | 42.6 | 53.0 | 62.6 | 71.3 | 71.4 | 55.7 | 49.9 | 44.4 | 33.3 | 48.6 |
| 2000 | 26.2 | 33.2 | 38.7 | 43.1 | 56.0 | 62.5 | 73.6 | 74.4 | 63.4 | 49.8 | 27.0 | 16.7 | 47.1 |
| 2001 | 29.7 | 16.9 | 34.4 | 46.0 | 56.2 | 64.1 | 74.8 | 74.4 | 62.5 | 47.9 | 39.9 | 28.9 | 48.0 |
| POR=102 YRS | 23.0 | 25.7 | 33.5 | 44.9 | 55.1 | 64.5 | 72.2 | 70.8 | 60.8 | 48.7 | 35.6 | 26.2 | 46.8 |
REFERENCE NOTES:
PAGE 1:
THE TEMPERATURE GRAPH SHOWS NORMAL MAXIMUM AND NORMAL MINIMUM DAILY TEMPERATURES (SOLID CURVES) AND THE ACTUAL DAILY HIGH AND LOW TEMPERATURES (VERTICAL BARS).
PAGE 2 AND 3:
H/C INDICATES HEATING AND COOLING DEGREE DAYS.
RH INDICATES RELATIVE HUMIDITY
W/O INDICATES WEATHER AND OBSTRUCTIONS
S INDICATES SUNSHINE.
PR INDICATES PRESSURE.
CLOUDINESS ON PAGE 3 IS THE SUM OF THE CEILOMETER AND SATELLITE DATA NOT TO EXCEED EIGHT EIGHTHS (OKTAS).
GENERAL:
T INDICATES TRACE PRECIPITATION, AN AMOUNT GREATER THAN ZERO BUT LESS THAN THE LOWEST REPORTABLE VALUE.
+ INDICATES THE VALUE ALSO OCCURS ON EARLIER DATES.
BLANK ENTRIES DENOTE MISSING OR UNREPORTED DATA.
NORMALS ARE 30–YEAR AVERAGES (1961–1990).
ASOS INDICATES AUTOMATED SURFACE OBSERVING SYSTEM.
PM INDICATES THE LAST DAY OF THE PREVIOUS MONTH.
POR (PERIOD OF RECORD) BEGINS WITH THE JANUARY DATA MONTH AND IS THE NUMBER OF YEARS USED TO COMPUTE THE MEAN. INDIVIDUAL MONTHS WITHIN THE POR MAY BE MISSING.
WHEN THE POR FOR A NORMAL IS LESS THAN 30 YEARS, THE NORMAL IS PROVISIONAL AND IS BASED ON THE NUMBER OF YEARS INDICATED.
0.* OR * INDICATES THE VALUE OR MEAN–DAYS–WITH IS BETWEEN 0.00 AND 0.05.
CLOUDINESS FOR ASOS STATIONS DIFFERS FROM THE NON–ASOS OBSERVATION TAKEN BY A HUMAN OBSERVER. ASOS STATION CLOUDINESS IS BASED ON TIME–AVERAGED CEILOMETER DATA FOR CLOUDS AT OR BELOW 12,000 FEET AND ON SATELLITE DATA FOR CLOUDS ABOVE 12,000 FEET.
THE NUMBER OF DAYS WITH CLEAR, PARTLY CLOUDY, AND CLOUDY CONDITIONS FOR ASOS STATIONS IS THE SUM OF THE CEILOMETER AND SATELLITE DATA FOR THE SUNRISE TO SUNSET PERIOD.
GENERAL CONTINUED:
CLEAR INDICATES 0–2 OKTAS, PARTLY CLOUDY INDICATES 3–6 OKTAS, AND CLOUDY INDICATES 7 OR 8 OKTAS. WHEN AT LEAST ONE OF THE ELEMENTS (CEILOMETER OR SATELLITE) IS MISSING, THE DAILY CLOUDINESS IS NOT COMPUTED.
WIND DIRECTION IS RECORDED IN TENS OF DEGREES (2 DIGITS) CLOCKWISE FROM TRUE NORTH. "00" INDICATES CALM. "36" INDICATES TRUE NORTH.
RESULTANT WIND IS THE VECTOR AVERAGE OF THE SPEED AND DIRECTION.
AVERAGE TEMPERATURE IS THE SUM OF THE MEAN DAILY MAXIMUM AND MINIMUM TEMPERATURE DIVIDED BY 2.
SNOWFALL DATA COMPRISE ALL FORMS OF FROZEN PRECIPITATION, INCLUDING HAIL.
A HEATING (COOLING) DEGREE DAY IS THE DIFFERENCE BETWEEN THE AVERAGE DAILY TEMPERATURE AND 65 F.
DRY BULB IS THE TEMPERATURE OF THE AMBIENT AIR.
DEW POINT IS THE TEMPERATURE TO WHICH THE AIR MUST BE COOLED TO ACHIEVE 100 PERCENT RELATIVE HUMIDITY.
WET BULB IS THE TEMPERATURE THE AIR WOULD HAVE IF THE MOISTURE CONTENT WAS INCREASED TO 100 PERCENT RELATIVE HUMIDITY.
ON JULY 1, 1996, THE NATIONAL WEATHER SERVICE BEGAN USING THE "METAR" OBSERVATION CODE THAT WAS ALREADY EMPLOYED BY MOST OTHER NATIONS OF THE WORLD. THE MOST NOTICEABLE DIFFERENCE IN THIS ANNUAL PUBLICATION WILL BE THE CHANGE IN UNITS FROM TENTHS TO EIGHTS (OKTAS) FOR REPORTING THE AMOUNT OF SKY COVER.
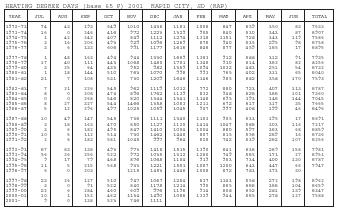
| HEATING DEGREE DAYS (base 65 F) 2001 RAPID CITY, SD (RAP) | |||||||||||||
| YEAR | JUL | AUG | SEP | OCT | NOV | DEC | JAN | FEB | MAR | APR | MAY | JUN | TOTAL |
| 1972–73 | 74 | 43 | 193 | 649 | 1010 | 1436 | 1181 | 1008 | 847 | 659 | 350 | 83 | 7533 |
| 1973–74 | 16 | 0 | 246 | 416 | 972 | 1223 | 1329 | 905 | 840 | 530 | 343 | 87 | 6907 |
| 1974–75 | 1 | 42 | 242 | 407 | 849 | 1112 | 1274 | 1318 | 1151 | 728 | 343 | 119 | 7586 |
| 1975–76 | 3 | 16 | 206 | 493 | 929 | 1096 | 1269 | 878 | 940 | 535 | 295 | 98 | 6758 |
| 1976–77 | 3 | 6 | 132 | 606 | 991 | 1177 | 1616 | 846 | 877 | 459 | 165 | 17 | 6895 |
| 1977–78 | 1 | 48 | 163 | 494 | 944 | 1330 | 1669 | 1383 | 912 | 588 | 312 | 91 | 7935 |
| 1978–79 | 17 | 40 | 111 | 443 | 1068 | 1480 | 1781 | 1348 | 910 | 614 | 362 | 82 | 8256 |
| 1979–80 | 3 | 25 | 64 | 433 | 952 | 982 | 1359 | 1094 | 1032 | 483 | 251 | 54 | 6732 |
| 1980–81 | 1 | 18 | 144 | 510 | 763 | 1070 | 998 | 993 | 765 | 402 | 311 | 65 | 6040 |
| 1981–82 | 21 | 7 | 108 | 531 | 730 | 1209 | 1646 | 1146 | 985 | 682 | 358 | 170 | 7593 |
| 1982–83 | 7 | 21 | 226 | 545 | 962 | 1119 | 1012 | 772 | 880 | 723 | 407 | 113 | 6787 |
| 1983–84 | 8 | 0 | 208 | 474 | 896 | 1762 | 1139 | 832 | 948 | 626 | 366 | 101 | 7360 |
| 1984–85 | 0 | 0 | 268 | 546 | 820 | 1344 | 1341 | 1148 | 895 | 393 | 146 | 144 | 7045 |
| 1985–86 | 8 | 27 | 327 | 544 | 1466 | 1358 | 1083 | 1211 | 672 | 617 | 317 | 35 | 7665 |
| 1986–87 | 5 | 12 | 296 | 497 | 1025 | 1059 | 1045 | 907 | 997 | 408 | 199 | 46 | 6496 |
| 1987–88 | 10 | 49 | 147 | 545 | 736 | 1111 | 1340 | 1103 | 905 | 533 | 195 | 17 | 6691 |
| 1988–89 | 3 | 18 | 163 | 470 | 850 | 1127 | 1120 | 1414 | 1047 | 586 | 303 | 116 | 7217 |
| 1989–90 | 3 | 6 | 182 | 495 | 847 | 1410 | 1004 | 1004 | 880 | 597 | 363 | 68 | 6859 |
| 1990–91 | 10 | 5 | 112 | 514 | 730 | 1462 | 1440 | 807 | 815 | 556 | 269 | 16 | 6736 |
| 1991–92 | 2 | 6 | 183 | 581 | 1045 | 997 | 964 | 828 | 742 | 539 | 262 | 107 | 6256 |
| 1992–93 | 67 | 83 | 138 | 493 | 973 | 1418 | 1515 | 1390 | 841 | 636 | 269 | 158 | 7981 |
| 1993–94 | 56 | 26 | 256 | 522 | 972 | 1035 | 1312 | 1260 | 749 | 565 | 171 | 27 | 6951 |
| 1994–95 | 9 | 17 | 79 | 468 | 876 | 1068 | 1104 | 919 | 983 | 734 | 400 | 130 | 6787 |
| 1995–96 | 11 | 5 | 215 | 568 | 933 | 1221 | 1551 | 1087 | 1200 | 643 | 447 | 66 | 7947 |
| 1996–97 | 6 | 0 | 203 | 1215 | 1453 | 1446 | 1008 | 872 | 783 | 373 | 30 | ||
| 1997–98 | 23 | 26 | 127 | 510 | 947 | 1067 | 1254 | 837 | 1143 | 558 | 272 | 198 | 6962 |
| 1998–99 | 3 | 0 | 91 | 522 | 840 | 1178 | 1214 | 790 | 885 | 666 | 366 | 104 | 6659 |
| 1999–00 | 22 | 6 | 284 | 460 | 609 | 976 | 1196 | 914 | 808 | 652 | 281 | 139 | 6347 |
| 2000–01 | 10 | 1 | 152 | 462 | 1134 | 1490 | 1086 | 1339 | 944 | 565 | 278 | 127 | 7588 |
| 2001– | 9 | 0 | 138 | 523 | 746 | 1111 | |||||||
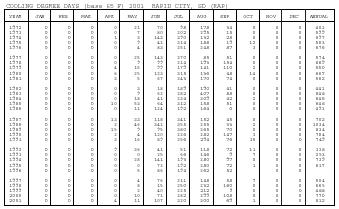
| COOLING DEGREE DAYS (base 65 F) 2001 RAPID CITY, SD (RAP) | |||||||||||||
| YEAR | JAN | FEB | MAR | APR | MAY | JUN | JUL | AUG | SEP | OCT | NOV | DEC | ANNUAL |
| 1972 | 0 | 0 | 0 | 0 | 21 | 70 | 98 | 178 | 34 | 0 | 0 | 0 | 401 |
| 1973 | 0 | 0 | 0 | 0 | 7 | 80 | 202 | 295 | 15 | 0 | 0 | 0 | 599 |
| 1974 | 0 | 0 | 0 | 1 | 3 | 143 | 390 | 132 | 28 | 0 | 0 | 0 | 697 |
| 1975 | 0 | 0 | 0 | 0 | 9 | 41 | 314 | 188 | 19 | 12 | 0 | 0 | 583 |
| 1976 | 0 | 0 | 0 | 0 | 4 | 83 | 251 | 248 | 87 | 3 | 0 | 0 | 676 |
| 1977 | 0 | 0 | 0 | 0 | 25 | 143 | 270 | 85 | 51 | 0 | 0 | 0 | 574 |
| 1978 | 0 | 0 | 0 | 0 | 9 | 99 | 214 | 193 | 154 | 0 | 0 | 0 | 669 |
| 1979 | 0 | 0 | 0 | 4 | 15 | 99 | 179 | 141 | 110 | 2 | 0 | 0 | 550 |
| 1980 | 0 | 0 | 0 | 6 | 25 | 123 | 315 | 136 | 48 | 14 | 0 | 0 | 667 |
| 1981 | 0 | 0 | 0 | 3 | 5 | 67 | 243 | 170 | 74 | 0 | 0 | 0 | 562 |
| 1982 | 0 | 0 | 0 | 0 | 3 | 18 | 189 | 190 | 41 | 0 | 0 | 0 | 441 |
| 1983 | 0 | 0 | 0 | 0 | 9 | 62 | 282 | 407 | 88 | 0 | 0 | 0 | 848 |
| 1984 | 0 | 0 | 0 | 0 | 18 | 41 | 234 | 309 | 42 | 2 | 0 | 0 | 646 |
| 1985 | 0 | 0 | 0 | 10 | 53 | 64 | 312 | 158 | 51 | 0 | 0 | 0 | 648 |
| 1986 | 0 | 0 | 0 | 0 | 11 | 124 | 192 | 164 | 0 | 0 | 0 | 0 | 491 |
| 1987 | 0 | 0 | 0 | 13 | 33 | 118 | 341 | 152 | 45 | 0 | 0 | 0 | 702 |
| 1988 | 0 | 0 | 0 | 2 | 46 | 341 | 355 | 255 | 33 | 2 | 0 | 0 | 1034 |
| 1989 | 0 | 0 | 0 | 15 | 9 | 95 | 380 | 265 | 70 | 0 | 0 | 0 | 834 |
| 1990 | 0 | 0 | 0 | 2 | 4 | 120 | 226 | 282 | 147 | 3 | 0 | 0 | 784 |
| 1991 | 0 | 0 | 0 | 3 | 16 | 89 | 256 | 294 | 76 | 15 | 0 | 0 | 749 |
| 1992 | 0 | 0 | 0 | 9 | 36 | 41 | 51 | 118 | 72 | 11 | 0 | 0 | 338 |
| 1993 | 0 | 0 | 0 | 0 | 0 | 25 | 66 | 146 | 9 | 7 | 0 | 0 | 253 |
| 1994 | 0 | 0 | 0 | 0 | 28 | 141 | 193 | 280 | 97 | 0 | 0 | 0 | 739 |
| 1995 | 0 | 0 | 0 | 0 | 0 | 72 | 192 | 280 | 72 | 1 | 0 | 0 | 617 |
| 1996 | 0 | 0 | 0 | 0 | 5 | 86 | 194 | 262 | 52 | 0 | 0 | ||
| 1997 | 0 | 0 | 0 | 0 | 4 | 76 | 211 | 148 | 58 | 7 | 0 | 0 | 504 |
| 1998 | 0 | 0 | 0 | 0 | 8 | 15 | 250 | 232 | 160 | 0 | 0 | 0 | 665 |
| 1999 | 0 | 0 | 0 | 0 | 2 | 40 | 225 | 212 | 9 | 0 | 0 | 0 | 488 |
| 2000 | 0 | 0 | 0 | 0 | 10 | 71 | 282 | 299 | 108 | 0 | 0 | 0 | 770 |
| 2001 | 0 | 0 | 0 | 4 | 11 | 107 | 320 | 300 | 69 | 1 | 0 | 0 | 812 |
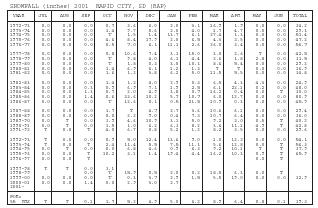
| SNOWFALL (inches) 2001 RAPID CITY, SD (RAP) | |||||||||||||
| YEAR | JUL | AUG | SEP | OCT | NOV | DEC | JAN | FEB | MAR | APR | MAY | JUN | TOTAL |
| 1972–73 | 0.0 | 0.0 | 0.0 | 0.7 | 3.6 | 6.0 | 2.0 | 3.1 | 16.9 | 1.9 | 0.0 | 0.0 | 34.2 |
| 1973–74 | 0.0 | 0.0 | 0.0 | 1.4 | 9.7 | 5.6 | 2.0 | 4.0 | 1.7 | 4.7 | 0.0 | 0.0 | 29.1 |
| 1974–75 | 0.0 | 0.0 | 0.0 | T | 1.5 | 1.4 | 13.7 | 6.1 | 27.4 | 1.3 | 0.0 | 0.0 | 51.4 |
| 1975–76 | 0.0 | 0.0 | 0.0 | 4.6 | 8.4 | 17.9 | 2.0 | 6.5 | 4.3 | 3.5 | 0.0 | 0.0 | 47.2 |
| 1976–77 | 0.0 | 0.0 | 0.0 | 0.5 | 7.0 | 6.1 | 11.1 | 2.6 | 26.0 | 3.4 | 0.0 | 0.0 | 56.7 |
| 1977–78 | 0.0 | 0.0 | 0.0 | 0.8 | 10.6 | 7.4 | 3.1 | 15.0 | 3.0 | 2.6 | T | 0.0 | 42.5 |
| 1978–79 | 0.0 | 0.0 | 0.0 | T | 9.8 | 4.0 | 6.1 | 4.4 | 2.6 | 1.8 | 2.8 | 0.0 | 31.5 |
| 1979–80 | 0.0 | 0.0 | 0.0 | T | 1.8 | 0.3 | 3.0 | 10.1 | 8.6 | 5.4 | 0.0 | 0.0 | 29.2 |
| 1980–81 | 0.0 | 0.0 | 0.0 | 1.4 | 6.9 | 6.1 | 1.2 | 1.3 | T | T | 0.0 | 0.0 | 16.9 |
| 1981–82 | 0.0 | 0.0 | 0.0 | 1.6 | 1.2 | 3.8 | 6.2 | 5.0 | 11.5 | 5.5 | 0.0 | 0.0 | 34.8 |
| 1982–83 | 0.0 | 0.0 | 0.0 | 1.4 | 1.2 | 4.0 | 2.9 | 0.3 | 6.5 | 4.3 | 4.3 | 0.0 | 24.9 |
| 1983–84 | 0.0 | 0.0 | 0.3 | 0.9 | 6.9 | 7.1 | 1.9 | 2.5 | 6.1 | 22.1 | 0.2 | 0.0 | 48.0 |
| 1984–85 | 0.0 | 0.0 | 1.3 | 0.7 | 2.0 | 4.9 | 3.8 | 0.7 | 16.2 | 0.4 | 0.0 | T | 30.0 |
| 1985–86 | 0.0 | 0.0 | 1.4 | 0.6 | 33.6 | 10.2 | 5.7 | 10.7 | 6.0 | 12.7 | 0.0 | 0.0 | 80.9 |
| 1986–87 | 0.0 | 0.0 | 0.0 | T | 12.6 | 0.1 | 0.5 | 21.5 | 10.9 | 0.3 | 0.0 | 0.0 | 45.9 |
| 1987–88 | 0.0 | 0.0 | 0.0 | 1.7 | T | 4.7 | 2.7 | 3.6 | 10.6 | 6.1 | 0.0 | 0.0 | 29.4 |
| 1988–89 | 0.0 | 0.0 | 0.0 | 0.0 | 2.2 | 9.0 | 0.4 | 7.3 | 10.7 | 6.4 | 0.0 | 0.0 | 36.0 |
| 1989–90 | 0.0 | T | 0.0 | 3.9 | 4.6 | 10.9 | 3.1 | 5.0 | 9.2 | 3.0 | 0.5 | T | 40.2 |
| 1990–91 | 0.0 | T | 0.0 | 1.5 | 1.0 | 6.2 | 6.3 | 8.2 | 3.6 | 11.1 | 4.9 | T | 42.8 |
| 1991–92 | T | 0.0 | T | 4.0 | 6.7 | 0.8 | 5.2 | 1.2 | 8.2 | 3.5 | 0.0 | 0.0 | 29.6 |
| 1992–93 | T | 0.0 | 0.0 | 0.9 | 5.0 | 12.4 | 13.6 | 9.0 | 1.0 | 12.2 | 0.0 | 0.0 | 54.1 |
| 1993–94 | T | 0.0 | T | 2.4 | 11.4 | 5.5 | 7.5 | 11.1 | 5.6 | 12.8 | 0.0 | T | 56.3 |
| 1994–95 | 0.0 | T | 0.0 | 0.0 | 6.8 | 4.6 | 0.9 | 6.3 | 9.2 | 10.1 | T | T | 37.9 |
| 1995–96 | 0.0 | 0.0 | T | 10.2 | 3.1 | 1.4 | 19.4 | 4.4 | 16.2 | 10.3 | 0.9 | T | 65.9 |
| 1996–97 | 0.0 | 0.0 | T | 0.0 | T | ||||||||
| 1997–98 | T | T | 0.0 | 3.1 | |||||||||
| 1998–99 | 0.0 | T | 15.9 | 0.5 | 2.0 | 0.2 | 18.5 | 6.3 | 0.0 | T | |||
| 1999–00 | 0.0 | 0.0 | 0.0 | T | 0.3 | 3.7 | 2.9 | 1.5 | 5.5 | 19.0 | 0.0 | 0.0 | 32.9 |
| 2000–01 | 0.0 | 0.0 | 1.4 | 0.0 | 2.9 | 3.0 | 2.7 | ||||||
| 2001– | |||||||||||||
| POR=55 YRS | T | T | 0.1 | 1.7 | 5.2 | 4.9 | 5.0 | 6.2 | 8.9 | 6.4 | 0.8 | 0.1 | 39.3 |
Comment about this article, ask questions, or add new information about this topic: