2001 PENDLETON, OREGON (PDT)
Pendleton is located in the southeastern part of the Columbia Basin, that low country of northern Oregon and central and eastern Washington which is almost entirely surrounded by mountains. This Basin is bounded on the south by the high country of central Oregon, on the north by the mountains of western Canada, on the west by the Cascade Range and on the east by the Blue Mountains and the north Idaho plateau. The gorge in the Cascades through which the Columbia River reaches the Pacific is the most important break in the barriers surrounding this basin. These physical features have important influences on the general climate of Pendleton and the surrounding territory.
The Weather Service Office at Pendleton Airport is located in rolling country which slopes generally upward toward the Blue Mountains about 15 miles to the east and southeast. The Columbia River approaches the area from the northwest to its junction with the Walla Walla River at an elevation of 35l feet and some 25 miles north of Pendleton, then turns southwestward to be joined a few miles below by the Umatilla River. Both the Walla Walla and Umatilla Rivers have their sources in the Blue Mountains and flow westward to the Columbia. The observation station is at an elevation of nearly 1,500 feet, about 3 miles northwest of downtown Pendleton. The city of Pendleton lies in the shallow east–west valley of the Umatilla River, approximately 400 feet lower than the airport.
Precipitation in the Pendleton area is definitely seasonal in occurrence with an average of only 10 percent of the annual total occurring in the three–month period, July–September. Most precipitation reaching this area accompanies cyclonic storms moving in from the Pacific Ocean. These storms reach their greatest intensity and frequency from October through April. The Cascade Range west of the Columbia Basin reduces the amount of precipitation received from the Pacific cyclonic storms. This influence is felt, particularly, in the desert area of the central part of the Basin. A gradual rise in elevation from the Columbia River to the foothills of the Blue Mountains again results in increased precipitation. This increase supplies sufficient moisture for productive wheat, pea, and stock raising activity in the area surrounding Pendleton.
The lighter summertime precipitation usually accompanies thunderstorms which often move into the area from the south or southwest. On occasion, these storms are quite intense, causing flash flooding with resultant heavy property damage and even loss of life.
Seasonal temperature extremes are usually quite moderate for the latitude. The last occurrence in spring of temperatures as low as 32 degrees is mid–April, and the average last occurrence in the fall of 32 degrees is late October. At the city station, where cool air settles in the valley on still nights, temperatures of 32 degrees have been recorded later in the spring and earlier in the fall. Under usual atmospheric conditions, air from the Pacific, with moderate temperature characteristics, moves across the Cascades or through the Columbia Gorge resulting in mild temperatures in the Pendleton area. When this flow of air from the west is impeded by slow–moving high pressure systems over the interior of the continent, temperature conditions sometimes become rather severe, hot in summer and cold in winter. During the summer or early fall, if a stagnant high predominates to the north or east of Pendleton, the hot, dry conditions may prove detrimental to crops during late May and June, and cause fire danger in the forest and grassland areas during late summer and early fall. During winter, coldest temperatures occur when air from a cold high pressure system in central Canada moves southwestward across the Rockies and flows down into the Columbia Basin. Under this condition the heavy cold air sometimes remains at low levels in the Basin for several days while warmer air from the Pacific flows above it, causing comparatively mild temperatures at higher elevations. Extreme winter temperatures are not particularly common in the Pendleton area. Below zero readings are recorded in approximately 60 percent of winters. Maximum temperatures usually reach 100 degrees or slightly higher on a few days during the summer.
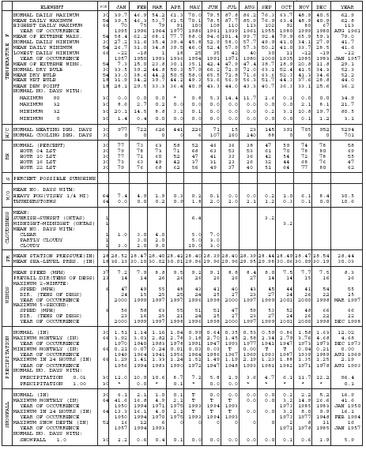
NORMALS, MEANS, AND EXTREMES
PENDLETON, OR (PDT)
LATITUDE: LONGITUDE: ELEVATION (FT): TIME ZONE: WBAN: 24155
45 41′ 54″ N 118 50′ 03″ W GRND: 1504 BARO: &#x 0A0;1504 PACIFIC (UTC + 8)
| ELEMENT | POR | JAN | FEB | MAR | APR | MAY | JUN | JUL | AUG | SEP | OCT | NOV | DEC | YEAR | |
| TEMPERATURE F | NORMAL DAILY MAXIMUM | 30 | 39.7 | 46.9 | 54.2 | 61.3 | 70.0 | 79.5 | 87.8 | 86.2 | 76.3 | 63.7 | 48.9 | 40.5 | 62.9 |
| MEAN DAILY MAXIMUM | 54 | 39.5 | 46.3 | 53.7 | 61.5 | 70.1 | 78.5 | 87.7 | 85.9 | 76.9 | 63.4 | 48.9 | 40.9 | 62.8 | |
| HIGHEST DAILY MAXIMUM | 66 | 70 | 75 | 79 | 91 | 100 | 108 | 110 | 113 | 102 | 92 | 80 | 67 | 113 | |
| YEAR OF OCCURRENCE | 1995 | 1996 | 1964 | 1977 | 1986 | 1961 | 1939 | 1961 | 1955 | 1980 | 1999 | 1980 | AUG 1961 | ||
| MEAN OF EXTREME MAXS. | 54 | 58.4 | 62.2 | 68.1 | 77.7 | 88.0 | 94.6 | 101.4 | 99.7 | 92.4 | 79.9 | 65.9 | 59.3 | 79.0 | |
| NORMAL DAILY MINIMUM | 30 | 27.2 | 31.6 | 35.4 | 39.4 | 45.8 | 52.9 | 58.0 | 57.7 | 49.9 | 41.0 | 34.1 | 27.9 | 41.7 | |
| MEAN DAILY MINIMUM | 54 | 26.7 | 31.0 | 34.8 | 39.5 | 46.0 | 52.4 | 57.9 | 57.3 | 50.2 | 41.0 | 33.7 | 28.5 | 41.6 | |
| LOWEST DAILY MINIMUM | 66 | -22 | -18 | 1 | 18 | 25 | 35 | 42 | 40 | 30 | 11 | -12 | -19 | -22 | |
| YEAR OF OCCURRENCE | 1957 | 1950 | 1993 | 1936 | 1954 | 1991 | 1971 | 1980 | 2000 | 1935 | 1985 | 1983 | JAN 1957 | ||
| MEAN OF EXTREME MINS. | 54 | 7.3 | 15.0 | 23.8 | 30.1 | 35.1 | 42.4 | 47.9 | 47.4 | 38.7 | 28.9 | 20.8 | 11.8 | 29.1 | |
| NORMAL DRY BULB | 30 | 33.5 | 39.2 | 44.8 | 50.3 | 57.9 | 66.2 | 72.9 | 72.0 | 63.1 | 52.4 | 41.5 | 34.3 | 52.3 | |
| MEAN DRY BULB | 54 | 33.0 | 38.6 | 44.2 | 50.5 | 58.0 | 65.5 | 72.8 | 71.6 | 63.6 | 52.3 | 41.3 | 34.6 | 52.2 | |
| MEAN WET BULB | 18 | 31.9 | 34.2 | 39.7 | 44.2 | 49.3 | 53.6 | 56.9 | 56.3 | 51.7 | 44.3 | 37.6 | 28.8 | 44.0 | |
| MEAN DEW POINT | 18 | 28.1 | 29.5 | 33.3 | 36.4 | 40.9 | 43.3 | 44.0 | 43.3 | 40.7 | 36.3 | 33.1 | 25.6 | 36.2 | |
| NORMAL NO. DAYS WITH: | |||||||||||||||
| MAXIMUM 90 | 30 | 0.0 | 0.0 | 0.0 | * | 0.8 | 5.3 | 14.4 | 11.7 | 2.6 | 0.1 | 0.0 | 0.0 | 34.9 | |
| MAXIMUM 32 | 30 | 8.6 | 2.7 | 0.2 | 0.0 | 0.0 | 0.0 | 0.0 | 0.0 | 0.0 | 0.0 | 2.1 | 8.1 | 21.7 | |
| MINIMUM 32 | 30 | 20.1 | 14.5 | 8.8 | 3.2 | 0.1 | 0.0 | 0.0 | 0.0 | 0.2 | 3.1 | 10.8 | 19.7 | 80.5 | |
| MINIMUM 0 | 30 | 1.4 | 0.4 | 0.0 | 0.0 | 0.0 | 0.0 | 0.0 | 0.0 | 0.0 | 0.0 | 0.1 | 1.2 | 3.1 | |
| H/C | NORMAL HEATING DEG. DAYS | 30 | 977 | 722 | 626 | 441 | 226 | 71 | 15 | 23 | 145 | 391 | 705 | 952 | 5294 |
| NORMAL COOLING DEG. DAYS | 30 | 0 | 0 | 0 | 0 | 6 | 107 | 260 | 240 | 88 | 0 | 0 | 0 | 701 | |
| RH | NORMAL (PERCENT) | 30 | 77 | 73 | 63 | 58 | 52 | 46 | 36 | 38 | 47 | 59 | 74 | 78 | 58 |
| HOUR 04 LST | 30 | 79 | 78 | 73 | 71 | 68 | 63 | 53 | 53 | 61 | 70 | 78 | 80 | 69 | |
| HOUR 10 LST | 30 | 77 | 71 | 60 | 52 | 47 | 41 | 33 | 36 | 42 | 54 | 72 | 78 | 55 | |
| HOUR 16 LST | 30 | 73 | 63 | 49 | 42 | 37 | 31 | 23 | 26 | 32 | 44 | 68 | 76 | 47 | |
| HOUR 22 LST | 30 | 79 | 76 | 68 | 62 | 56 | 49 | 37 | 40 | 51 | 64 | 77 | 80 | 62 | |
| S | PERCENT POSSIBLE SUNSHINE | ||||||||||||||
| W/O | MEAN NO. DAYS WITH: | ||||||||||||||
| HEAVY FOG(VISBY 1/4 MI) | 64 | 7.4 | 4.9 | 1.9 | 0.3 | 0.2 | 0.1 | 0.0 | 0.0 | 0.2 | 1.0 | 6.1 | 8.4 | 30.5 | |
| THUNDERSTORMS | 64 | 0.0 | 0.0 | 0.2 | 0.9 | 1.8 | 2.0 | 2.0 | 2.1 | 1.2 | 0.3 | 0.1 | 0.0 | 10.6 | |
| CLOUDINESS | MEAN: | ||||||||||||||
| SUNRISE-SUNSET (OKTAS) | 1 | 6.4 | 3.2 | ||||||||||||
| MIDNIGHT-MIDNIGHT (OKTAS) | 1 | 3.2 | |||||||||||||
| MEAN NO. DAYS WITH: | |||||||||||||||
| CLEAR | 1 | 1.0 | 3.0 | 4.0 | 5.0 | 7.0 | |||||||||
| PARTLY CLOUDY | 1 | 3.0 | 2.0 | 5.0 | 3.0 | ||||||||||
| CLOUDY | 1 | 3.0 | 2.0 | 9.0 | 10.0 | 3.0 | |||||||||
| PR | MEAN STATION PRESSURE(IN) | 28 | 28.52 | 28.47 | 28.40 | 28.42 | 28.40 | 28.39 | 28.40 | 28.39 | 28.44 | 28.49 | 28.47 | 28.54 | 28.44 |
| MEAN SEA-LEVEL PRES. (IN) | 18 | 30.13 | 30.10 | 30.02 | 30.01 | 29.96 | 29.96 | 29.96 | 29.95 | 29.98 | 30.06 | 30.09 | 30.19 | 30.03 | |
| WINDS | MEAN SPEED (MPH) | 37 | 7.2 | 7.9 | 8.8 | 9.5 | 9.2 | 9.1 | 8.8 | 8.4 | 8.0 | 7.5 | 7.7 | 7.5 | 8.3 |
| PREVAIL. DIR (TENS OF DEGS) | 23 | 14 | 14 | 26 | 26 | 26 | 26 | 26 | 27 | 14 | 14 | 15 | 16 | 26 | |
| MAXIMUM 2-MINUTE: | |||||||||||||||
| SPEED (MPH) | 6 | 47 | 49 | 55 | 48 | 43 | 41 | 40 | 43 | 45 | 44 | 41 | 54 | 55 | |
| DIR. (TENS OF DEGS) | 24 | 15 | 25 | 25 | 24 | 25 | 27 | 23 | 27 | 24 | 26 | 22 | 25 | ||
| YEAR OF OCCURRENCE | 2000 | 1999 | 1997 | 1997 | 1996 | 1998 | 2000 | 1997 | 1999 | 2001 | 2000 | 1998 | MAR 1997 | ||
| MAXIMUM 5-SECOND: | |||||||||||||||
| SPEED (MPH) | 6 | 56 | 58 | 63 | 55 | 51 | 51 | 47 | 59 | 53 | 52 | 48 | 66 | 66 | |
| DIR. (TENS OF DEGS) | 23 | 16 | 25 | 21 | 24 | 25 | 27 | 23 | 27 | 24 | 26 | 22 | 22 | ||
| YEAR OF OCCURRENCE | 2000 | 1999 | 1997 | 1998 | 1996 | 1998 | 2000 | 1997 | 1999 | 2001 | 2000 | 1998 | DEC 1998 | ||
| PRECIPITATION | NORMAL (IN) | 30 | 1.51 | 1.14 | 1.16 | 1.04 | 0.99 | 0.64 | 0.35 | 0.53 | 0.59 | 0.86 | 1.58 | 1.63 | 12.02 |
| MAXIMUM MONTHLY (IN) | 66 | 3.92 | 3.03 | 2.82 | 2.78 | 3.18 | 2.70 | 1.45 | 2.58 | 2.34 | 2.79 | 3.76 | 4.68 | 4.68 | |
| YEAR OF OCCURRENCE | 1970 | 1940 | 1983 | 1978 | 1991 | 1947 | 1993 | 1977 | 1941 | 1947 | 1973 | 1973 | DEC 1973 | ||
| MINIMUM MONTHLY (IN) | 66 | 0.21 | 0.07 | 0.24 | 0.01 | 0.03 | 0.03 | T | 0.00 | T | T | 0.04 | 0.21 | 0.00 | |
| YEAR OF OCCURRENCE | 1949 | 1964 | 1941 | 1956 | 1964 | 1986 | 1967 | 1969 | 1993 | 1987 | 1939 | 1989 | AUG 1969 | ||
| MAXIMUM IN 24 HOURS (IN) | 66 | 1.29 | 1.41 | 1.33 | 1.24 | 1.52 | 1.49 | 1.19 | 2.19 | 1.23 | 1.88 | 1.35 | 1.25 | 2.19 | |
| YEAR OF OCCURRENCE | 1956 | 1994 | 1983 | 1990 | 1972 | 1947 | 1948 | 1993 | 1981 | 1982 | 1971 | 1978 | AUG 1993 | ||
| NORMAL NO. DAYS WITH: | |||||||||||||||
| PRECIPITATION 0.01 | 30 | 12.0 | 10.9 | 10.6 | 8.7 | 7.2 | 5.8 | 2.9 | 3.6 | 4.7 | 6.1 | 11.7 | 12.2 | 96.4 | |
| PRECIPITATION 1.00 | 30 | * | 0.0 | * | 0.1 | * | 0.0 | 0.0 | * | * | * | * | * | 0.1 | |
| SNOWFALL | NORMAL (IN) | 30 | 6.1 | 2.1 | 1.0 | 0.1 | T | 0.0 | 0.0 | 0.0 | 0.0 | 0.2 | 2.2 | 5.2 | 16.9 |
| MAXIMUM MONTHLY (IN) | 64 | 41.6 | 16.8 | 4.9 | 2.2 | T | T | T | 0.0 | 0.0 | 3.2 | 14.9 | 26.6 | 41.6 | |
| YEAR OF OCCURRENCE | 1950 | 1994 | 1971 | 1975 | 1993 | 1994 | 1993 | 1973 | 1985 | 1983 | JAN 1950 | ||||
| MAXIMUM IN 24 HOURS (IN) | 64 | 13.3 | 16.1 | 4.0 | 2.2 | T | T | T | 0.0 | 0.0 | 3.2 | 8.0 | 9.9 | 16.1 | |
| YEAR OF OCCURRENCE | 1950 | 1994 | 1970 | 1975 | 1993 | 1994 | 1993 | 1973 | 1977 | 1948 | FEB 1994 | ||||
| MAXIMUM SNOW DEPTH (IN) | 52 | 16 | 12 | 6 | 0 | 0 | 0 | 0 | 0 | 0 | 2 | 8 | 11 | 16 | |
| YEAR OF OCCURRENCE | 1957 | 1994 | 1993 | 1971 | 1978 | 1985 | JAN 1957 | ||||||||
| NORMAL NO. DAYS WITH: | |||||||||||||||
| SNOWFALL 1.0 | 30 | 2.2 | 0.6 | 0.4 | 0.1 | 0.0 | 0.0 | 0.0 | 0.0 | 0.0 | 0.1 | 0.6 | 1.9 | 5.9 |

| PRECIPITATION (inches) 2001 PENDLETON, OR (PDT) | |||||||||||||
| YEAR | JAN | FEB | MAR | APR | MAY | JUN | JUL | AUG | SEP | OCT | NOV | DEC | ANNUAL |
| 1972 | 0.96 | 1.08 | 1.47 | 0.68 | 1.97 | 0.80 | 0.58 | 0.36 | 0.16 | 0.58 | 0.70 | 2.31 | 11.65 |
| 1973 | 0.50 | 1.09 | 0.43 | 0.27 | 0.67 | 0.15 | 0.01 | 0.08 | 1.34 | 1.71 | 3.76 | 4.68 | 14.69 |
| 1974 | 0.79 | 1.57 | 0.81 | 2.13 | 0.26 | 0.19 | 0.90 | T | T | 0.29 | 1.00 | 1.59 | 9.53 |
| 1975 | 3.53 | 1.30 | 0.65 | 0.97 | 0.30 | 0.28 | 0.73 | 0.67 | 0.00 | 1.80 | 0.84 | 1.98 | 13.05 |
| 1976 | 1.77 | 1.00 | 1.65 | 1.09 | 0.92 | 0.33 | 0.16 | 1.77 | 0.18 | 0.54 | 0.19 | 0.44 | 10.04 |
| 1977 | 0.48 | 0.64 | 1.51 | 0.18 | 1.87 | 0.37 | 0.06 | 2.58 | 1.17 | 0.51 | 2.00 | 2.42 | 13.79 |
| 1978 | 2.82 | 1.60 | 1.03 | 2.78 | 0.63 | 0.76 | 0.77 | 2.21 | 0.92 | T | 2.37 | 1.86 | 17.75 |
| 1979 | 1.43 | 1.72 | 1.18 | 1.17 | 0.39 | 0.21 | 0.09 | 1.40 | 0.30 | 1.68 | 1.83 | 0.62 | 12.02 |
| 1980 | 2.48 | 1.39 | 1.60 | 0.59 | 2.14 | 1.12 | 0.77 | 0.03 | 0.59 | 1.22 | 0.84 | 1.20 | 13.97 |
| 1981 | 0.89 | 1.35 | 1.43 | 1.20 | 1.59 | 1.53 | 0.94 | 0.03 | 1.31 | 0.86 | 1.91 | 2.31 | 15.35 |
| 1982 | 1.54 | 0.77 | 1.22 | 0.84 | 0.31 | 0.63 | 0.51 | 0.24 | 1.47 | 2.67 | 0.34 | 2.20 | 12.74 |
| 1983 | 0.86 | 1.57 | 2.82 | 0.70 | 0.73 | 1.44 | 0.52 | 0.56 | 0.46 | 0.84 | 1.67 | 3.42 | 15.59 |
| 1984 | 0.53 | 1.74 | 1.83 | 1.70 | 1.02 | 1.13 | 0.06 | 0.44 | 0.39 | 1.02 | 2.14 | 0.92 | 12.92 |
| 1985 | 0.44 | 1.33 | 1.13 | 0.37 | 0.44 | 0.69 | 0.34 | 0.26 | 2.10 | 0.89 | 2.11 | 1.27 | 11.37 |
| 1986 | 1.66 | 2.58 | 1.13 | 0.43 | 1.18 | 0.03 | 0.48 | 0.02 | 1.28 | 0.80 | 2.12 | 0.82 | 12.53 |
| 1987 | 1.48 | 0.64 | 1.39 | 0.47 | 0.85 | 0.38 | 0.34 | 0.05 | 0.03 | T | 0.76 | 1.23 | 7.62 |
| 1988 | 1.86 | 0.12 | 0.95 | 2.47 | 1.56 | 0.31 | 0.01 | T | 0.31 | 0.10 | 2.16 | 0.37 | 10.22 |
| 1989 | 1.86 | 1.36 | 1.72 | 1.57 | 1.47 | 0.57 | 0.09 | 1.25 | 0.12 | 0.84 | 1.27 | 0.21 | 12.33 |
| 1990 | 0.77 | 0.28 | 1.14 | 1.54 | 1.83 | 0.58 | 0.18 | 0.62 | T | 0.78 | 0.87 | 0.84 | 9.43 |
| 1991 | 0.98 | 0.57 | 1.00 | 0.71 | 3.18 | 2.14 | 0.24 | 0.42 | T | 0.92 | 2.68 | 0.67 | 13.51 |
| 1992 | 0.41 | 1.04 | 0.26 | 1.21 | 0.07 | 0.94 | 0.70 | 0.43 | 0.42 | 1.32 | 1.15 | 0.73 | 8.68 |
| 1993 | 1.79 | 0.80 | 1.49 | 1.85 | 1.51 | 0.71 | 1.45 | 2.19 | T | 0.22 | 0.93 | 0.92 | 13.86 |
| 1994 | 1.57 | 1.71 | 0.56 | 0.45 | 2.55 | 0.77 | 0.38 | T | 0.36 | 1.28 | 1.98 | 0.85 | 12.46 |
| 1995 | 2.53 | 1.07 | 1.93 | 2.28 | 0.97 | 2.30 | 0.24 | 0.29 | 0.55 | 1.21 | 2.18 | 1.73 | 17.28 |
| 1996 | 1.88 | 1.80 | 1.00 | 1.08 | 2.00 | 0.47 | 0.06 | 0.05 | 0.61 | 1.22 | 1.96 | 2.32 | 14.45 |
| 1997 | 1.84 | 0.39 | 1.16 | 1.56 | 0.33 | 0.76 | 0.66 | 0.07 | 0.77 | 1.43 | 1.64 | 1.05 | 11.66 |
| 1998 | 2.61 | 1.19 | 1.01 | 1.28 | 1.53 | 0.76 | 0.68 | T | 1.11 | 0.60 | 2.31 | 1.37 | 14.45 |
| 1999 | 0.81 | 1.22 | 0.74 | 0.50 | 1.27 | 0.51 | T | 0.54 | 0.01 | 1.51 | 1.23 | 1.01 | 9.35 |
| 2000 | 1.99 | 2.98 | 2.42 | 0.69 | 1.60 | 0.72 | 0.07 | T | 2.01 | 2.06 | 1.22 | 0.57 | 16.33 |
| 2001 | 0.95 | 0.62 | 1.31 | 1.89 | 0.45 | 1.12 | 0.52 | 0.08 | 0.09 | 1.54 | 1.15 | 0.70 | 10.42 |
| POR=102 YRS | 1.57 | 1.31 | 1.24 | 1.08 | 1.15 | 0.96 | 0.31 | 0.40 | 0.62 | 1.04 | 1.51 | 1.50 | 12.69 |
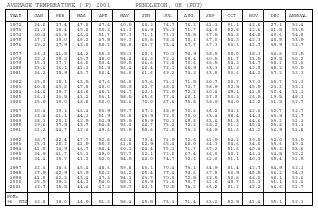
| AVERAGE TEMPERATURE (F) 2001 PENDLETON, OR (PDT) | |||||||||||||
| YEAR | JAN | FEB | MAR | APR | MAY | JUN | JUL | AUG | SEP | OCT | NOV | DEC | ANNUAL |
| 1972 | 34.0 | 37.4 | 47.8 | 47.6 | 60.9 | 68.3 | 74.7 | 76.2 | 61.1 | 51.1 | 42.6 | 27.1 | 52.4 |
| 1973 | 31.3 | 38.4 | 45.8 | 50.3 | 61.3 | 66.9 | 75.3 | 71.7 | 64.0 | 52.8 | 42.6 | 41.5 | 53.5 |
| 1974 | 30.4 | 43.8 | 46.4 | 51.7 | 57.3 | 71.1 | 73.3 | 75.5 | 67.5 | 54.8 | 44.8 | 40.6 | 54.8 |
| 1975 | 37.1 | 39.0 | 45.2 | 47.5 | 59.3 | 65.8 | 78.4 | 70.1 | 67.0 | 54.3 | 42.3 | 40.5 | 53.9 |
| 1976 | 39.2 | 37.9 | 42.8 | 50.2 | 58.8 | 63.7 | 73.4 | 67.7 | 67.3 | 53.1 | 42.7 | 35.9 | 52.7 |
| 1977 | 26.3 | 41.5 | 44.2 | 55.3 | 55.1 | 69.1 | 70.3 | 74.9 | 58.5 | 50.0 | 38.3 | 34.8 | 51.5 |
| 1978 | 32.2 | 39.3 | 45.7 | 48.0 | 54.4 | 66.3 | 72.2 | 69.4 | 60.5 | 51.7 | 33.5 | 29.5 | 50.2 |
| 1979 | 15.3 | 37.7 | 46.0 | 50.4 | 59.5 | 66.6 | 72.8 | 70.6 | 65.5 | 54.3 | 34.7 | 38.2 | 51.0 |
| 1980 | 25.6 | 36.1 | 41.3 | 51.9 | 56.4 | 60.4 | 72.1 | 66.9 | 63.3 | 51.3 | 42.0 | 39.2 | 50.5 |
| 1981 | 36.2 | 38.9 | 45.7 | 50.4 | 56.0 | 61.6 | 69.2 | 74.3 | 63.8 | 50.6 | 44.2 | 37.2 | 52.3 |
| 1982 | 35.0 | 38.1 | 43.5 | 47.6 | 56.8 | 67.6 | 71.1 | 71.5 | 60.7 | 50.7 | 37.3 | 35.7 | 51.3 |
| 1983 | 40.8 | 43.8 | 47.8 | 49.0 | 58.9 | 62.7 | 68.4 | 72.7 | 58.9 | 52.5 | 45.9 | 23.2 | 52.1 |
| 1984 | 34.6 | 39.7 | 46.8 | 48.2 | 54.7 | 62.1 | 72.9 | 72.2 | 60.4 | 49.1 | 41.8 | 30.4 | 51.1 |
| 1985 | 26.3 | 33.5 | 43.2 | 53.1 | 58.5 | 65.6 | 77.4 | 68.1 | 57.0 | 50.3 | 26.5 | 19.5 | 48.3 |
| 1986 | 35.9 | 39.0 | 48.8 | 50.0 | 58.6 | 70.0 | 67.6 | 75.8 | 58.9 | 54.0 | 42.2 | 31.5 | 52.7 |
| 1987 | 30.4 | 39.1 | 46.4 | 53.9 | 59.7 | 67.2 | 68.9 | 70.6 | 66.2 | 54.1 | 42.6 | 32.7 | 52.7 |
| 1988 | 32.4 | 41.1 | 44.1 | 51.9 | 56.8 | 63.9 | 72.0 | 70.0 | 63.4 | 58.4 | 44.3 | 33.9 | 52.7 |
| 1989 | 38.3 | 25.1 | 42.5 | 52.9 | 55.9 | 65.9 | 70.3 | 68.8 | 63.6 | 51.8 | 44.6 | 33.2 | 51.1 |
| 1990 | 39.6 | 37.9 | 45.7 | 54.8 | 56.4 | 64.7 | 75.2 | 72.2 | 68.2 | 51.3 | 45.4 | 25.8 | 53.1 |
| 1991 | 31.2 | 44.7 | 42.6 | 49.6 | 53.9 | 59.6 | 71.5 | 73.3 | 64.9 | 51.6 | 41.2 | 36.9 | 51.8 |
| 1992 | 38.7 | 42.4 | 47.7 | 52.8 | 62.4 | 70.4 | 71.9 | 72.6 | 61.9 | 54.2 | 39.8 | 32.0 | 53.9 |
| 1993 | 25.1 | 28.2 | 41.9 | 50.3 | 61.8 | 62.9 | 65.4 | 68.0 | 64.3 | 54.6 | 34.6 | 35.6 | 49.4 |
| 1994 | 41.0 | 34.9 | 46.7 | 54.4 | 60.1 | 64.4 | 75.3 | 71.7 | 67.2 | 51.6 | 40.4 | 35.3 | 53.6 |
| 1995 | 34.9 | 41.7 | 45.3 | 49.0 | 57.7 | 62.1 | 72.0 | 67.4 | 66.0 | 50.2 | 46.1 | 34.5 | 52.2 |
| 1996 | 34.4 | 35.7 | 43.3 | 52.0 | 54.5 | 64.0 | 74.7 | 72.1 | 61.0 | 51.1 | 40.3 | 35.4 | 51.5 |
| 1997 | 32.6 | 38.6 | 45.4 | 48.6 | 59.8 | 63.1 | 70.4 | 73.1 | 64.9 | 51.4 | 42.7 | 34.9 | 52.1 |
| 1998 | 37.9 | 42.9 | 45.9 | 50.3 | 56.2 | 65.4 | 77.4 | 74.6 | 67.8 | 50.9 | 45.5 | 36.2 | 54.3 |
| 1999 | 41.0 | 42.3 | 43.4 | 47.3 | 54.1 | 63.7 | 70.0 | 72.5 | 62.5 | 50.8 | 46.0 | 38.1 | 52.6 |
| 2000 | 35.5 | 39.2 | 44.1 | 54.0 | 58.3 | 65.9 | 71.6 | 70.7 | 61.6 | 49.7 | 35.1 | 31.1 | 51.4 |
| 2001 | 32.7 | 35.5 | 44.4 | 47.3 | 58.7 | 62.1 | 70.5 | 73.2 | 66.2 | 51.2 | 42.2 | 36.6 | 51.7 |
| POR=96 YRS | 32.8 | 38.0 | 44.9 | 51.3 | 58.4 | 65.5 | 73.1 | 71.4 | 63.2 | 52.5 | 41.4 | 35.1 | 52.3 |
REFERENCE NOTES:
PAGE 1:
THE TEMPERATURE GRAPH SHOWS NORMAL MAXIMUM AND NORMAL MINIMUM DAILY TEMPERATURES (SOLID CURVES) AND THE ACTUAL DAILY HIGH AND LOW TEMPERATURES (VERTICAL BARS).
PAGE 2 AND 3:
H/C INDICATES HEATING AND COOLING DEGREE DAYS.
RH INDICATES RELATIVE HUMIDITY
W/O INDICATES WEATHER AND OBSTRUCTIONS
S INDICATES SUNSHINE.
PR INDICATES PRESSURE.
CLOUDINESS ON PAGE 3 IS THE SUM OF THE CEILOMETER AND SATELLITE DATA NOT TO EXCEED EIGHT EIGHTHS (OKTAS).
GENERAL:
T INDICATES TRACE PRECIPITATION, AN AMOUNT GREATER THAN ZERO BUT LESS THAN THE LOWEST REPORTABLE VALUE.
+ INDICATES THE VALUE ALSO OCCURS ON EARLIER DATES.
BLANK ENTRIES DENOTE MISSING OR UNREPORTED DATA.
NORMALS ARE 30–YEAR AVERAGES (1961–1990).
ASOS INDICATES AUTOMATED SURFACE OBSERVING SYSTEM.
PM INDICATES THE LAST DAY OF THE PREVIOUS MONTH.
POR (PERIOD OF RECORD) BEGINS WITH THE JANUARY DATA MONTH AND IS THE NUMBER OF YEARS USED TO COMPUTE THE MEAN. INDIVIDUAL MONTHS WITHIN THE POR MAY BE MISSING.
WHEN THE POR FOR A NORMAL IS LESS THAN 30 YEARS, THE NORMAL IS PROVISIONAL AND IS BASED ON THE NUMBER OF YEARS INDICATED.
0.* OR * INDICATES THE VALUE OR MEAN–DAYS–WITH IS BETWEEN 0.00 AND 0.05.
CLOUDINESS FOR ASOS STATIONS DIFFERS FROM THE NON–ASOS OBSERVATION TAKEN BY A HUMAN OBSERVER. ASOS STATION CLOUDINESS IS BASED ON TIME–AVERAGED CEILOMETER DATA FOR CLOUDS AT OR BELOW 12,000 FEET AND ON SATELLITE DATA FOR CLOUDS ABOVE 12,000 FEET.
THE NUMBER OF DAYS WITH CLEAR, PARTLY CLOUDY, AND CLOUDY CONDITIONS FOR ASOS STATIONS IS THE SUM OF THE CEILOMETER AND SATELLITE DATA FOR THE SUNRISE TO SUNSET PERIOD.
GENERAL CONTINUED:
CLEAR INDICATES 0–2 OKTAS, PARTLY CLOUDY INDICATES 3–6 OKTAS, AND CLOUDY INDICATES 7 OR 8 OKTAS. WHEN AT LEAST ONE OF THE ELEMENTS (CEILOMETER OR SATELLITE) IS MISSING, THE DAILY CLOUDINESS IS NOT COMPUTED.
WIND DIRECTION IS RECORDED IN TENS OF DEGREES (2 DIGITS) CLOCKWISE FROM TRUE NORTH. "00" INDICATES CALM. "36" INDICATES TRUE NORTH.
RESULTANT WIND IS THE VECTOR AVERAGE OF THE SPEED AND DIRECTION.
AVERAGE TEMPERATURE IS THE SUM OF THE MEAN DAILY MAXIMUM AND MINIMUM TEMPERATURE DIVIDED BY 2.
SNOWFALL DATA COMPRISE ALL FORMS OF FROZEN PRECIPITATION, INCLUDING HAIL.
A HEATING (COOLING) DEGREE DAY IS THE DIFFERENCE BETWEEN THE AVERAGE DAILY TEMPERATURE AND 65 F.
DRY BULB IS THE TEMPERATURE OF THE AMBIENT AIR.
DEW POINT IS THE TEMPERATURE TO WHICH THE AIR MUST BE COOLED TO ACHIEVE 100 PERCENT RELATIVE HUMIDITY.
WET BULB IS THE TEMPERATURE THE AIR WOULD HAVE IF THE MOISTURE CONTENT WAS INCREASED TO 100 PERCENT RELATIVE HUMIDITY.
ON JULY 1, 1996, THE NATIONAL WEATHER SERVICE BEGAN USING THE "METAR" OBSERVATION CODE THAT WAS ALREADY EMPLOYED BY MOST OTHER NATIONS OF THE WORLD. THE MOST NOTICEABLE DIFFERENCE IN THIS ANNUAL PUBLICATION WILL BE THE CHANGE IN UNITS FROM TENTHS TO EIGHTS (OKTAS) FOR REPORTING THE AMOUNT OF SKY COVER.
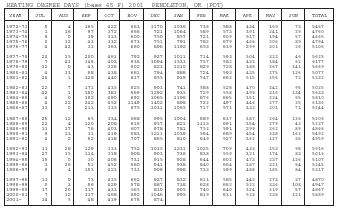
| HEATING DEGREE DAYS (base 65 F) 2001 PENDLETON, OR (PDT) | |||||||||||||
| YEAR | JUL | AUG | SEP | OCT | NOV | DEC | JAN | FEB | MAR | APR | MAY | JUN | TOTAL |
| 1972-73 | 5 | 4 | 165 | 422 | 663 | 1170 | 1036 | 738 | 588 | 434 | 169 | 73 | 5467 |
| 1973-74 | 1 | 16 | 97 | 372 | 666 | 721 | 1064 | 589 | 573 | 391 | 241 | 29 | 4760 |
| 1974-75 | 8 | 0 | 39 | 313 | 600 | 750 | 857 | 721 | 609 | 517 | 194 | 57 | 4665 |
| 1975-76 | 0 | 12 | 43 | 332 | 673 | 751 | 791 | 782 | 679 | 436 | 206 | 89 | 4794 |
| 1976-77 | 4 | 42 | 31 | 363 | 660 | 896 | 1192 | 653 | 639 | 299 | 301 | 26 | 5106 |
| 1977-78 | 20 | 35 | 200 | 461 | 792 | 927 | 1011 | 714 | 593 | 504 | 322 | 46 | 5625 |
| 1978-79 | 7 | 41 | 146 | 403 | 936 | 1094 | 1533 | 757 | 582 | 432 | 184 | 62 | 6177 |
| 1979-80 | 12 | 0 | 43 | 326 | 902 | 823 | 1210 | 829 | 728 | 388 | 267 | 141 | 5669 |
| 1980-81 | 4 | 33 | 88 | 438 | 681 | 794 | 886 | 724 | 593 | 435 | 275 | 126 | 5077 |
| 1981-82 | 20 | 1 | 128 | 440 | 617 | 855 | 919 | 747 | 662 | 515 | 256 | 72 | 5232 |
| 1982-83 | 22 | 7 | 171 | 435 | 825 | 901 | 741 | 588 | 528 | 470 | 242 | 95 | 5025 |
| 1983-84 | 42 | 1 | 180 | 381 | 569 | 1292 | 935 | 729 | 558 | 496 | 316 | 134 | 5633 |
| 1984-85 | 4 | 0 | 182 | 490 | 692 | 1065 | 1196 | 876 | 665 | 351 | 224 | 65 | 5810 |
| 1985-86 | 4 | 22 | 242 | 452 | 1149 | 1402 | 898 | 722 | 497 | 446 | 277 | 25 | 6136 |
| 1986-87 | 33 | 0 | 213 | 335 | 675 | 1031 | 1065 | 717 | 571 | 332 | 201 | 71 | 5244 |
| 1987-88 | 25 | 12 | 65 | 334 | 668 | 995 | 1004 | 689 | 637 | 387 | 264 | 126 | 5206 |
| 1988-89 | 22 | 4 | 120 | 208 | 616 | 957 | 821 | 1113 | 691 | 354 | 279 | 42 | 5227 |
| 1989-90 | 11 | 17 | 76 | 403 | 607 | 978 | 781 | 752 | 591 | 299 | 262 | 89 | 4866 |
| 1990-91 | 9 | 13 | 11 | 419 | 583 | 1211 | 1039 | 564 | 689 | 454 | 338 | 162 | 5492 |
| 1991-92 | 4 | 2 | 52 | 418 | 707 | 865 | 810 | 649 | 527 | 362 | 127 | 36 | 4559 |
| 1992-93 | 11 | 28 | 129 | 333 | 752 | 1015 | 1231 | 1025 | 709 | 432 | 153 | 98 | 5916 |
| 1993-94 | 27 | 35 | 114 | 318 | 908 | 903 | 736 | 838 | 559 | 321 | 174 | 83 | 5016 |
| 1994-95 | 15 | 0 | 30 | 406 | 731 | 915 | 928 | 644 | 602 | 473 | 237 | 126 | 5107 |
| 1995-96 | 1 | 26 | 51 | 452 | 560 | 941 | 938 | 840 | 664 | 387 | 321 | 64 | 5245 |
| 1996-97 | 8 | 4 | 153 | 423 | 733 | 909 | 998 | 733 | 599 | 488 | 185 | 84 | 5317 |
| 1997-98 | 13 | 0 | 73 | 415 | 662 | 927 | 832 | 611 | 585 | 442 | 273 | 37 | 4870 |
| 1998-99 | 0 | 3 | 56 | 429 | 578 | 887 | 738 | 628 | 662 | 522 | 336 | 108 | 4947 |
| 1999-00 | 17 | 20 | 117 | 433 | 565 | 830 | 905 | 740 | 640 | 324 | 219 | 57 | 4867 |
| 2000-01 | 7 | 12 | 137 | 468 | 892 | 1046 | 995 | 819 | 631 | 523 | 238 | 121 | 5889 |
| 2001- | 14 | 5 | 48 | 419 | 676 | 874 | |||||||

| COOLING DEGREE DAYS (base 65 F) 2001 PENDLETON, OR (PDT) | |||||||||||||
| YEAR | JAN | FEB | MAR | APR | MAY | JUN | JUL | AUG | SEP | OCT | NOV | DEC | ANNUAL |
| 1972 | 0 | 0 | 0 | 0 | 50 | 134 | 314 | 358 | 55 | 0 | 0 | 0 | 911 |
| 1973 | 0 | 0 | 0 | 0 | 63 | 137 | 327 | 232 | 72 | 0 | 0 | 0 | 831 |
| 1974 | 0 | 0 | 0 | 0 | 9 | 219 | 272 | 332 | 122 | 4 | 0 | 0 | 958 |
| 1975 | 0 | 0 | 0 | 0 | 27 | 88 | 423 | 179 | 109 | 8 | 0 | 0 | 834 |
| 1976 | 0 | 0 | 0 | 0 | 20 | 53 | 270 | 129 | 103 | 3 | 0 | 0 | 578 |
| 1977 | 0 | 0 | 0 | 16 | 3 | 152 | 190 | 348 | 16 | 0 | 0 | 0 | 725 |
| 1978 | 0 | 0 | 0 | 0 | 1 | 93 | 236 | 182 | 16 | 0 | 0 | 0 | 528 |
| 1979 | 0 | 0 | 0 | 0 | 21 | 114 | 261 | 186 | 65 | 3 | 0 | 0 | 650 |
| 1980 | 0 | 0 | 0 | 2 | 5 | 13 | 232 | 101 | 44 | 20 | 0 | 0 | 417 |
| 1981 | 0 | 0 | 0 | 4 | 2 | 28 | 155 | 297 | 101 | 0 | 0 | 0 | 587 |
| 1982 | 0 | 0 | 0 | 0 | 7 | 158 | 219 | 215 | 47 | 0 | 0 | 0 | 646 |
| 1983 | 0 | 0 | 0 | 0 | 60 | 32 | 155 | 246 | 6 | 0 | 0 | 0 | 499 |
| 1984 | 0 | 0 | 0 | 0 | 7 | 55 | 256 | 231 | 51 | 3 | 0 | 0 | 603 |
| 1985 | 0 | 0 | 0 | 0 | 28 | 91 | 394 | 127 | 7 | 0 | 0 | 0 | 647 |
| 1986 | 0 | 0 | 0 | 2 | 88 | 184 | 121 | 341 | 35 | 1 | 0 | 0 | 772 |
| 1987 | 0 | 0 | 0 | 8 | 41 | 145 | 152 | 194 | 108 | 4 | 0 | 0 | 652 |
| 1988 | 0 | 0 | 0 | 0 | 16 | 98 | 246 | 164 | 78 | 9 | 0 | 0 | 611 |
| 1989 | 0 | 0 | 0 | 0 | 5 | 76 | 182 | 143 | 41 | 0 | 0 | 0 | 447 |
| 1990 | 0 | 0 | 0 | 0 | 4 | 92 | 330 | 245 | 114 | 3 | 0 | 0 | 788 |
| 1991 | 0 | 0 | 0 | 0 | 0 | 8 | 214 | 267 | 56 | 9 | 0 | 0 | 554 |
| 1992 | 0 | 0 | 0 | 1 | 52 | 204 | 229 | 275 | 45 | 4 | 0 | 0 | 810 |
| 1993 | 0 | 0 | 0 | 0 | 59 | 42 | 47 | 136 | 99 | 4 | 0 | 0 | 387 |
| 1994 | 0 | 0 | 0 | 8 | 29 | 72 | 341 | 214 | 103 | 0 | 0 | 0 | 767 |
| 1995 | 0 | 0 | 0 | 0 | 17 | 44 | 230 | 108 | 89 | 0 | 0 | 0 | 488 |
| 1996 | 0 | 0 | 0 | 0 | 0 | 42 | 312 | 230 | 39 | 0 | 0 | 0 | 623 |
| 1997 | 0 | 0 | 0 | 0 | 31 | 34 | 191 | 258 | 79 | 5 | 0 | 0 | 598 |
| 1998 | 0 | 0 | 0 | 6 | 5 | 56 | 390 | 309 | 144 | 0 | 0 | 0 | 910 |
| 1999 | 0 | 0 | 0 | 0 | 7 | 78 | 180 | 260 | 50 | 0 | 5 | 0 | 580 |
| 2000 | 0 | 0 | 0 | 0 | 17 | 89 | 215 | 196 | 40 | 0 | 0 | 0 | 557 |
| 2001 | 0 | 0 | 0 | 0 | 48 | 43 | 193 | 265 | 93 | 0 | 0 | 0 | 642 |
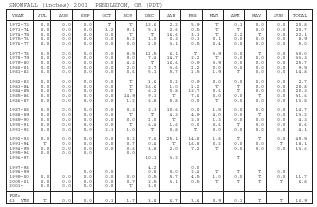
| SNOWFALL (inches) 2001 PENDLETON, OR (PDT) | |||||||||||||
| YEAR | JUL | AUG | SEP | OCT | NOV | DEC | JAN | FEB | MAR | APR | MAY | JUN | TOTAL |
| 1972-73 | 0.0 | 0.0 | 0.0 | T | T | 12.6 | 2.2 | 5.9 | T | 0.1 | 0.0 | 0.0 | 20.8 |
| 1973-74 | 0.0 | 0.0 | 0.0 | 3.2 | 9.1 | 5.3 | 2.6 | 0.5 | T | T | 0.0 | 0.0 | 20.7 |
| 1974-75 | 0.0 | 0.0 | 0.0 | 0.0 | T | T | 16.6 | 3.3 | T | 2.2 | T | 0.0 | 22.1 |
| 1975-76 | 0.0 | 0.0 | 0.0 | 0.0 | 5.2 | 3.0 | 0.3 | 0.3 | 0.1 | 0.0 | 0.0 | 0.0 | 8.9 |
| 1976-77 | 0.0 | 0.0 | 0.0 | 0.0 | 0.0 | 1.0 | 3.1 | 0.5 | 0.4 | 0.0 | 0.0 | 0.0 | 5.0 |
| 1977-78 | 0.0 | 0.0 | 0.0 | 0.0 | 8.5 | 11.5 | 6.1 | T | 3.9 | 0.0 | T | 0.0 | 30.0 |
| 1978-79 | 0.0 | 0.0 | 0.0 | 0.0 | 9.0 | 7.4 | 14.7 | 2.2 | T | 0.0 | 0.0 | 0.0 | 33.3 |
| 1979-80 | 0.0 | 0.0 | 0.0 | 0.0 | 4.3 | T | 16.6 | 0.9 | 3.9 | 0.0 | 0.0 | 0.0 | 25.7 |
| 1980-81 | 0.0 | 0.0 | 0.0 | 0.0 | 2.0 | 2.7 | 3.6 | 1.2 | 0.0 | 0.0 | 0.0 | 0.0 | 9.5 |
| 1981-82 | 0.0 | 0.0 | 0.0 | 0.0 | 0.6 | 5.1 | 5.7 | 1.5 | 1.9 | T | 0.0 | 0.0 | 14.8 |
| 1982-83 | 0.0 | 0.0 | 0.0 | 0.0 | T | 1.6 | 0.2 | 0.9 | 0.0 | 0.0 | 0.0 | 0.0 | 2.7 |
| 1983-84 | 0.0 | 0.0 | 0.0 | 0.0 | T | 26.6 | 1.0 | 1.2 | T | T | 0.0 | 0.0 | 28.8 |
| 1984-85 | 0.0 | 0.0 | 0.0 | 0.0 | T | 6.2 | 0.8 | 12.7 | 0.6 | T | 0.0 | 0.0 | 20.3 |
| 1985-86 | 0.0 | 0.0 | 0.0 | 0.0 | 14.9 | 9.1 | T | 7.6 | 0.0 | 0.0 | T | 0.0 | 31.6 |
| 1986-87 | 0.0 | 0.0 | 0.0 | 0.0 | 1.2 | 6.8 | 5.8 | 0.0 | T | 0.0 | 0.0 | 0.0 | 13.8 |
| 1987-88 | 0.0 | 0.0 | 0.0 | 0.0 | 0.3 | 2.3 | 10.6 | 0.0 | 1.5 | 0.0 | 0.0 | 0.0 | 14.7 |
| 1988-89 | 0.0 | 0.0 | 0.0 | 0.0 | T | T | 4.3 | 4.9 | 4.0 | 0.0 | T | 0.0 | 13.2 |
| 1989-90 | 0.0 | 0.0 | 0.0 | 0.0 | 0.0 | 1.0 | T | 2.0 | 1.3 | 0.0 | 0.0 | 0.0 | 4.3 |
| 1990-91 | 0.0 | 0.0 | 0.0 | 0.0 | T | 6.4 | 1.6 | 0.0 | 0.6 | T | 0.0 | 0.0 | 8.6 |
| 1991-92 | 0.0 | 0.0 | 0.0 | 2.3 | 1.0 | T | 0.8 | T | 0.0 | 0.0 | 0.0 | 0.0 | 4.1 |
| 1992-93 | 0.0 | 0.0 | 0.0 | 0.0 | 0.2 | 7.6 | 25.1 | 14.8 | 1.8 | T | T | 0.0 | 49.5 |
| 1993-94 | T | 0.0 | 0.0 | 0.0 | 0.7 | 0.4 | T | 16.8 | 0.2 | 0.0 | 0.0 | T | 18.1 |
| 1994-95 | 0.0 | 0.0 | 0.0 | 0.0 | 0.6 | 3.8 | 2.0 | 7.2 | T | 0.0 | 0.0 | 0.0 | 13.6 |
| 1995-96 | 0.0 | 0.0 | 0.0 | 0.0 | |||||||||
| 1996-97 | 10.1 | 3.2 | T | ||||||||||
| 1997-98 | 4.2 | 0.0 | |||||||||||
| 1998-99 | 0.0 | 0.0 | 0.8 | 0.0 | 2.4 | T | T | T | 0.0 | ||||
| 1999-00 | 0.0 | 0.0 | 0.0 | 0.0 | 0.0 | 0.5 | 5.7 | 4.5 | 1.0 | 0.0 | T | 0.0 | 11.7 |
| 2000-01 | 0.0 | 0.0 | 0.0 | 0.0 | 0.7 | 2.5 | 3.1 | 0.5 | T | T | T | T | 6.8 |
| 2001- | 0.0 | 0.0 | 0.0 | 0.0 | T | 3.0 | |||||||
| POR=63 YRS | T | 0.0 | 0.0 | 0.1 | 1.7 | 3.8 | 6.7 | 3.6 | 0.9 | 0.1 | T | T | 16.9 |
Comment about this article, ask questions, or add new information about this topic: