2001 DENVER, COLORADO (DEN)
Denver enjoys the invigorating climate that prevails over much of the central Rocky Mountain region, without the extremely cold mornings of the high elevations during winter, or the hot afternoons of summer at lower altitudes. Extremely warm or cold weather in Denver is usually of short duration.
Situated a long distance from any moisture source, and separated from the Pacific Ocean by several high mountain barriers, Denver enjoys low relative humidity, light precipitation, and abundant sunshine.
Air masses from four different sources influence Denver weather. These include arctic air from Canada and Alaska, warm, moist air from the Gulf of Mexico, warm, dry air from Mexico and the southwestern deserts, and Pacific air modified by its passage over mountains to the west.
In winter, the high altitude and mountains to the west combine to moderate temperatures in Denver. Invasions of cold air from the north, intensified by the high altitude, can be abrupt and severe. However, many of the cold air masses that spread southward out of Canada never reach the altitude of Denver, but move off over the lower plains to the east. Surges of air from the west are moderated in their descent down the east face of the Rockies, and reach Denver in the form of chinook winds that often raise temperatures into the 60s, even in midwinter.
In spring, polar air often collides with warm, moist air from the Gulf of Mexico and these collisions result in frequent, rapid and drastic weather changes. Spring is the cloudiest, windiest, and wettest season in the city. Much of the precipitation falls as snow, especially in March and early April. Stormy periods are interspersed with stretches of mild, sunny weather that quickly melt previous snow cover.
Summer precipitation falls mainly from scattered thunderstorms during the afternoon and evening. Mornings are usually clear and sunny, with clouds forming during early afternoon to cut off the sunshine at what would otherwise be the hottest part of the day. Severe thunderstorms, with large hail and heavy rain occasionally occur in the city, but these conditions are more common on the plains to the east.
Autumn is the most pleasant season. Few thunderstorms occur and invasions of cold air are infrequent. As a result, there is more sunshine and less severe weather than at any other time of the year.
Based on the 1951–1980 period, the average first occurrence of 32 degrees Fahrenheit in the fall is October 8 and the average last occurrence in the spring is May 3.
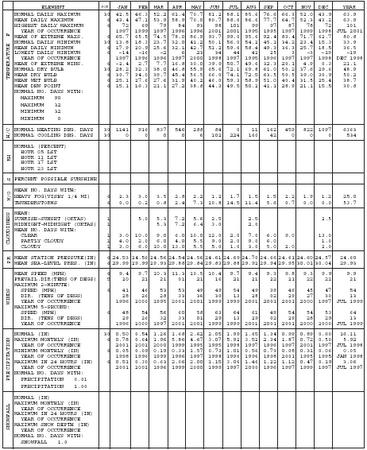
NORMALS, MEANS, AND EXTREMES
DENVER, CO (DEN)
LATITUDE: LONGITUDE: ELEVATION (FT): TIME ZONE: WBAN: 03017
39 49′ 58″ N 104 39′ 27″ W GRND: 5379 BARO: 5382 MOUNTAIN (UTC + 7)
| ELEMENT | POR | JAN | FEB | MAR | APR | MAY | JUN | JUL | AUG | SEP | OCT | NOV | DEC | YEAR | |
| TEMPERATURE F | NORMAL DAILY MAXIMUM | 30 | 42.5 | 46.3 | 52.2 | 61.4 | 70.7 | 81.2 | 88.1 | 85.6 | 76.6 | 66.3 | 52.0 | 43.9 | 63.9 |
| MEAN DAILY MAXIMUM | 6 | 43.4 | 47.1 | 53.9 | 58.9 | 70.0 | 80.7 | 88.6 | 86.6 | 77.7 | 64.7 | 52.3 | 43.2 | 63.9 | |
| HIGHEST DAILY MAXIMUM | 6 | 72 | 69 | 79 | 84 | 93 | 98 | 101 | 99 | 97 | 87 | 78 | 72 | 101 | |
| YEAR OF OCCURRENCE | 1997 | 1999 | 1997 | 1996 | 1996 | 2001 | 2001 | 1995 | 1995 | 1997 | 1999 | 1998 | JUL 2001 | ||
| MEAN OF EXTREME MAXS. | 6 | 65.7 | 65.5 | 74.5 | 78.0 | 86.9 | 93.7 | 99.0 | 95.6 | 92.4 | 83.4 | 71.7 | 62.7 | 80.8 | |
| NORMAL DAILY MINIMUM | 30 | 13.8 | 18.3 | 23.7 | 32.0 | 41.2 | 50.1 | 56.0 | 54.2 | 45.1 | 34.2 | 23.4 | 15.3 | 33.9 | |
| MEAN DAILY MINIMUM | 6 | 17.9 | 20.9 | 25.6 | 32.1 | 42.7 | 51.2 | 59.6 | 58.4 | 49.3 | 36.3 | 25.7 | 18.5 | 36.5 | |
| LOWEST DAILY MINIMUM | 6 | -14 | -16 | -2 | 6 | 23 | 34 | 44 | 42 | 25 | 3 | -3 | -19 | -19 | |
| YEAR OF OCCURRENCE | 1997 | 1996 | 1996 | 1997 | 2000 | 1998 | 1997 | 1995 | 1996 | 1997 | 1997 | 1998 | DEC 1998 | ||
| MEAN OF EXTREME MINS. | 6 | -2.4 | 2.7 | 7.7 | 16.8 | 30.0 | 39.9 | 50.7 | 49.6 | 32.3 | 20.1 | 4.9 | 0.3 | 21.1 | |
| NORMAL DRY BULB | 30 | 28.2 | 32.3 | 38.0 | 46.8 | 55.9 | 65.6 | 72.1 | 69.8 | 61.0 | 50.2 | 37.6 | 29.6 | 48.9 | |
| MEAN DRY BULB | 6 | 30.7 | 34.0 | 39.7 | 45.4 | 56.5 | 66.0 | 74.1 | 72.5 | 63.5 | 50.5 | 39.0 | 30.9 | 50.2 | |
| MEAN WET BULB | 6 | 25.1 | 27.6 | 27.6 | 31.9 | 40.2 | 46.0 | 59.3 | 58.9 | 51.0 | 40.4 | 31.5 | 25.4 | 38.7 | |
| MEAN DEW POINT | 6 | 15.1 | 16.3 | 21.1 | 27.2 | 38.8 | 44.3 | 49.5 | 50.2 | 41.1 | 28.9 | 21.1 | 15.5 | 30.8 | |
| NORMAL NO. DAYS WITH: | |||||||||||||||
| MAXIMUM 90 | |||||||||||||||
| MAXIMUM 32 | |||||||||||||||
| MINIMUM 32 | |||||||||||||||
| MINIMUM 0 | |||||||||||||||
| H/C | NORMAL HEATING DEG. DAYS | 30 | 1141 | 916 | 837 | 546 | 288 | 84 | 0 | 11 | 162 | 459 | 822 | 1097 | 6363 |
| NORMAL COOLING DEG. DAYS | 30 | 0 | 0 | 0 | 0 | 6 | 102 | 224 | 160 | 42 | 0 | 0 | 0 | 534 | |
| RH | NORMAL (PERCENT) | ||||||||||||||
| HOUR 05 LST | |||||||||||||||
| HOUR 11 LST | |||||||||||||||
| HOUR 17 LST | |||||||||||||||
| HOUR 23 LST | |||||||||||||||
| S | PERCENT POSSIBLE SUNSHINE | ||||||||||||||
| W/O | MEAN NO. DAYS WITH: | ||||||||||||||
| HEAVY FOG (VISBY 1/4 MI) | 6 | 2.3 | 3.0 | 3.5 | 2.8 | 2.2 | 1.2 | 1.7 | 1.5 | 1.5 | 2.2 | 1.9 | 1.2 | 25.0 | |
| THUNDERSTORMS | 6 | 0.0 | 0.2 | 0.8 | 2.4 | 7.3 | 10.8 | 14.5 | 11.4 | 5.6 | 0.7 | 0.0 | 0.0 | 53.7 | |
| CLOUDINESS | MEAN: | ||||||||||||||
| SUNRISE-SUNSET (OKTAS) | 1 | 5.0 | 5.3 | 7.2 | 5.6 | 2.5 | 2.5 | 2.5 | |||||||
| MIDNIGHT-MIDNIGHT (OKTAS) | 1 | 5.3 | 7.2 | 6.4 | 3.0 | 2.0 | |||||||||
| MEAN NO. DAYS WITH: | |||||||||||||||
| CLEAR | 1 | 3.0 | 10.0 | 9.0 | 6.0 | 10.0 | 12.0 | 2.0 | 7.0 | 6.0 | 9.0 | 13.0 | |||
| PARTLY CLOUDY | 1 | 4.0 | 2.0 | 6.0 | 4.0 | 5.5 | 9.0 | 2.0 | 9.0 | 6.0 | 1.0 | ||||
| CLOUDY | 1 | 3.0 | 6.0 | 10.0 | 13.0 | 5.5 | 5.0 | 1.0 | 3.0 | 5.0 | 2.0 | 2.0 | |||
| PR | MEAN STATION PRESSURE (IN) | 6 | 24.53 | 24.56 | 24.56 | 24.54 | 24.56 | 24.61 | 24.69 | 24.70 | 24.66 | 24.61 | 24.60 | 24.57 | 24.60 |
| MEAN SEA-LEVEL PRES. (IN) | 6 | 29.99 | 29.99 | 29.93 | 29.88 | 29.84 | 29.83 | 29.88 | 29.92 | 29.94 | 29.95 | 30.01 | 30.04 | 29.93 | |
| WINDS | MEAN SPEED (MPH) | 6 | 9.4 | 9.7 | 10.3 | 11.3 | 10.5 | 10.4 | 9.7 | 9.4 | 9.3 | 9.8 | 9.3 | 9.9 | 9.9 |
| PREVAIL. DIR (TENS OF DEGS) | 5 | 20 | 21 | 21 | 01 | 21 | 16 | 21 | 21 | 22 | 21 | 22 | 21 | 21 | |
| MAXIMUM 2-MINUTE: | |||||||||||||||
| SPEED (MPH) | 6 | 41 | 46 | 53 | 53 | 49 | 49 | 54 | 49 | 39 | 46 | 45 | 47 | 54 | |
| DIR. (TENS OF DEGS) | 28 | 26 | 28 | 33 | 36 | 30 | 13 | 28 | 02 | 29 | 27 | 30 | 13 | ||
| YEAR OF OCCURRENCE | 1996 | 2000 | 1995 | 2001 | 2001 | 1999 | 1999 | 2001 | 2001 | 2001 | 2000 | 1997 | JUL 1999 | ||
| MAXIMUM 5-SECOND: | |||||||||||||||
| SPEED (MPH) | 6 | 48 | 54 | 56 | 60 | 58 | 63 | 64 | 61 | 49 | 54 | 54 | 53 | 64 | |
| DIR. (TENS OF DEGS) | 29 | 26 | 32 | 33 | 01 | 29 | 13 | 29 | 02 | 29 | 28 | 29 | 13 | ||
| YEAR OF OCCURRENCE | 1996 | 2000 | 1997 | 2001 | 2001 | 1999 | 1999 | 2001 | 2001 | 2001 | 2000 | 2000 | JUL 1999 | ||
| PRECIPITATION | NORMAL (IN) | 30 | 0.50 | 0.54 | 1.26 | 1.68 | 2.62 | 2.05 | 1.99 | 1.65 | 1.34 | 0.99 | 0.89 | 0.60 | 16.11 |
| MAXIMUM MONTHLY (IN) | 6 | 0.78 | 0.64 | 1.96 | 5.86 | 4.67 | 3.07 | 5.92 | 3.52 | 2.34 | 1.87 | 0.72 | 0.50 | 5.92 | |
| YEAR OF OCCURRENCE | 2001 | 2001 | 2000 | 1999 | 1995 | 1995 | 1998 | 1997 | 1996 | 1997 | 2001 | 1997 | JUL 1998 | ||
| MINIMUM MONTHLY (IN) | 6 | 0.05 | 0.09 | 0.19 | 0.33 | 1.57 | 0.73 | 1.01 | 0.56 | 0.73 | 0.08 | 0.31 | 0.06 | 0.05 | |
| YEAR OF OCCURRENCE | 1998 | 1996 | 1999 | 1996 | 1997 | 1998 | 1996 | 1996 | 1998 | 2001 | 1995 | 1995 | JAN 1998 | ||
| MAXIMUM IN 24 HOURS (IN) | 6 | 0.51 | 0.30 | 0.63 | 2.06 | 2.00 | 1.15 | 3.06 | 1.46 | 1.22 | 1.12 | 0.47 | 0.19 | 3.06 | |
| YEAR OF OCCURRENCE | 2001 | 2001 | 1996 | 1999 | 2000 | 1999 | 1997 | 2000 | 1996 | 1997 | 1999 | 1997 | JUL 1997 | ||
| NORMAL NO. DAYS WITH: | |||||||||||||||
| PRECIPITATION 0.01 | |||||||||||||||
| PRECIPITATION 1.00 | |||||||||||||||
| SNOWFALL | NORMAL (IN) | ||||||||||||||
| MAXIMUM MONTHLY (IN) | |||||||||||||||
| YEAR OF OCCURRENCE | |||||||||||||||
| MAXIMUM IN 24 HOURS (IN) | |||||||||||||||
| YEAR OF OCCURRENCE | |||||||||||||||
| MAXIMUM SNOW DEPTH (IN) | |||||||||||||||
| YEAR OF OCCURRENCE | |||||||||||||||
| NORMAL NO. DAYS WITH: | |||||||||||||||
| SNOWFALL 1.0 |
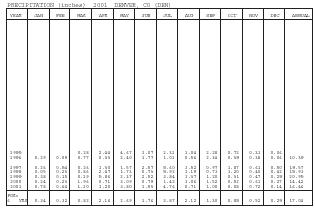
| PRECIPITATION (inches) 2001 DENVER, CO (DEN) | |||||||||||||
| YEAR | JAN | FEB | MAR | APR | MAY | JUN | JUL | AUG | SEP | OCT | NOV | DEC | ANNUAL |
| 1995 | 0.28 | 2.44 | 4.67 | 3.07 | 2.31 | 1.04 | 2.28 | 0.72 | 0.31 | 0.06 | |||
| 1996 | 0.29 | 0.09 | 0.77 | 0.33 | 2.40 | 1.77 | 1.01 | 0.56 | 2.34 | 0.39 | 0.38 | 0.06 | 10.39 |
| 1997 | 0.26 | 0.54 | 0.26 | 1.30 | 1.57 | 2.57 | 5.60 | 3.52 | 0.97 | 1.87 | 0.61 | 0.50 | 19.57 |
| 1998 | 0.05 | 0.23 | 0.86 | 2.47 | 1.73 | 0.73 | 5.92 | 1.19 | 0.73 | 1.20 | 0.40 | 0.42 | 15.93 |
| 1999 | 0.38 | 0.15 | 0.19 | 5.86 | 2.37 | 2.52 | 3.84 | 3.37 | 1.20 | 0.31 | 0.47 | 0.29 | 20.95 |
| 2000 | 0.24 | 0.23 | 1.96 | 0.71 | 3.09 | 0.79 | 1.42 | 3.06 | 1.52 | 0.52 | 0.61 | 0.27 | 14.42 |
| 2001 | 0.78 | 0.64 | 1.10 | 1.20 | 3.80 | 1.53 | 4.76 | 0.71 | 1.00 | 0.08 | 0.72 | 0.14 | 16.46 |
| POR=6 YRS | 0.34 | 0.32 | 0.82 | 2.16 | 2.69 | 1.76 | 3.87 | 2.12 | 1.30 | 0.85 | 0.52 | 0.29 | 17.04 |
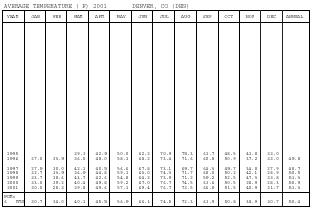
| AVERAGE TEMPERATURE (F) 2001 DENVER, (DEN) | |||||||||||||
| YEAR | JAN | FEB | MAR | APR | MAY | JUN | JUL | AUG | SEP | OCT | NOV | DEC | ANNUAL |
| 1995 | 39.3 | 42.9 | 50.0 | 62.2 | 70.9 | 75.3 | 61.7 | 48.5 | 41.8 | 33.0 | |||
| 1996 | 27.0 | 33.9 | 36.0 | 48.0 | 58.1 | 68.2 | 73.4 | 71.6 | 60.8 | 50.9 | 37.2 | 33.0 | 49.8 |
| 1997 | 27.9 | 30.0 | 42.1 | 40.5 | 56.6 | 67.8 | 73.1 | 69.7 | 64.3 | 49.7 | 34.8 | 27.9 | 48.7 |
| 1998 | 32.7 | 33.9 | 36.9 | 44.8 | 59.1 | 63.0 | 74.3 | 71.7 | 68.0 | 50.2 | 42.1 | 28.9 | 50.5 |
| 1999 | 33.7 | 38.6 | 43.7 | 42.6 | 54.8 | 64.2 | 73.9 | 71.2 | 59.2 | 52.5 | 47.3 | 33.8 | 51.3 |
| 2000 | 33.0 | 39.2 | 40.4 | 49.8 | 59.2 | 67.0 | 76.7 | 74.5 | 63.6 | 50.5 | 28.9 | 28.3 | 50.9 |
| 2001 | 30.0 | 28.3 | 39.8 | 49.6 | 57.1 | 69.4 | 76.7 | 73.5 | 66.8 | 51.5 | 40.9 | 31.7 | 51.3 |
| POR=6 YRS | 30.7 | 34.0 | 40.1 | 45.5 | 56.9 | 66.1 | 74.5 | 72.3 | 63.9 | 50.8 | 38.9 | 30.7 | 50.4 |
REFERENCE NOTES:
PAGE 1:
THE TEMPERATURE GRAPH SHOWS NORMAL MAXIMUM AND NORMAL MINIMUM DAILY TEMPERATURES (SOLID CURVES) AND THE ACTUAL DAILY HIGH AND LOW TEMPERATURES (VERTICAL BARS).
PAGE 2 AND 3:
H/C INDICATES HEATING AND COOLING DEGREE DAYS.
RH INDICATES RELATIVE HUMIDITY
W/O INDICATES WEATHER AND OBSTRUCTIONS
S INDICATES SUNSHINE.
PR INDICATES PRESSURE.
CLOUDINESS ON PAGE 3 IS THE SUM OF THE CEILOMETER AND SATELLITE DATA NOT TO EXCEED EIGHT EIGHTHS (OKTAS).
GENERAL:
T INDICATES TRACE PRECIPITATION, AN AMOUNT GREATER THAN ZERO BUT LESS THAN THE LOWEST REPORTABLE VALUE.
+ INDICATES THE VALUE ALSO OCCURS ON EARLIER DATES.
BLANK ENTRIES DENOTE MISSING OR UNREPORTED DATA.
NORMALS ARE 30–YEAR AVERAGES (1961–1990).
ASOS INDICATES AUTOMATED SURFACE OBSERVING SYSTEM.
PM INDICATES THE LAST DAY OF THE PREVIOUS MONTH.
POR (PERIOD OF RECORD) BEGINS WITH THE JANUARY DATA MONTH AND IS THE NUMBER OF YEARS USED TO COMPUTE THE MEAN. INDIVIDUAL MONTHS WITHIN THE POR MAY BE MISSING.
WHEN THE POR FOR A NORMAL IS LESS THAN 30 YEARS, THE NORMAL IS PROVISIONAL AND IS BASED ON THE NUMBER OF YEARS INDICATED.
0.* OR * INDICATES THE VALUE OR MEAN–DAYS–WITH IS BETWEEN 0.00 AND 0.05.
CLOUDINESS FOR ASOS STATIONS DIFFERS FROM THE NON–ASOS OBSERVATION TAKEN BY A HUMAN OBSERVER. ASOS STATION CLOUDINESS IS BASED ON TIME–AVERAGED CEILOMETER DATA FOR CLOUDS AT OR BELOW 12,000 FEET AND ON SATELLITE DATA FOR CLOUDS ABOVE 12,000 FEET.
THE NUMBER OF DAYS WITH CLEAR, PARTLY CLOUDY, AND CLOUDY CONDITIONS FOR ASOS STATIONS IS THE SUM OF THE CEILOMETER AND SATELLITE DATA FOR THE SUNRISE TO SUNSET PERIOD.
GENERAL CONTINUED:
CLEAR INDICATES 0–2 OKTAS, PARTLY CLOUDY INDICATES 3–6 OKTAS, AND CLOUDY INDICATES 7 OR 8 OKTAS. WHEN AT LEAST ONE OF THE ELEMENTS (CEILOMETER OR SATELLITE) IS MISSING, THE DAILY CLOUDINESS IS NOT COMPUTED.
WIND DIRECTION IS RECORDED IN TENS OF DEGREES (2 DIGITS) CLOCKWISE FROM TRUE NORTH. "00" INDICATES CALM. "36" INDICATES TRUE NORTH.
RESULTANT WIND IS THE VECTOR AVERAGE OF THE SPEED AND DIRECTION.
AVERAGE TEMPERATURE IS THE SUM OF THE MEAN DAILY MAXIMUM AND MINIMUM TEMPERATURE DIVIDED BY 2.
SNOWFALL DATA COMPRISE ALL FORMS OF FROZEN PRECIPITATION, INCLUDING HAIL.
A HEATING (COOLING) DEGREE DAY IS THE DIFFERENCE BETWEEN THE AVERAGE DAILY TEMPERATURE AND 65 F.
DRY BULB IS THE TEMPERATURE OF THE AMBIENT AIR.
DEW POINT IS THE TEMPERATURE TO WHICH THE AIR MUST BE COOLED TO ACHIEVE 100 PERCENT RELATIVE HUMIDITY.
WET BULB IS THE TEMPERATURE THE AIR WOULD HAVE IF THE MOISTURE CONTENT WAS INCREASED TO 100 PERCENT RELATIVE HUMIDITY.
ON JULY 1, 1996, THE NATIONAL WEATHER SERVICE BEGAN USING THE "METAR" OBSERVATION CODE THAT WAS ALREADY EMPLOYED BY MOST OTHER NATIONS OF THE WORLD. THE MOST NOTICEABLE DIFFERENCE IN THIS ANNUAL PUBLICATION WILL BE THE CHANGE IN UNITS FROM TENTHS TO EIGHTS (OKTAS) FOR REPORTING THE AMOUNT OF SKY COVER.
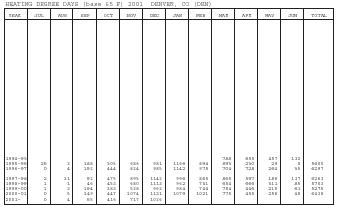
| HEATING DEGREE DAYS (base 65 F) 2001 DENVER, CO (DEN) | |||||||||||||
| YEAR | JUL | AUG | SEP | OCT | NOV | DEC | JAN | FEB | MAR | APR | MAY | JUN | TOTAL |
| 1994-95 | 788 | 655 | 457 | 132 | |||||||||
| 1995-96 | 26 | 2 | 188 | 505 | 686 | 981 | 1166 | 894 | 893 | 230 | 29 | 0 | 5600 |
| 1996-97 | 0 | 4 | 192 | 444 | 824 | 985 | 1142 | 975 | 704 | 728 | 264 | 35 | 6297 |
| 1997-98 | 2 | 11 | 92 | 475 | 895 | 1142 | 996 | 865 | 865 | 597 | 186 | 137 | 6263 |
| 1998-99 | 1 | 1 | 46 | 453 | 680 | 1113 | 962 | 731 | 654 | 666 | 311 | 85 | 5703 |
| 1999-00 | 1 | 3 | 194 | 383 | 528 | 962 | 984 | 744 | 754 | 446 | 215 | 61 | 5275 |
| 2000-01 | 0 | 5 | 149 | 447 | 1074 | 1131 | 1079 | 1021 | 775 | 455 | 256 | 46 | 6438 |
| 2001- | 0 | 4 | 65 | 416 | 717 | 1026 | |||||||
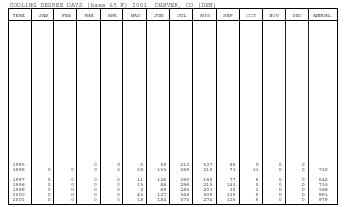
| COOLING DEGREE DAYS (base 65 F) 2001 DENVER, CO (DEN) | |||||||||||||
| YEAR | JAN | FEB | MAR | APR | MAY | JUN | JUL | AUG | SEP | OCT | NOV | DEC | ANNUAL |
| 1995 | 0 | 0 | 0 | 55 | 212 | 327 | 98 | 0 | 0 | 0 | |||
| 1996 | 0 | 0 | 0 | 3 | 26 | 133 | 269 | 215 | 71 | 13 | 0 | 0 | 730 |
| 1997 | 0 | 0 | 0 | 0 | 11 | 126 | 260 | 160 | 77 | 8 | 0 | 0 | 642 |
| 1998 | 0 | 0 | 0 | 0 | 13 | 88 | 296 | 215 | 143 | 0 | 0 | 0 | 755 |
| 1999 | 0 | 0 | 0 | 0 | 2 | 69 | 283 | 203 | 30 | 2 | 0 | 0 | 589 |
| 2000 | 0 | 0 | 0 | 0 | 43 | 127 | 368 | 305 | 115 | 5 | 0 | 0 | 963 |
| 2001 | 0 | 0 | 0 | 0 | 18 | 184 | 373 | 274 | 125 | 5 | 0 | 0 | 979 |
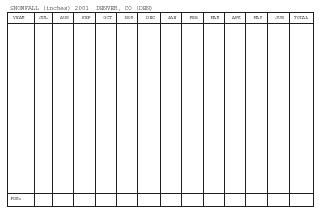
| SNOWFALL (inches) 2001 DENVER, CO (DEN) | |||||||||||||
| YEAR | JUL | AUG | SEP | OCT | NOV | DEC | JAN | FEB | MAR | APR | MAY | JUN | TOTAL |
| POR= | |||||||||||||
Comment about this article, ask questions, or add new information about this topic: