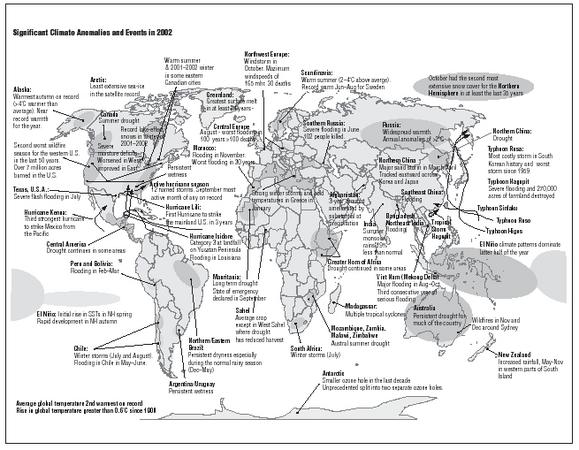
Round-the-World Weather
CLIMATES OF THE WORLD
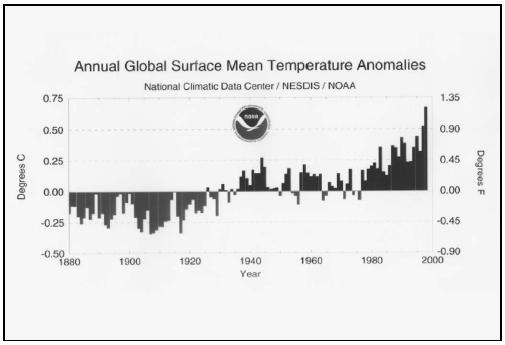
Temperature distribution
The distribution of temperature over the world and its variations through the year depend primarily on the amount of distribution of the radiant energy received from the sun in different regions. This in turn depends mainly on latitude but is greatly modified by the distribution of continents and oceans, prevailing winds, oceanic circulation, topography, and other factors.
In the winter of the Northern Hemisphere (see Average January Temperature map), the poleward temperature gradient (that is, the rate of fall in temperature) north of latitude 15° is very steep over the interior of North America. This is shown by the fact that the lines indicating changes in temperature come very close together. The temperature gradient is also steep toward the cold pole over Asia in the area marked–50°F. In western Europe, to the east of the Atlantic Ocean and the North Atlantic Drift, and in the region of prevailing westerly winds, the temperature gradient is much more gradual, as indicated by the fact that the isotherms, or lines of equal temperature, are far apart. In the winter of the Southern Hemisphere (see Average July Temperature map), the temperature gradient toward the South Pole is very gradual, and the isothermal deflections from the east-west direction (that is, the dipping of the isothermal lines) are of minor importance because continental effects are largely absent.
In the summers of the two hemispheres—July in the north and January in the south—the temperature gradients poleward are very much diminished as compared with those during the winter. This is especially marked over the middle and higher northern latitudes because of the greater warming of the extensive interiors of North America and Eurasia than of the smaller land areas in middle and higher southern latitudes.
Distribution of precipitation
Whether precipitation occurs as rain or snow or in the rarer forms of hail or sleet depends largely on the temperature climate, which may be influenced more by elevation than by latitude, as in the case of the perpetually snowcapped mountain peaks and glaciers on the equator in both South America and Africa.
Highest World Temperatures
- El Azizia, Libya (136°F)
- Death Valley, CA (134°F)
- Tirat Tsvi, Israel (129°F)
- Cloncurry, Australia (128°F)
- Seville, Spain (122°F)
Coldest World Temperatures
- Vostok, Antarctica (–129°F)
- Oimekon, Russia (–90°F)
- Northice, Greenland (–87°F)
- Snag, Yukon, Canada (–81.4°F)
- Ust'Shchugor, Russia (–67°F)
Highest Annual Precipitation
- Lloro, Columbia (523.6 in)
- Mawsynram, India (467.4 in)
- Mt. Waialeale, Kauai, Hawaii (460 in)
- Debundscha, Cameroon (405 in)
- Quibdo, Colombia (354 in)
The quantity of precipitation is governed by the amount of water vapor in the air and the nature of the process that leads to its condensation into liquid or solid form through cooling. Air may ascend to great elevations through local convection, as in thunderstorms and in tropical regions generally; it may be forced up over topographical elevations across the prevailing wind direction, as on the southern or windward slopes of the Himalayas in the path of the southwest monsoon in India; or it may ascend more or less gradually in migratory low-pressure formations such as those that govern the main features of weather in the United States.
The areas of heaviest precipitation on the map ( World Precipitation ) are generally located, as would be expected, in tropical regions, where because of high temperature the greatest amount of water vapor may be present in the atmosphere and the greatest evaporation takes place—although only where conditions favor condensation can rainfall occur. Outstanding exceptions are certain regions in high latitudes, such as southern Alaska, western Norway, and southern Chile, where relatively warm, moist winds from the sea undergo forced ascent over considerable elevations.
In marked contrast to the rainy regions just named, are the dry polar regions, where the water vapor content of the air is always very low because of the low temperature and very limited evaporation. The dry areas in the subtropical belts of high atmospheric pressure in the vicinity of latitude 30° on all continents (especially from the extreme western Sahara over a broad, somewhat broken belt to the Desert of Gobi), and the arid strips on the lee sides of mountains on whose windward slopes precipitation is heavy to excessive, are caused by conditions which, even though the temperature may be high, are unfavorable to the condensation of whatever water vapor may be present in the atmosphere.
Lowest Annual Precipitation
- Arica, Chile (0.03 in)
- Wadi Halfa, Sudan (0.1 in)
- Amundsen-Scott, South Pole Station (0.8 in)
- Batagues, Mexico (1.2 in)
- Aden, Yemen (1.8 in)
North America
North America is nearly all within middle and northern latitudes. Consequently, it has a large central area in which the continental type of climate with marked seasonal temperature is to be found. Along the coasts of northern Alaska, western Canada, and the northwestern part of the United States, moderate midsummer temperatures are in marked contrast to those prevailing in the interior east of the mountains.
Again, the mild midwinter temperatures in the coastal areas stand out against the severe conditions to be found from the Great Lakes region northward and northwestward.
In the West Indian region, temperature conditions are subtropical; and in Mexico and Central America, climatic zones depend on elevation, ranging from subtropical to temperate in the higher levels.
The prevailing westerly wind movement carries the continental type of climate eastward over the United States, so that the region of maritime climate along the Atlantic Ocean is very narrow.
From the Aleutian Peninsula to northern California west of the crests of the mountains, there is a narrow strip where annual precipitation is over 40 in; it exceeds 100 in locally on the coast of British Columbia. East of this belt there is an abrupt falloff in precipitation to less than 20 in annually over the western half of the continent from lower California northward, and to even less than 5 in in parts of what used to be called the "Great American Desert" in the southwestern part of the United States.
In the eastern part of the continent—that is, from the southeastern part of the United States northeastward to Newfoundland—the average annual precipitation is more than 40 in. Rainfall in the West Indies, southern Mexico, and Central America is generally abundant. It is very spotty, however, varying widely even within short distances, especially from the windward to the leeward sides of the mountains.
The northern areas are, of course, very cold; but the midwinter low temperatures fall far short of the records set in the cold pole area of northeastern Siberia, where the vast extent of land becomes much colder than the partly ice covered area of northern Canada.
South America
A large part of South America lies within the tropics and has a characteristically tropical climate. The remaining rather narrow southern portion is not subject to the extremes of heat and cold that are found where wide land areas give full sway to the continental type of climate with its hot summers and cold winters, as in North America and Asia. Temperature anomalies unusual for a given latitude are to be found mainly at the elevated levels of the Andean region stretching from the Isthmus of Panama to Cape Horn.
The Antarctic Current and its cool Humboldt branch skirting the western shores northward to the equator, together with the prevailing onshore winds, exert a strong cooling influence over the coastal regions of all the western countries of South America except Colombia. On the east the southerly moving Brazilian current from tropical waters has the opposite, or warming, effect except along southern Argentina.
In the northern countries of South America the sharply contrasted dry and wet seasons are related to the regime of the trade winds. In the dry season (corresponding to winter in the Northern Hemisphere) these winds sweep the entire region, while the wet season (corresponding to summer in the Northern Hemisphere) calms and variable winds prevail. In the basin of the Amazon River the rainfall is related to the equatorial belt of low pressure and to the trade winds, which give the maximum amounts of rainfall in the extreme west, where they ascend the Andean slopes.
The desert areas on the west coast of South America, extending from the equator to the latitude of Santiago, Chile, are due primarily to the cold Humboldt or Peruvian Current and upwelling coastal water. The moist, cool ocean air is warmed while passing over the land, with a consequent decrease in relative humidity, so that the dew point is not reached and condensation of vapor does not occur until the incoming air has reached high elevations in the Andes, where temperatures are much lower than along the coast.
In southern Chile the summer has moderate rainfall, and winters are excessively wet. The conditions that prevail farther north are not present here, and condensation of moisture from the ocean progresses from the shores up to the crests of the Andes. By the time the air passes these elevations, however, the moisture has been so depleted that the winds in the leeward slopes are dry, becoming more and more so as they are warmed on reaching lower levels. The mountains can be looked upon as casting a great "rain shadow"—an area of little rain—over southern Argentina.
Europe
In Europe there is no extensive north-south mountain system such as is found in both the Americas, and the general east-west direction of the ranges in the south allows the conditions in the maritime west to change rather gradually toward Asia. Generally rainfall is heaviest on the western coast, where locally it exceeds 60 in annually, and diminishes toward the east—except in the elevated Alpine and Caucasus regions—to less than 20 in in eastern Russia. There is a well-defined rain shadow in Scandinavia, with over 60 in of rain in western Norway and less than 20 in in eastern Sweden.
Over much of Europe, rainfall is both abundant and rather evenly distributed throughout the year. The chief feature of seasonal distribution of precipitation is the marked winter maximum and the extremely dry, even droughty, summers in most of the Mediterranean lands.
Isothermal lines have the general direction of the parallels of latitude except in winter, when the waters of the western ocean, warmed by the Gulf Stream, give them a north-south trend. Generally there are no marked dips in isotherms due to elevation and continental type of climate such as are found in North America. In Scandinavia, however, the winter map shows an abrupt fall in temperature from the western coast of Norway to the eastern coast of Sweden and then a continued fall eastward, under a type of exposure more and more continental in contrast to the oceanic exposure on the west.
Asia
The vast extent of Asia gives full opportunity for continental conditions to develop a cold area of high barometric pressure in winter and a low-pressure, hot area in summer, the former northeast of the Himalayas and the latter stretching widely from west to east in the latitude of northern India. These distributions of pressure give India the well-known monsoon seasons, during which the wind comes from one direction for several months, and also affect the yearly distribution of rainfall over eastern Asia.
In winter, the air circulates outward over the land from the cold pole, and precipitation is very light over the entire continent. In summer, on the contrary, there is an inflow of air from the oceans; even the southeast trade winds flow across the equator and merge into the southwest monsoon that crosses India. This usually produces abundant rain over most of that country, with excessively heavy amounts when the air is forced to rise, even to moderate elevations, in its passage over the land. At Cherrapunji (4,590 ft), on the southern side of the Khasi Hills in Assam, the average rainfall in a winter month is about 1 in, while in both June and July it is approximately 100 in. However, this heavy summer rainfall meets an impassable barrier in the Himalayas, while the much lighter summer monsoon rainfall over Japan and eastern Asia does not extend far into China because of lesser elevations. Consequently, while the southeast quadrant of Asia, including the East Indies, also with monsoon winds, has heavy to excessive annual rainfall, the remainder of the continent is dry, with vast areas receiving less than 10 in annually.
North of the Himalayas the low plains are excessively cold in winter and temperatures rise rather high in summer. At Verkhoyansk in the cold pole area, and north of the Arctic Circle, the mean temperature in January is about–59°F, and in July approximately 64°F; the extreme records are a maximum of 98°F, from readings at 1 P.M ., and a minimum of–90°F.
In southwestern Asia the winter temperature control is still the interior high-pressure area, and temperatures are generally low, especially at high elevations; in summer at low elevations excessively high maxima are recorded, as, for example, in the Tigris-Euphrates Valley.
Africa
Africa, like South America, lies very largely within the tropics. There too, temperature distribution is determined mainly by altitude. Moreover, along the southern portion of the western coast the cool Benguela Current moves northward, and on the eastern coast are the warm, tropical currents of the Indian Ocean, which create conditions closely paralleling those found around the South American continent. In the strictly tropical areas of Africa, conditions are characterized by prevailing low barometric pressure, with conventional rainfall and alternate northward and southward movement of the heat equator; while in both the north and the south the ruling influences are the belts of high barometric pressure.
Except in the Atlas Mountains in the northwest where the considerable elevations set up a barrier in the path of trade winds and produce moderate rainfall, the desert conditions typified by the Sahara extend from the Atlantic to the Red Sea and from the Mediterranean southward well beyond the tropic of Cancer to about the latitudes of southern Arabia.
South of the Sahara, rainfall increases rapidly, becoming abundant to heavy from the west coast to the central lakes, with annual maxima of over 80 in in the regions bordering the eastern and western extremes of the Guinea coast. This marked increase in precipitation does not extend to the eastern portion of the middle region of the continent, where the annual amounts received are below 40 in and decrease to less than 10 in on the coasts of Somalia. Also to the south of the central rainy area there is a rapid fall in precipitation toward the regions of southwest Africa, where conditions are similar to those in Somalia.
The heavy rainfall over sections of Ethiopia from June to October, when more than 40 in fall and bring the overflowing of the Nile Valley, is one of Earth's outstanding features of seasonal distribution of rainfall.
Moist equatorial climate is typified by conditions in the Democratic Republic of the Congo; arid torrid climate by those of the Arabian Peninsula and the Sahara; and moderate plateau climate by those found in parts of Ethiopia, Kenya, and Tanzania.
Australia
In the southern winter the high-pressure belt crosses the interior of Australia, and all except the southernmost parts of the continent are dry. In summer, on the other hand, this pressure belt has moved south of the continent, still giving dry conditions over the southern and western areas. Thus, the total annual precipitation is less than 20 in except in the extreme southwest and in a strip circling from southeast to northwest. The average annual precipitation is even less than 10 in in a large south-central area.
In the south, the winter precipitation is the cyclonic type; the heavy summer rains of the north are of monsoon origin; and those of the eastern borders are in large part orographic, owing to the presence of the highlands in the immediate vicinity of the coasts. In the outer border of the rainfall strip along the coastal region, the mean annual rainfall is over 40 in and in many localities over 60 in. This is true for the monsoon rains in the north.
Because of the location of Australia, on both sides of the tropic of Capricorn, temperatures far below freezing are found only in a small part of the continent, in the south at high elevations. In the arid interior, extreme maximum temperatures are very high, ranking with those of the hottest regions on Earth.
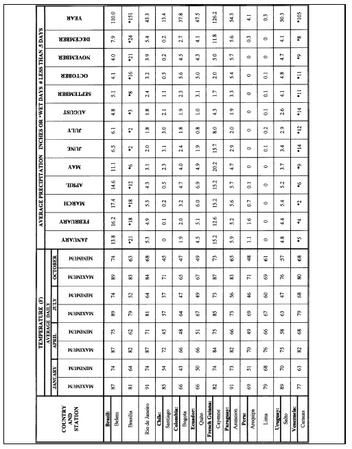
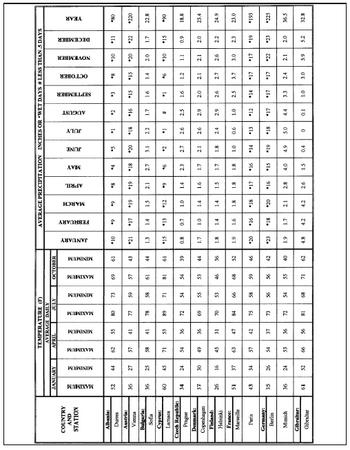
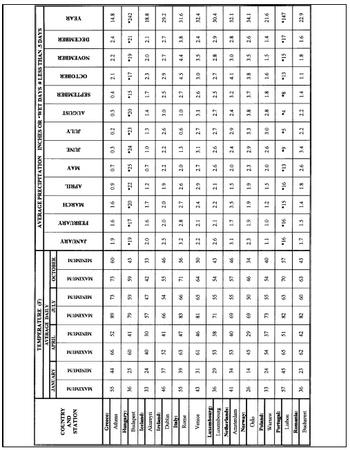
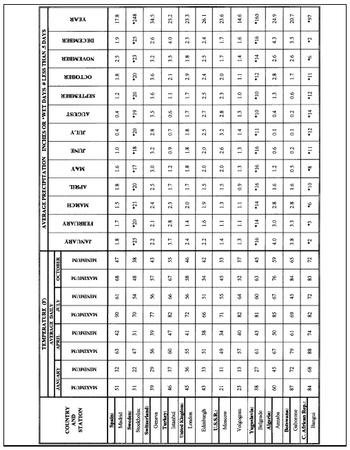
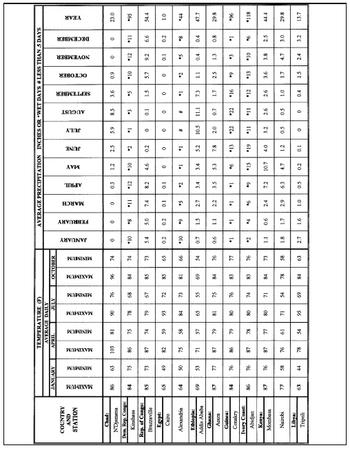
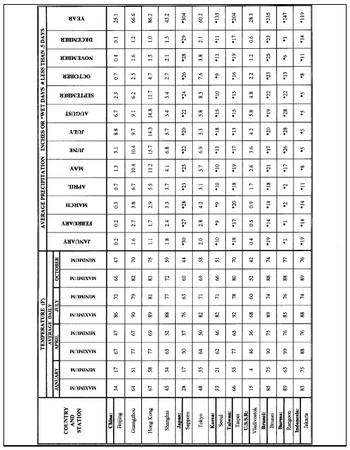
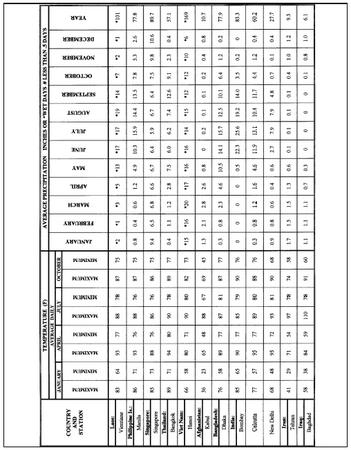
The following tables provide data on mean maximum and minimum temperatures for January, April, July, and October, with extremes recorded in the period of record, and monthly and annual precipitation for about 170 selected stations well-distributed worldwide.
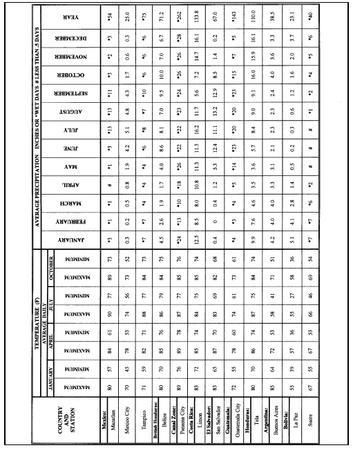
| COUNTRY AND STATION | TEMPERATURE (F) | AVERAGE PRECIPITATION INCHES OR *WET DAYS # LESS THAN .5 DAYS | |||||||||||||||||||
| AVERAGE DAILY | JANUARY | FEBRUARY | MARCH | APRIL | MAY | JUNE | JULY | AUGUST | SEPTEMBER | OCTOBER | NOVEMBER | DECEMBER | YEAR | ||||||||
| JANUARY | APRIL | JULY | OCTOBER | ||||||||||||||||||
| MAXIMUM | MINIMUM | MAXIMUM | MINIMUM | MAXIMUM | MINIMUM | MAXIMUM | MINIMUM | ||||||||||||||
| Mexico: | 80 | 57 | 84 | 61 | 90 | 77 | 89 | 73 | *3 | *1 | *1 | # | *1 | *3 | *13 | *13 | *11 | *3 | *2 | *3 | *54 |
| Mazatlan | |||||||||||||||||||||
| Mexico City | 70 | 45 | 78 | 53 | 74 | 56 | 73 | 52 | 0.3 | 0.2 | 0.5 | 0.8 | 1.9 | 4.2 | 5.1 | 4.8 | 4.3 | 1.7 | 0.6 | 0.3 | 25.0 |
| Tampico | 71 | 59 | 82 | 71 | 88 | 77 | 84 | 73 | *7 | *7 | *4 | *4 | *4 | *6 | *8 | *7 | *10 | *6 | *6 | *6 | *75 |
| British Honduras: | 80 | 70 | 85 | 76 | 86 | 79 | 84 | 75 | 4.5 | 2.6 | 1.9 | 1.7 | 4.0 | 8.6 | 8.1 | 7.0 | 9.5 | 10.0 | 7.0 | 6.7 | 71.2 |
| Belize | |||||||||||||||||||||
| Canal Zone: | 89 | 76 | 89 | 78 | 87 | 77 | 85 | 76 | *24 | *13 | *10 | *18 | *26 | *22 | *22 | *23 | *24 | *26 | *26 | *28 | *262 |
| Panama City | |||||||||||||||||||||
| Costa Rica: | 83 | 72 | 85 | 74 | 84 | 75 | 85 | 74 | 12.5 | 8.5 | 8.0 | 10.8 | 11.3 | 11.3 | 16.2 | 11.7 | 5.6 | 7.2 | 14.7 | 16.1 | 133.8 |
| Limon | |||||||||||||||||||||
| El Salvador: | 83 | 65 | 87 | 70 | 83 | 69 | 82 | 68 | 0.4 | 0 | 0.4 | 1.2 | 5.3 | 12.4 | 11.1 | 13.2 | 12.9 | 8.5 | 1.4 | 0.2 | 67.0 |
| San Salvador | |||||||||||||||||||||
| Guatemala: | 72 | 55 | 78 | 60 | 74 | 61 | 73 | 61 | *4 | *3 | *4 | *5 | *14 | *23 | *20 | *20 | *23 | *15 | *7 | *5 | *143 |
| Guatemala City | |||||||||||||||||||||
| Honduras: | 80 | 70 | 86 | 74 | 87 | 75 | 84 | 74 | 9.9 | 7.6 | 4.6 | 3.5 | 3.6 | 5.7 | 8.4 | 9.0 | 9.1 | 16.0 | 15.9 | 16.1 | 110.0 |
| Tela | |||||||||||||||||||||
| Argentina: | 85 | 64 | 72 | 53 | 58 | 41 | 71 | 51 | 4.2 | 4.0 | 4.0 | 3.3 | 3.1 | 2.1 | 2.3 | 2.3 | 2.4 | 4.0 | 3.6 | 3.3 | 38.5 |
| Buenos Aires | |||||||||||||||||||||
| Bolivia: | 55 | 39 | 57 | 36 | 55 | 27 | 58 | 36 | 5.1 | 4.1 | 2.8 | 1.4 | 0.5 | 0.2 | 0.3 | 0.6 | 1.2 | 1.6 | 2.0 | 3.7 | 23.1 |
| La Paz | |||||||||||||||||||||
| Sucre | 67 | 55 | 67 | 53 | 66 | 46 | 69 | 54 | *7 | *7 | *6 | *2 | # | # | # | *1 | *2 | *4 | *5 | *6 | *40 |
| COUNTRY AND STATION | TEMPERATURE (F) | AVERAGE PRECIPITATION INCHES OR *WET DAYS # LESS THAN .5 DAYS | |||||||||||||||||||
| AVERAGE DAILY | JANUARY | FEBRUARY | MARCH | APRIL | MAY | JUNE | JULY | AUGUST | SEPTEMBER | OCTOBER | NOVEMBER | DECEMBER | YEAR | ||||||||
| JANUARY | APRIL | JULY | OCTOBER | ||||||||||||||||||
| MAXIMUM | MINIMUM | MAXIMUM | MINIMUM | MAXIMUM | MINIMUM | MAXIMUM | MINIMUM | ||||||||||||||
| Brazil: | 87 | 74 | 87 | 75 | 89 | 74 | 89 | 74 | 13.8 | 16.2 | 17.4 | 14.6 | 11.1 | 6.5 | 6.1 | 4.8 | 5.1 | 4.1 | 4.0 | 7.9 | 110.0 |
| Belem | |||||||||||||||||||||
| Brasilia | 81 | 64 | 82 | 62 | 79 | 52 | 83 | 63 | *21 | *18 | *18 | *12 | *6 | *2 | *2 | *3 | *8 | *16 | *21 | *24 | *151 |
| Rio de Janeiro | 91 | 74 | 87 | 71 | 81 | 64 | 84 | 68 | 5.3 | 4.9 | 5.3 | 4.3 | 3.1 | 2.0 | 1.8 | 1.8 | 2.4 | 3.2 | 3.9 | 5.4 | 43.3 |
| Chile: | 85 | 54 | 72 | 45 | 57 | 37 | 71 | 45 | 0 | 0.1 | 0.2 | 0.5 | 2.3 | 3.1 | 3.0 | 2.1 | 1.1 | 0.5 | 0.2 | 0.2 | 13.4 |
| Santiago | |||||||||||||||||||||
| Colombia: | 66 | 43 | 66 | 48 | 64 | 47 | 65 | 47 | 1.9 | 2.0 | 3.2 | 4.7 | 4.0 | 2.4 | 1.8 | 1.9 | 2.3 | 5.6 | 4.5 | 2.7 | 37.8 |
| Bogota | |||||||||||||||||||||
| Ecuador: | 66 | 50 | 66 | 51 | 67 | 49 | 67 | 49 | 4.5 | 5.1 | 6.0 | 6.9 | 4.9 | 1.9 | 0.8 | 1.0 | 3.1 | 5.0 | 4.3 | 4.1 | 47.5 |
| Quito | |||||||||||||||||||||
| French Guiana: | 82 | 74 | 84 | 75 | 85 | 73 | 87 | 73 | 15.2 | 12.6 | 15.2 | 15.2 | 20.2 | 15.7 | 8.0 | 4.3 | 1.7 | 2.0 | 5.0 | 11.8 | 126.2 |
| Cayenne | |||||||||||||||||||||
| Paraguay: | 91 | 73 | 82 | 66 | 73 | 56 | 83 | 65 | 5.9 | 5.2 | 5.6 | 5.7 | 4.7 | 2.9 | 2.0 | 1.9 | 3.3 | 5.4 | 5.7 | 5.6 | 54.3 |
| Asuncion | |||||||||||||||||||||
| Peru: | 69 | 51 | 70 | 49 | 69 | 46 | 71 | 48 | 1.1 | 1.6 | 0.7 | 0.1 | 0 | 0 | 0 | 0 | 0 | 0 | 0 | 0.3 | 4.1 |
| Arequipa | |||||||||||||||||||||
| Lima | 79 | 68 | 76 | 66 | 67 | 60 | 69 | 61 | 0 | 0 | 0 | 0 | 0 | 0.1 | 0.2 | 0.1 | 0.1 | 0.1 | 0 | 0 | 0.3 |
| Uruguay: | 89 | 70 | 75 | 58 | 63 | 47 | 76 | 57 | 4.8 | 4.4 | 5.4 | 5.2 | 3.7 | 3.4 | 2.9 | 2.6 | 4.1 | 4.8 | 4.7 | 4.1 | 50.3 |
| Salto | |||||||||||||||||||||
| Venezuela: | 77 | 63 | 82 | 68 | 79 | 68 | 80 | 68 | *5 | *4 | *2 | *6 | *9 | *14 | *12 | *14 | *11 | *11 | *9 | *8 | *105 |
| Caracas | |||||||||||||||||||||
| COUNTRY AND STATION | TEMPERATURE (F) | AVERAGE PRECIPITATION INCHES OR *WET DAYS # LESS THAN .5 DAYS | |||||||||||||||||||
| AVERAGE DAILY | JANUARY | FEBRUARY | MARCH | APRIL | MAY | JUNE | JULY | AUGUST | SEPTEMBER | OCTOBER | NOVEMBER | DECEMBER | YEAR | ||||||||
| JANUARY | APRIL | JULY | OCTOBER | ||||||||||||||||||
| MAXIMUM | MINIMUM | MAXIMUM | MINIMUM | MAXIMUM | MINIMUM | MAXIMUM | MINIMUM | ||||||||||||||
| Albania: | 52 | 44 | 62 | 55 | 80 | 73 | 69 | 61 | *10 | *9 | *9 | *8 | *4 | *5 | *1 | *2 | *3 | *8 | *10 | *11 | *80 |
| Durres | |||||||||||||||||||||
| Austria: | 36 | 27 | 57 | 41 | 77 | 59 | 57 | 43 | *21 | *17 | *19 | *19 | *18 | *20 | *18 | *16 | *15 | *15 | *20 | *22 | *220 |
| Vienna | |||||||||||||||||||||
| Bulgaria: | 36 | 25 | 58 | 41 | 78 | 58 | 61 | 44 | 1.3 | 1.4 | 1.5 | 2.1 | 2.7 | 3.1 | 2.2 | 1.7 | 1.6 | 1.4 | 2.0 | 1.7 | 22.8 |
| Sofia | |||||||||||||||||||||
| Cyprus: | 60 | 45 | 71 | 53 | 89 | 71 | 81 | 61 | *15 | *13 | *12 | *9 | *6 | *2 | *1 | # | *1 | *6 | *10 | *15 | *90 |
| Larnaca | |||||||||||||||||||||
| Czech Republic: | 34 | 24 | 54 | 36 | 72 | 54 | 54 | 39 | 0.8 | 0.7 | 1.0 | 1.4 | 2.3 | 2.7 | 2.6 | 2.5 | 1.6 | 1.2 | 1.1 | 0.9 | 18.8 |
| Prague | |||||||||||||||||||||
| Denmark: | 37 | 30 | 49 | 36 | 69 | 55 | 53 | 44 | 1.7 | 1.0 | 1.4 | 1.6 | 1.7 | 2.1 | 2.6 | 2.9 | 2.0 | 2.1 | 2.1 | 2.0 | 25.4 |
| Copenhagen | |||||||||||||||||||||
| Finland: | 26 | 16 | 45 | 31 | 70 | 53 | 46 | 36 | 1.8 | 1.4 | 1.4 | 1.5 | 1.7 | 1.8 | 2.4 | 2.9 | 2.6 | 2.7 | 2.6 | 2.2 | 24.9 |
| Helsinki | |||||||||||||||||||||
| France: | 51 | 37 | 63 | 47 | 84 | 66 | 68 | 52 | 1.9 | 1.6 | 1.8 | 1.8 | 1.8 | 1.0 | 0.6 | 1.0 | 2.5 | 3.7 | 3.0 | 2.3 | 23.0 |
| Marseille | |||||||||||||||||||||
| Paris | 43 | 34 | 57 | 42 | 75 | 58 | 59 | 46 | *20 | *16 | *18 | *17 | *16 | *14 | *13 | *12 | *14 | *17 | *17 | *19 | *193 |
| Germany: | 35 | 26 | 54 | 37 | 73 | 56 | 56 | 42 | *23 | *18 | *20 | *16 | *15 | *19 | *18 | *17 | *17 | *17 | *22 | *23 | *225 |
| Berlin | |||||||||||||||||||||
| Munich | 36 | 24 | 53 | 36 | 72 | 54 | 55 | 40 | 1.9 | 1.7 | 2.1 | 2.8 | 4.0 | 4.9 | 5.0 | 4.4 | 3.3 | 2.4 | 2.1 | 2.0 | 36.5 |
| Gibraltar: | 61 | 52 | 66 | 56 | 81 | 68 | 71 | 62 | 4.8 | 4.2 | 4.2 | 2.6 | 1.5 | 0.4 | 0 | 0.1 | 1.0 | 3.0 | 5.9 | 5.2 | 32.8 |
| Gibraltar | |||||||||||||||||||||
| COUNTRY AND STATION | TEMPERATURE (F) | AVERAGE PRECIPITATION INCHES OR *WET DAYS # LESS THAN .5 DAYS | |||||||||||||||||||
| AVERAGE DAILY | JANUARY | FEBRUARY | MARCH | APRIL | MAY | JUNE | JULY | AUGUST | SEPTEMBER | OCTOBER | NOVEMBER | DECEMBER | YEAR | ||||||||
| JANUARY | APRIL | JULY | OCTOBER | ||||||||||||||||||
| MAXIMUM | MINIMUM | MAXIMUM | MINIMUM | MAXIMUM | MINIMUM | MAXIMUM | MINIMUM | ||||||||||||||
| Greece: | 55 | 44 | 66 | 52 | 89 | 73 | 73 | 60 | 1.9 | 1.6 | 1.6 | 0.9 | 0.7 | 0.3 | 0.2 | 0.3 | 0.4 | 2.1 | 2.2 | 2.4 | 14.8 |
| Athens | |||||||||||||||||||||
| Hungary: | 36 | 25 | 60 | 41 | 79 | 59 | 59 | 43 | *19 | *17 | *20 | *22 | *25 | *24 | *23 | *20 | *15 | *17 | *19 | *21 | *242 |
| Budapest | |||||||||||||||||||||
| Iceland: | 33 | 24 | 40 | 30 | 57 | 47 | 42 | 33 | 2.0 | 1.6 | 1.7 | 1.2 | 0.7 | 1.0 | 1.3 | 1.4 | 1.7 | 2.3 | 2.0 | 2.1 | 18.8 |
| Akureyri | |||||||||||||||||||||
| Ireland: | 46 | 37 | 52 | 41 | 66 | 54 | 55 | 46 | 2.5 | 2.0 | 2.0 | 1.9 | 2.2 | 2.2 | 2.6 | 3.0 | 2.5 | 2.9 | 2.7 | 2.7 | 29.2 |
| Dublin | |||||||||||||||||||||
| Italy: | 55 | 39 | 63 | 47 | 83 | 66 | 71 | 56 | 3.2 | 2.8 | 2.7 | 2.6 | 2.0 | 1.3 | 0.6 | 1.0 | 2.7 | 4.5 | 4.4 | 3.8 | 31.6 |
| Rome | |||||||||||||||||||||
| Venice | 43 | 31 | 61 | 46 | 81 | 65 | 64 | 50 | 2.2 | 2.1 | 2.4 | 2.9 | 2.7 | 3.1 | 2.7 | 3.1 | 2.6 | 3.0 | 3.5 | 2.4 | 32.4 |
| Luxembourg: | 36 | 29 | 53 | 38 | 71 | 55 | 54 | 43 | 2.6 | 2.1 | 2.2 | 2.1 | 2.6 | 2.6 | 2.7 | 2.7 | 2.5 | 2.7 | 2.8 | 2.9 | 30.4 |
| Luxembourg | |||||||||||||||||||||
| Netherlands: | 41 | 34 | 53 | 40 | 69 | 55 | 57 | 46 | 3.1 | 1.7 | 3.5 | 1.5 | 2.0 | 2.4 | 2.9 | 2.4 | 3.2 | 4.1 | 3.0 | 2.8 | 32.1 |
| Amsterdam | |||||||||||||||||||||
| Norway: | 26 | 14 | 45 | 29 | 69 | 50 | 46 | 34 | 2.3 | 1.9 | 1.9 | 1.9 | 2.3 | 2.9 | 3.3 | 3.8 | 3.7 | 3.8 | 3.5 | 2.6 | 34.1 |
| Oslo | |||||||||||||||||||||
| Poland: | 33 | 24 | 54 | 37 | 73 | 55 | 54 | 40 | 1.1 | 1.0 | 1.2 | 1.5 | 2.0 | 2.6 | 3.0 | 2.8 | 1.8 | 1.6 | 1.5 | 1.4 | 21.6 |
| Warsaw | |||||||||||||||||||||
| Portugal: | 57 | 45 | 65 | 51 | 82 | 63 | 70 | 57 | *16 | *16 | *15 | *16 | *13 | *9 | *5 | *4 | *8 | *13 | *15 | *17 | *147 |
| Lisbon | |||||||||||||||||||||
| Romania: | 36 | 23 | 62 | 42 | 82 | 60 | 63 | 43 | 1.7 | 1.5 | 1.4 | 1.8 | 2.6 | 3.4 | 2.2 | 2.2 | 1.4 | 1.1 | 1.8 | 1.6 | 22.9 |
| Bucharest | |||||||||||||||||||||
| COUNTRY AND STATION | TEMPERATURE (F) | AVERAGE PRECIPITATION INCHES OR *WET DAYS # LESS THAN .5 DAYS | |||||||||||||||||||
| AVERAGE DAILY | JANUARY | FEBRUARY | MARCH | APRIL | MAY | JUNE | JULY | AUGUST | SEPTEMBER | OCTOBER | NOVEMBER | DECEMBER | YEAR | ||||||||
| JANUARY | APRIL | JULY | OCTOBER | ||||||||||||||||||
| MAXIMUM | MINIMUM | MAXIMUM | MINIMUM | MAXIMUM | MINIMUM | MAXIMUM | MINIMUM | ||||||||||||||
| Spain: | 51 | 32 | 63 | 42 | 90 | 61 | 68 | 47 | 1.8 | 1.7 | 1.5 | 1.8 | 1.6 | 1.0 | 0.4 | 0.4 | 1.2 | 1.8 | 2.5 | 1.9 | 17.8 |
| Madrid | |||||||||||||||||||||
| Sweden: | 31 | 22 | 47 | 31 | 70 | 54 | 48 | 38 | *25 | *20 | *21 | *20 | *17 | *18 | *20 | *19 | *20 | *20 | *23 | *25 | *248 |
| Stockholm: | |||||||||||||||||||||
| Switzerland: | 39 | 29 | 56 | 39 | 77 | 56 | 57 | 43 | 2.2 | 2.1 | 2.4 | 2.5 | 3.0 | 3.2 | 2.8 | 3.5 | 3.6 | 3.6 | 3.2 | 2.6 | 34.5 |
| Geneva | |||||||||||||||||||||
| Turkey: | 46 | 37 | 60 | 47 | 82 | 66 | 67 | 55 | 3.7 | 2.8 | 2.3 | 1.7 | 1.2 | 0.9 | 0.7 | 0.6 | 1.1 | 2.1 | 3.5 | 4.0 | 25.2 |
| Istanbul | |||||||||||||||||||||
| United Kingdom: | 45 | 36 | 55 | 41 | 72 | 56 | 58 | 46 | 2.4 | 1.4 | 2.0 | 1.7 | 1.8 | 1.8 | 1.8 | 1.7 | 1.7 | 2.9 | 1.8 | 2.3 | 23.3 |
| London | |||||||||||||||||||||
| Edinburgh | 43 | 33 | 51 | 38 | 66 | 51 | 54 | 42 | 2.2 | 1.6 | 1.9 | 1.5 | 2.0 | 2.0 | 2.5 | 2.7 | 2.5 | 2.4 | 2.5 | 2.4 | 26.1 |
| U.S.S.R.: | 21 | 11 | 49 | 34 | 71 | 55 | 45 | 33 | 1.4 | 1.1 | 1.3 | 1.5 | 2.0 | 2.6 | 3.2 | 2.8 | 2.3 | 2.0 | 1.7 | 1.7 | 23.6 |
| Moscow | |||||||||||||||||||||
| Volgogran | 23 | 13 | 57 | 40 | 82 | 64 | 52 | 37 | 1.3 | 1.1 | 1.1 | 0.9 | 1.3 | 1.3 | 1.4 | 1.3 | 1.0 | 1.1 | 1.4 | 1.6 | 14.6 |
| Yugoslavia: | 38 | 27 | 61 | 43 | 81 | 60 | 63 | 45 | *16 | *14 | *14 | *16 | *16 | *16 | *11 | *10 | *10 | *12 | *14 | *16 | *165 |
| Belgrade | |||||||||||||||||||||
| Algeria: | 60 | 45 | 67 | 50 | 85 | 67 | 76 | 59 | 4.0 | 3.0 | 2.8 | 1.6 | 1.2 | 0.6 | 0.1 | 0.4 | 1.3 | 2.8 | 2.6 | 4.3 | 24.9 |
| Annaba | |||||||||||||||||||||
| Botswana: | 87 | 72 | 79 | 61 | 69 | 45 | 84 | 65 | 3.8 | 3.3 | 2.8 | 1.6 | 0.5 | 0.2 | 0.1 | 0.2 | 0.6 | 1.7 | 2.6 | 3.5 | 20.7 |
| Gaborone | |||||||||||||||||||||
| C. African Rep.: | 84 | 68 | 88 | 74 | 82 | 72 | 83 | 72 | *2 | *3 | *6 | *10 | *8 | *11 | *12 | *14 | *12 | *11 | *6 | *2 | *97 |
| Bangui | |||||||||||||||||||||
| COUNTRY AND STATION | TEMPERATURE (F) | AVERAGE PRECIPITATION INCHES OR *WET DAYS # LESS THAN .5 DAYS | |||||||||||||||||||
| AVERAGE DAILY | JANUARY | FEBRUARY | MARCH | APRIL | MAY | JUNE | JULY | AUGUST | SEPTEMBER | OCTOBER | NOVEMBER | DECEMBER | YEAR | ||||||||
| JANUARY | APRIL | JULY | OCTOBER | ||||||||||||||||||
| MAXIMUM | MINIMUM | MAXIMUM | MINIMUM | MAXIMUM | MINIMUM | MAXIMUM | MINIMUM | ||||||||||||||
| Chad: | 86 | 63 | 103 | 81 | 90 | 76 | 96 | 74 | 0 | 0 | 0 | 0.3 | 1.2 | 2.5 | 5.9 | 8.5 | 3.6 | 0.9 | 0 | 0 | 23.0 |
| N'Djamena | |||||||||||||||||||||
| Dem. Rep. Congo: | 84 | 75 | 86 | 75 | 78 | 68 | 84 | 74 | *10 | *8 | *11 | *12 | *10 | *2 | *1 | *3 | *5 | *10 | *12 | *11 | *95 |
| Kinshasa | |||||||||||||||||||||
| Rep. of Congo: | 85 | 73 | 87 | 74 | 79 | 67 | 85 | 73 | 5.4 | 5.0 | 7.4 | 8.2 | 4.6 | 0.2 | 0 | 0.1 | 1.5 | 5.7 | 9.2 | 6.6 | 54.4 |
| Brazzaville | |||||||||||||||||||||
| Egypt: | 65 | 49 | 82 | 59 | 93 | 72 | 85 | 65 | 0.2 | 0.2 | 0.1 | 0.1 | 0 | 0 | 0 | 0 | 0 | 0 | 0.1 | 0.2 | 1.0 |
| Cairo | |||||||||||||||||||||
| Alexandria | |||||||||||||||||||||
| 64 | 50 | 75 | 58 | 84 | 73 | 81 | 66 | *1 | *9 | *5 | *2 | *1 | *1 | # | # | *1 | *2 | *5 | *8 | *4 | |
| Ethiopia: | 69 | 53 | 71 | 57 | 65 | 55 | 69 | 54 | 0.7 | 1.5 | 2.7 | 3.4 | 3.4 | 5.2 | 10.5 | 11.1 | 7.3 | 1.1 | 0.4 | 0.4 | 47.7 |
| Addis Ababa | |||||||||||||||||||||
| Ghana: | 87 | 77 | 87 | 79 | 81 | 75 | 84 | 76 | 0.6 | 1.1 | 2.2 | 3.5 | 5.3 | 7.8 | 2.0 | 0.7 | 1.7 | 2.5 | 1.3 | 0.8 | 29.8 |
| Accra | |||||||||||||||||||||
| Guinea: | 84 | 76 | 86 | 79 | 80 | 76 | 83 | 77 | *1 | *1 | *1 | *1 | *6 | *13 | *22 | *22 | *16 | *9 | *3 | *1 | *96 |
| Conakry | |||||||||||||||||||||
| Ivory Coast: | 86 | 76 | 87 | 78 | 80 | 74 | 83 | 76 | *2 | *4 | *6 | *9 | *15 | *19 | *11 | *11 | *12 | *13 | *10 | *6 | *118 |
| Abidjan | |||||||||||||||||||||
| Kenya: | 87 | 76 | 87 | 77 | 80 | 71 | 84 | 73 | 1.1 | 0.6 | 2.4 | 7.2 | 10.7 | 4.0 | 3.2 | 2.6 | 2.6 | 3.6 | 3.8 | 2.5 | 44.4 |
| Mombasa | |||||||||||||||||||||
| Nairobi | 77 | 58 | 76 | 61 | 71 | 54 | 78 | 58 | 1.8 | 1.7 | 2.9 | 6.3 | 4.7 | 1.2 | 0.5 | 0.5 | 1.0 | 1.7 | 4.7 | 3.0 | 29.8 |
| Libya: | 63 | 44 | 78 | 54 | 95 | 69 | 84 | 63 | 2.7 | 1.6 | 1.0 | 0.5 | 0.2 | 0.1 | 0 | 0 | 0.4 | 1.5 | 2.4 | 3.2 | 13.7 |
| Tripoli | |||||||||||||||||||||

| COUNTRY AND STATION | TEMPERATURE (F) | AVERAGE PRECIPITATION INCHES OR *WET DAYS # LESS THAN .5 DAYS | |||||||||||||||||||
| AVERAGE DAILY | JANUARY | FEBRUARY | MARCH | APRIL | MAY | JUNE | JULY | AUGUST | SEPTEMBER | OCTOBER | NOVEMBER | DECEMBER | YEAR | ||||||||
| JANUARY | APRIL | JULY | OCTOBER | ||||||||||||||||||
| MAXIMUM | MINIMUM | MAXIMUM | MINIMUM | MAXIMUM | MINIMUM | MAXIMUM | MINIMUM | ||||||||||||||
| Morocco: | 62 | 47 | 66 | 53 | 77 | 68 | 72 | 60 | 2.2 | 2.1 | 2.0 | 1.5 | 0.8 | 0.2 | 0 | 0 | 0.2 | 1.3 | 2.6 | 2.9 | 16.1 |
| Casablanca | |||||||||||||||||||||
| Rabat | 62 | 46 | 67 | 52 | 80 | 65 | 74 | 58 | 3.2 | 2.7 | 2.6 | 2.2 | 1.0 | 0.3 | 0 | 0 | 0.3 | 1.8 | 3.3 | 4.0 | 21.5 |
| Niger: | 88 | 64 | 104 | 81 | 92 | 76 | 99 | 76 | # | # | *1 | *1 | *4 | *6 | *9 | *11 | *8 | *2 | *1 | # | *43 |
| Niamey | |||||||||||||||||||||
| Nigeria: | 82 | 79 | 84 | 81 | 79 | 76 | 80 | 77 | *1 | *1 | *3 | *3 | *5 | *8 | *6 | *7 | *9 | *6 | *2 | *2 | *53 |
| Lagos | |||||||||||||||||||||
| Senegal: | 75 | 65 | 75 | 66 | 84 | 77 | 86 | 77 | *2 | *1 | *1 | # | *1 | *2 | *7 | *13 | *9 | *3 | *1 | *1 | *41 |
| Dakar | |||||||||||||||||||||
| Sierra Leone: | 84 | 76 | 86 | 79 | 81 | 76 | 82 | 76 | 0.3 | 0.3 | 0.9 | 3.1 | 9.3 | 16.6 | 23.5 | 22.0 | 22.5 | 11.9 | 5.4 | 1.3 | 118.0 |
| Freetown/Lungi | |||||||||||||||||||||
| Somalia: | 85 | 79 | 87 | 82 | 82 | 78 | 84 | 79 | 0 | 0 | 0.3 | 2.3 | 2.3 | 3.1 | 2.6 | 1.7 | 0.8 | 1.2 | 1.6 | 0.3 | 16.2 |
| Mogadishu | |||||||||||||||||||||
| South Africa: | 77 | 63 | 72 | 56 | 62 | 47 | 69 | 54 | *6 | *5 | *6 | *9 | *12 | *13 | *14 | *13 | *11 | *9 | *7 | *7 | *112 |
| Capetown | |||||||||||||||||||||
| Tanzania: | 87 | 77 | 85 | 74 | 82 | 67 | 86 | 70 | 2.8 | 2.5 | 5.0 | 10.6 | 7.2 | 1.3 | 1.1 | 1.0 | 1.1 | 1.9 | 3.3 | 3.7 | 41.6 |
| Dar es Salaam | |||||||||||||||||||||
| Tunisia: | 60 | 46 | 68 | 51 | 90 | 69 | 78 | 61 | 2.4 | 2.1 | 1.8 | 1.5 | 0.9 | 0.4 | 0.1 | 0.3 | 1.3 | 2.2 | 2.1 | 2.5 | 17.5 |
| Tunis | |||||||||||||||||||||
| Zambia: | 78 | 68 | 77 | 63 | 72 | 51 | 85 | 68 | *13 | *12 | *9 | *4 | *1 | # | # | # | # | *2 | *6 | *13 | *60 |
| Lusaka | |||||||||||||||||||||
| Zimbabwe: | 78 | 63 | 77 | 59 | 69 | 49 | 80 | 59 | *19 | *16 | *15 | *9 | *4 | *2 | *1 | *1 | *2 | *7 | *12 | *19 | *107 |
| Harare | |||||||||||||||||||||
| COUNTRY AND STATION | TEMPERATURE (F) | AVERAGE PRECIPITATION INCHES OR *WET DAYS # LESS THAN .5 DAYS | |||||||||||||||||||
| AVERAGE DAILY | JANUARY | FEBRUARY | MARCH | APRIL | MAY | JUNE | JULY | AUGUST | SEPTEMBER | OCTOBER | NOVEMBER | DECEMBER | YEAR | ||||||||
| JANUARY | APRIL | JULY | OCTOBER | ||||||||||||||||||
| MAXIMUM | MINIMUM | MAXIMUM | MINIMUM | MAXIMUM | MINIMUM | MAXIMUM | MINIMUM | ||||||||||||||
| China: | 34 | 17 | 67 | 47 | 86 | 72 | 66 | 47 | 0.2 | 0.2 | 0.3 | 0.7 | 1.3 | 3.1 | 8.8 | 6.7 | 2.3 | 0.7 | 0.4 | 0.1 | 25.1 |
| Beijing | |||||||||||||||||||||
| Guangzhou | 64 | 51 | 77 | 67 | 90 | 79 | 82 | 70 | 1.6 | 2.7 | 3.8 | 6.7 | 10.4 | 10.4 | 9.7 | 9.1 | 6.2 | 2.5 | 1.6 | 1.2 | 66.6 |
| Hong Kong | 67 | 58 | 77 | 69 | 89 | 81 | 83 | 75 | 1.1 | 1.7 | 2.9 | 5.5 | 11.2 | 15.7 | 14.3 | 14.8 | 11.7 | 4.7 | 1.5 | 1.0 | 86.2 |
| Shanghai | 45 | 34 | 65 | 52 | 88 | 77 | 72 | 59 | 1.8 | 2.4 | 3.3 | 3.7 | 4.1 | 6.8 | 5.7 | 5.4 | 5.4 | 2.7 | 2.1 | 1.5 | 45.2 |
| Japan: | 28 | 17 | 50 | 37 | 76 | 63 | 60 | 44 | *30 | *27 | *28 | *23 | *25 | *22 | *20 | *22 | *24 | *26 | *28 | *29 | *304 |
| Sapporo | |||||||||||||||||||||
| Tokyo | 48 | 35 | 64 | 50 | 82 | 71 | 69 | 58 | 2.0 | 2.8 | 4.2 | 5.1 | 5.7 | 6.9 | 5.3 | 5.8 | 8.5 | 7.6 | 3.8 | 2.1 | 60.2 |
| Korea: | 33 | 21 | 62 | 46 | 82 | 71 | 66 | 51 | *10 | *9 | *9 | *10 | *10 | *13 | *18 | *15 | *10 | *9 | *11 | *11 | *135 |
| Seoul | |||||||||||||||||||||
| Taiwan: | 66 | 55 | 77 | 65 | 92 | 78 | 80 | 70 | *18 | *17 | *20 | *18 | *19 | *17 | *13 | *15 | *15 | *16 | *19 | *17 | *204 |
| Taipei | |||||||||||||||||||||
| U.S.S.R: | 15 | 4 | 46 | 36 | 68 | 60 | 52 | 42 | 0.4 | 0.5 | 0.9 | 1.7 | 2.6 | 3.6 | 4.2 | 5.8 | 4.8 | 2.2 | 1.2 | 0.6 | 28.3 |
| Vladivostok | |||||||||||||||||||||
| Brunei: | 85 | 75 | 90 | 75 | 89 | 74 | 88 | 74 | *19 | *14 | *14 | *18 | *21 | *17 | *20 | *19 | *22 | *23 | *25 | *23 | *235 |
| Brunei | |||||||||||||||||||||
| Burma: | 89 | 65 | 99 | 76 | 85 | 76 | 88 | 77 | *1 | *1 | *2 | *2 | *17 | *26 | *28 | *28 | *22 | *13 | *6 | *1 | *147 |
| Rangoon | |||||||||||||||||||||
| Indonesia: | 83 | 75 | 88 | 76 | 88 | 74 | 89 | 76 | *19 | *14 | *14 | *11 | *8 | *5 | *5 | *5 | *5 | *8 | *11 | *14 | *119 |
| Jakarta | |||||||||||||||||||||
| COUNTRY AND STATION | TEMPERATURE (F) | AVERAGE PRECIPITATION INCHES OR *WET DAYS # LESS THAN .5 DAYS | |||||||||||||||||||
| AVERAGE DAILY | JANUARY | FEBRUARY | MARCH | APRIL | MAY | JUNE | JULY | AUGUST | SEPTEMBER | OCTOBER | NOVEMBER | DECEMBER | YEAR | ||||||||
| JANUARY | APRIL | JULY | OCTOBER | ||||||||||||||||||
| MAXIMUM | MINIMUM | MAXIMUM | MINIMUM | MAXIMUM | MINIMUM | MAXIMUM | MINIMUM | ||||||||||||||
| Laos: | 83 | 64 | 93 | 77 | 88 | 78 | 87 | 75 | *2 | *1 | *3 | *5 | *13 | *17 | *17 | *19 | *14 | *7 | *2 | *1 | *101 |
| Vientiane | |||||||||||||||||||||
| Philippine Is.: | 86 | 71 | 93 | 76 | 88 | 76 | 87 | 75 | 0.8 | 0.4 | 0.6 | 1.2 | 4.9 | 10.3 | 15.9 | 14.4 | 13.5 | 7.8 | 5.3 | 2.6 | 77.8 |
| Manila | |||||||||||||||||||||
| Singapore: | 85 | 73 | 88 | 76 | 86 | 76 | 86 | 75 | 9.4 | 6.5 | 6.8 | 6.6 | 6.7 | 6.4 | 5.9 | 6.7 | 6.4 | 7.5 | 9.8 | 10.6 | 89.7 |
| Singapore | |||||||||||||||||||||
| Thailand: | 89 | 71 | 94 | 80 | 90 | 78 | 89 | 77 | 0.4 | 1.1 | 1.2 | 2.8 | 7.5 | 6.0 | 6.2 | 7.4 | 12.6 | 9.1 | 2.3 | 0.4 | 57.1 |
| Bangkok | |||||||||||||||||||||
| Viet Nam: | 66 | 58 | 80 | 71 | 90 | 80 | 82 | 73 | *15 | *16 | *20 | *17 | *16 | *16 | *14 | *15 | *12 | *12 | *10 | *6 | *169 |
| Hamoi | |||||||||||||||||||||
| Afghanistan: | 36 | 23 | 65 | 48 | 88 | 67 | 69 | 45 | 1.3 | 2.1 | 2.8 | 2.6 | 0.8 | 0 | 0.2 | 0.1 | 0.1 | 0.2 | 0.4 | 0.8 | 10.7 |
| Kabul | |||||||||||||||||||||
| Bangladesh: | 76 | 58 | 89 | 77 | 87 | 81 | 87 | 77 | 0.3 | 0.8 | 2.3 | 4.6 | 10.5 | 14.1 | 15.7 | 12.5 | 10.1 | 6.4 | 1.2 | 0.2 | 77.9 |
| Dhaka | |||||||||||||||||||||
| India: | 85 | 65 | 90 | 77 | 85 | 79 | 90 | 76 | 0 | 0 | 0 | 0 | 0.5 | 22.3 | 25.6 | 19.2 | 14.0 | 3.5 | 0.2 | 0 | 83.3 |
| Bombay | |||||||||||||||||||||
| Calcutta | 77 | 57 | 95 | 77 | 89 | 80 | 88 | 76 | 0.3 | 0.8 | 1.2 | 1.6 | 4.6 | 11.9 | 13.1 | 10.4 | 11.7 | 4.4 | 1.2 | 0.4 | 60.2 |
| New Delhi | 68 | 48 | 95 | 72 | 93 | 81 | 90 | 68 | 0.9 | 0.8 | 0.6 | 0.4 | 0.6 | 2.7 | 7.9 | 7.9 | 4.8 | 0.7 | 0.1 | 0.4 | 27.7 |
| Iran: | 41 | 29 | 71 | 54 | 97 | 78 | 74 | 58 | 1.7 | 1.5 | 1.5 | 1.3 | 0.6 | 0.1 | 0.1 | 0.1 | 0.1 | 0.4 | 1.0 | 1.2 | 9.3 |
| Tehran | |||||||||||||||||||||
| Iraq: | 58 | 38 | 84 | 59 | 110 | 78 | 91 | 60 | 1.1 | 1.1 | 1.1 | 0.7 | 0.3 | 0 | 0 | 0 | 0 | 0.1 | 0.8 | 1.0 | 6.1 |
| Baghdad | |||||||||||||||||||||
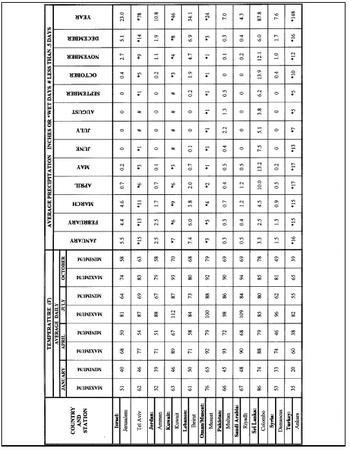
| COUNTRY AND STATION | TEMPERATURE (F) | AVERAGE PRECIPITATION INCHES OR *WET DAYS # LESS THAN .5 DAYS | |||||||||||||||||||
| AVERAGE DAILY | JANUARY | FEBRUARY | MARCH | APRIL | MAY | JUNE | JULY | AUGUST | SEPTEMBER | OCTOBER | NOVEMBER | DECEMBER | YEAR | ||||||||
| JANUARY | APRIL | JULY | OCTOBER | ||||||||||||||||||
| MAXIMUM | MINIMUM | MAXIMUM | MINIMUM | MAXIMUM | MINIMUM | MAXIMUM | MINIMUM | ||||||||||||||
| Israel: | 51 | 40 | 68 | 50 | 81 | 64 | 74 | 58 | 5.5 | 4.4 | 4.6 | 0.7 | 0.2 | 0 | 0 | 0 | 0 | 0.4 | 2.7 | 5.1 | 23.0 |
| Jerusalem | |||||||||||||||||||||
| Tel Aviv | 62 | 46 | 77 | 54 | 87 | 69 | 83 | 63 | *15 | *13 | *11 | *6 | *3 | *1 | # | # | *1 | *5 | *9 | *14 | *78 |
| Jordan: | 52 | 39 | 71 | 51 | 88 | 67 | 79 | 58 | 2.5 | 2.5 | 1.7 | 0.7 | 0.1 | 0 | 0 | 0 | 0 | 0.2 | 1.1 | 1.9 | 10.8 |
| Amman | |||||||||||||||||||||
| Kuwait: | 63 | 46 | 89 | 67 | 112 | 87 | 93 | 70 | *7 | *6 | *9 | *6 | *3 | # | # | # | # | *3 | *4 | *8 | *46 |
| Kuwait | |||||||||||||||||||||
| Lebanon: | 61 | 50 | 71 | 58 | 84 | 73 | 80 | 68 | 7.4 | 6.0 | 3.8 | 2.0 | 0.7 | 0.1 | 0 | 0 | 0.2 | 1.9 | 4.7 | 6.9 | 34.1 |
| Beirut | |||||||||||||||||||||
| Oman/Muscat: | 76 | 65 | 92 | 79 | 100 | 88 | 92 | 79 | *3 | *5 | *4 | *2 | *1 | *1 | *1 | *1 | *1 | *1 | *1 | *3 | *24 |
| Muscat | |||||||||||||||||||||
| Pakistan: | 66 | 45 | 93 | 72 | 98 | 86 | 90 | 69 | 0.3 | 0.3 | 0.7 | 0.4 | 0.5 | 0.4 | 2.2 | 1.3 | 0.5 | 0 | 0.1 | 0.3 | 7.0 |
| Multan | |||||||||||||||||||||
| Saudi Arabia: | 67 | 48 | 90 | 68 | 109 | 84 | 94 | 69 | 0.5 | 0.4 | 1.2 | 1.2 | 0.5 | 0 | 0 | 0 | 0 | 0 | 0.2 | 0.4 | 4.3 |
| Riyadh | |||||||||||||||||||||
| Sri Lanka: | 86 | 74 | 88 | 79 | 85 | 80 | 85 | 78 | 3.3 | 2.5 | 4.5 | 10.0 | 13.2 | 7.5 | 5.1 | 3.8 | 6.2 | 13.9 | 12.1 | 6.0 | 87.8 |
| Colombo | |||||||||||||||||||||
| Syria: | 53 | 33 | 74 | 46 | 96 | 62 | 81 | 49 | 1.5 | 1.3 | 0.9 | 0.5 | 0.2 | 0 | 0 | 0 | 0 | 0.4 | 1.0 | 1.7 | 7.6 |
| Damascus | |||||||||||||||||||||
| Turkey: | 35 | 20 | 60 | 38 | 82 | 55 | 65 | 39 | *16 | *15 | *15 | *17 | *17 | *13 | *7 | *5 | *5 | *10 | *12 | *16 | *148 |
| Ankara | |||||||||||||||||||||
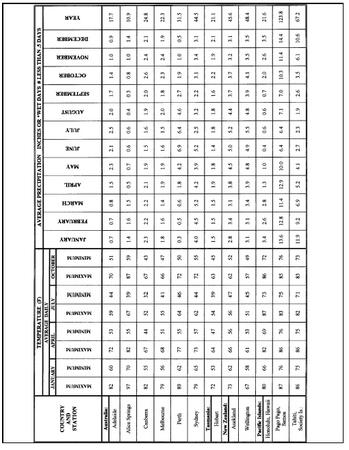
| COUNTRY AND STATION | TEMPERATURE (F) | AVERAGE PRECIPITATION INCHES OR *WET DAYS # LESS THAN .5 DAYS | |||||||||||||||||||
| AVERAGE DAILY | JANUARY | FEBRUARY | MARCH | APRIL | MAY | JUNE | JULY | AUGUST | SEPTEMBER | OCTOBER | NOVEMBER | DECEMBER | YEAR | ||||||||
| JANUARY | APRIL | JULY | OCTOBER | ||||||||||||||||||
| MAXIMUM | MINIMUM | MAXIMUM | MINIMUM | MAXIMUM | MINIMUM | MAXIMUM | MINIMUM | ||||||||||||||
| Australia: | 82 | 60 | 72 | 53 | 59 | 44 | 70 | 51 | 0.7 | 0.7 | 0.8 | 1.5 | 2.3 | 2.1 | 2.5 | 2.0 | 1.7 | 1.4 | 1.0 | 0.9 | 17.7 |
| Adelaide | |||||||||||||||||||||
| Alice Springs | 97 | 70 | 82 | 55 | 67 | 39 | 87 | 59 | 1.4 | 1.6 | 1.5 | 0.5 | 0.7 | 0.6 | 0.6 | 0.4 | 0.3 | 0.8 | 1.0 | 1.4 | 10.9 |
| Canberra | 82 | 55 | 67 | 44 | 52 | 32 | 67 | 43 | 2.3 | 2.2 | 2.2 | 2.1 | 1.9 | 1.5 | 1.6 | 1.9 | 2.0 | 2.6 | 2.4 | 2.1 | 24.8 |
| Melbourne | 79 | 56 | 68 | 51 | 55 | 41 | 66 | 47 | 1.8 | 1.6 | 1.4 | 1.9 | 1.9 | 1.6 | 1.5 | 2.0 | 1.8 | 2.3 | 2.4 | 1.9 | 22.3 |
| Perth | 89 | 62 | 77 | 55 | 64 | 46 | 72 | 50 | 0.3 | 0.5 | 0.6 | 1.8 | 4.2 | 6.9 | 6.4 | 4.6 | 2.7 | 1.9 | 1.0 | 0.5 | 31.5 |
| Sydney | 79 | 65 | 73 | 57 | 62 | 44 | 72 | 55 | 4.0 | 4.5 | 5.2 | 4.2 | 3.9 | 5.2 | 2.5 | 3.2 | 2.2 | 3.1 | 3.4 | 3.1 | 44.5 |
| Tasmania: | 72 | 53 | 64 | 47 | 54 | 39 | 63 | 45 | 1.5 | 1.5 | 1.5 | 1.9 | 1.8 | 1.4 | 1.8 | 1.8 | 1.6 | 2.2 | 1.9 | 2.1 | 21.1 |
| Hobart | |||||||||||||||||||||
| New Zealand: | 73 | 62 | 66 | 56 | 56 | 47 | 62 | 52 | 2.8 | 3.4 | 3.1 | 3.8 | 4.5 | 5.0 | 5.2 | 4.4 | 3.7 | 3.7 | 3.2 | 3.1 | 45.6 |
| Auckland | |||||||||||||||||||||
| Wellington | 67 | 58 | 61 | 53 | 51 | 45 | 57 | 49 | 3.1 | 3.1 | 3.4 | 3.9 | 4.8 | 4.9 | 5.5 | 4.8 | 3.9 | 4.1 | 3.5 | 3.5 | 48.4 |
| Pacific Islands: | 80 | 66 | 82 | 69 | 87 | 73 | 86 | 72 | 3.4 | 2.6 | 2.8 | 1.3 | 1.0 | 0.4 | 0.6 | 0.6 | 0.7 | 2.0 | 2.6 | 3.5 | 21.6 |
| Honolulu, Hawaii | |||||||||||||||||||||
| Pago Pago, Samoa | 87 | 76 | 86 | 76 | 83 | 75 | 85 | 76 | 13.6 | 12.8 | 11.4 | 12.9 | 10.0 | 6.4 | 6.4 | 7.1 | 7.0 | 10.3 | 11.4 | 14.4 | 123.8 |
| Tahiti, Society Is.: | 86 | 75 | 86 | 75 | 82 | 71 | 83 | 73 | 11.9 | 9.2 | 6.9 | 5.2 | 4.1 | 2.7 | 2.3 | 1.9 | 2.6 | 3.5 | 6.1 | 10.6 | 67.2 |
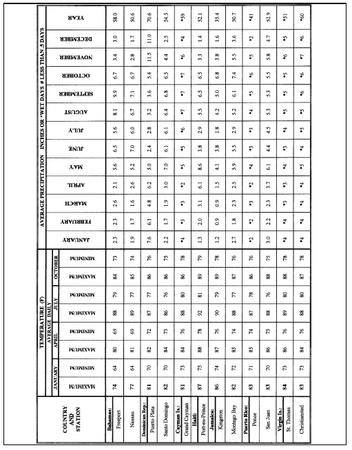
| COUNTRY AND STATION | TEMPERATURE (F) | AVERAGE PRECIPITATION INCHES OR *WET DAYS # LESS THAN .5 DAYS | |||||||||||||||||||
| AVERAGE DAILY | JANUARY | FEBRUARY | MARCH | APRIL | MAY | JUNE | JULY | AUGUST | SEPTEMBER | OCTOBER | NOVEMBER | DECEMBER | YEAR | ||||||||
| JANUARY | APRIL | JULY | OCTOBER | ||||||||||||||||||
| MAXIMUM | MINIMUM | MAXIMUM | MINIMUM | MAXIMUM | MINIMUM | MAXIMUM | MINIMUM | ||||||||||||||
| Bahamas: | 74 | 64 | 80 | 69 | 88 | 79 | 84 | 73 | 2.3 | 2.3 | 2.6 | 2.1 | 5.6 | 6.5 | 5.6 | 8.1 | 9.9 | 6.7 | 3.4 | 3.0 | 58.0 |
| Freeport | |||||||||||||||||||||
| Nassau | 77 | 64 | 81 | 69 | 89 | 77 | 85 | 74 | 1.9 | 1.7 | 1.6 | 2.6 | 5.2 | 7.0 | 6.0 | 6.7 | 7.1 | 6.7 | 2.8 | 1.7 | 50.6 |
| Dominican Rep.: | 81 | 70 | 82 | 72 | 87 | 77 | 86 | 76 | 7.6 | 6.1 | 4.8 | 6.2 | 5.0 | 2.4 | 2.8 | 3.2 | 3.6 | 5.4 | 11.5 | 11.0 | 70.6 |
| Puerto Plata | |||||||||||||||||||||
| Santo Domingo | 82 | 70 | 84 | 73 | 86 | 76 | 86 | 75 | 2.2 | 1.7 | 1.9 | 3.0 | 7.0 | 6.1 | 6.1 | 6.4 | 6.8 | 6.5 | 4.4 | 2.5 | 54.5 |
| Cayman Is.: | 81 | 73 | 84 | 76 | 88 | 80 | 86 | 78 | *4 | *3 | *3 | *2 | *5 | *5 | *6 | *7 | *7 | *7 | *6 | *4 | *59 |
| Grand Cayman | |||||||||||||||||||||
| Haiti: | 87 | 75 | 88 | 78 | 92 | 81 | 89 | 79 | 1.3 | 2.0 | 3.1 | 6.1 | 8.6 | 3.8 | 2.9 | 5.5 | 6.5 | 6.5 | 3.3 | 1.4 | 52.1 |
| Port-au-Prince | |||||||||||||||||||||
| Jamaica: | 86 | 74 | 87 | 76 | 90 | 79 | 89 | 78 | 1.2 | 0.9 | 0.9 | 1.5 | 4.1 | 3.8 | 1.8 | 4.2 | 5.0 | 6.8 | 3.8 | 1.6 | 35.4 |
| Kingston | |||||||||||||||||||||
| Montego Bay | 82 | 72 | 85 | 74 | 88 | 77 | 87 | 76 | 2.7 | 1.8 | 2.3 | 2.5 | 5.9 | 5.5 | 2.9 | 5.2 | 6.1 | 7.4 | 5.5 | 3.6 | 50.7 |
| Puerto Rico: | 83 | 71 | 85 | 74 | 87 | 78 | 86 | 76 | *2 | *2 | *3 | *2 | *4 | *3 | *3 | *4 | *5 | *6 | *5 | *2 | *41 |
| Ponce | |||||||||||||||||||||
| San Juan | 83 | 70 | 86 | 73 | 88 | 76 | 88 | 75 | 3.0 | 2.2 | 2.3 | 3.7 | 6.1 | 4.4 | 4.5 | 5.3 | 5.3 | 5.5 | 5.8 | 4.7 | 52.9 |
| Virgin Is.: | 84 | 73 | 86 | 76 | 89 | 80 | 88 | 78 | *4 | *4 | *3 | *3 | *4 | *3 | *4 | *5 | *5 | *5 | *6 | *5 | *51 |
| St. Thomas | |||||||||||||||||||||
| Christiansted | 83 | 73 | 84 | 76 | 88 | 80 | 87 | 78 | *4 | *4 | *4 | *4 | *5 | *4 | *5 | *5 | *6 | *6 | *7 | *6 | *60 |
Comment about this article, ask questions, or add new information about this topic: